20 Years of Historical Financial Statements
The proof is in the pudding, as they say. When it comes to analyzing a company's financial health, historical financial statements are the pudding. They provide a clear picture of a company's financial performance over time, allowing you to identify trends, patterns, and potential risks.
The problem is, finding historical financial statements for a company can be a time-consuming and frustrating process. Not only that but once you find the data, you need to organize or consolidate the data in a way that makes sense and is easy to analyze.
At SheetsFinance we're on a mission to continue democratizing financial data, making it accessible to everyone. That's why we've created a free template that allows you to explore 20 years of historical financial data for any stock in our database.
How does it work?
- Open the template link and create a copy
- To switch between companies, simply change the ticker symbol in cell
A2to your desired ticker, and the data will automatically update across all 3 statements.
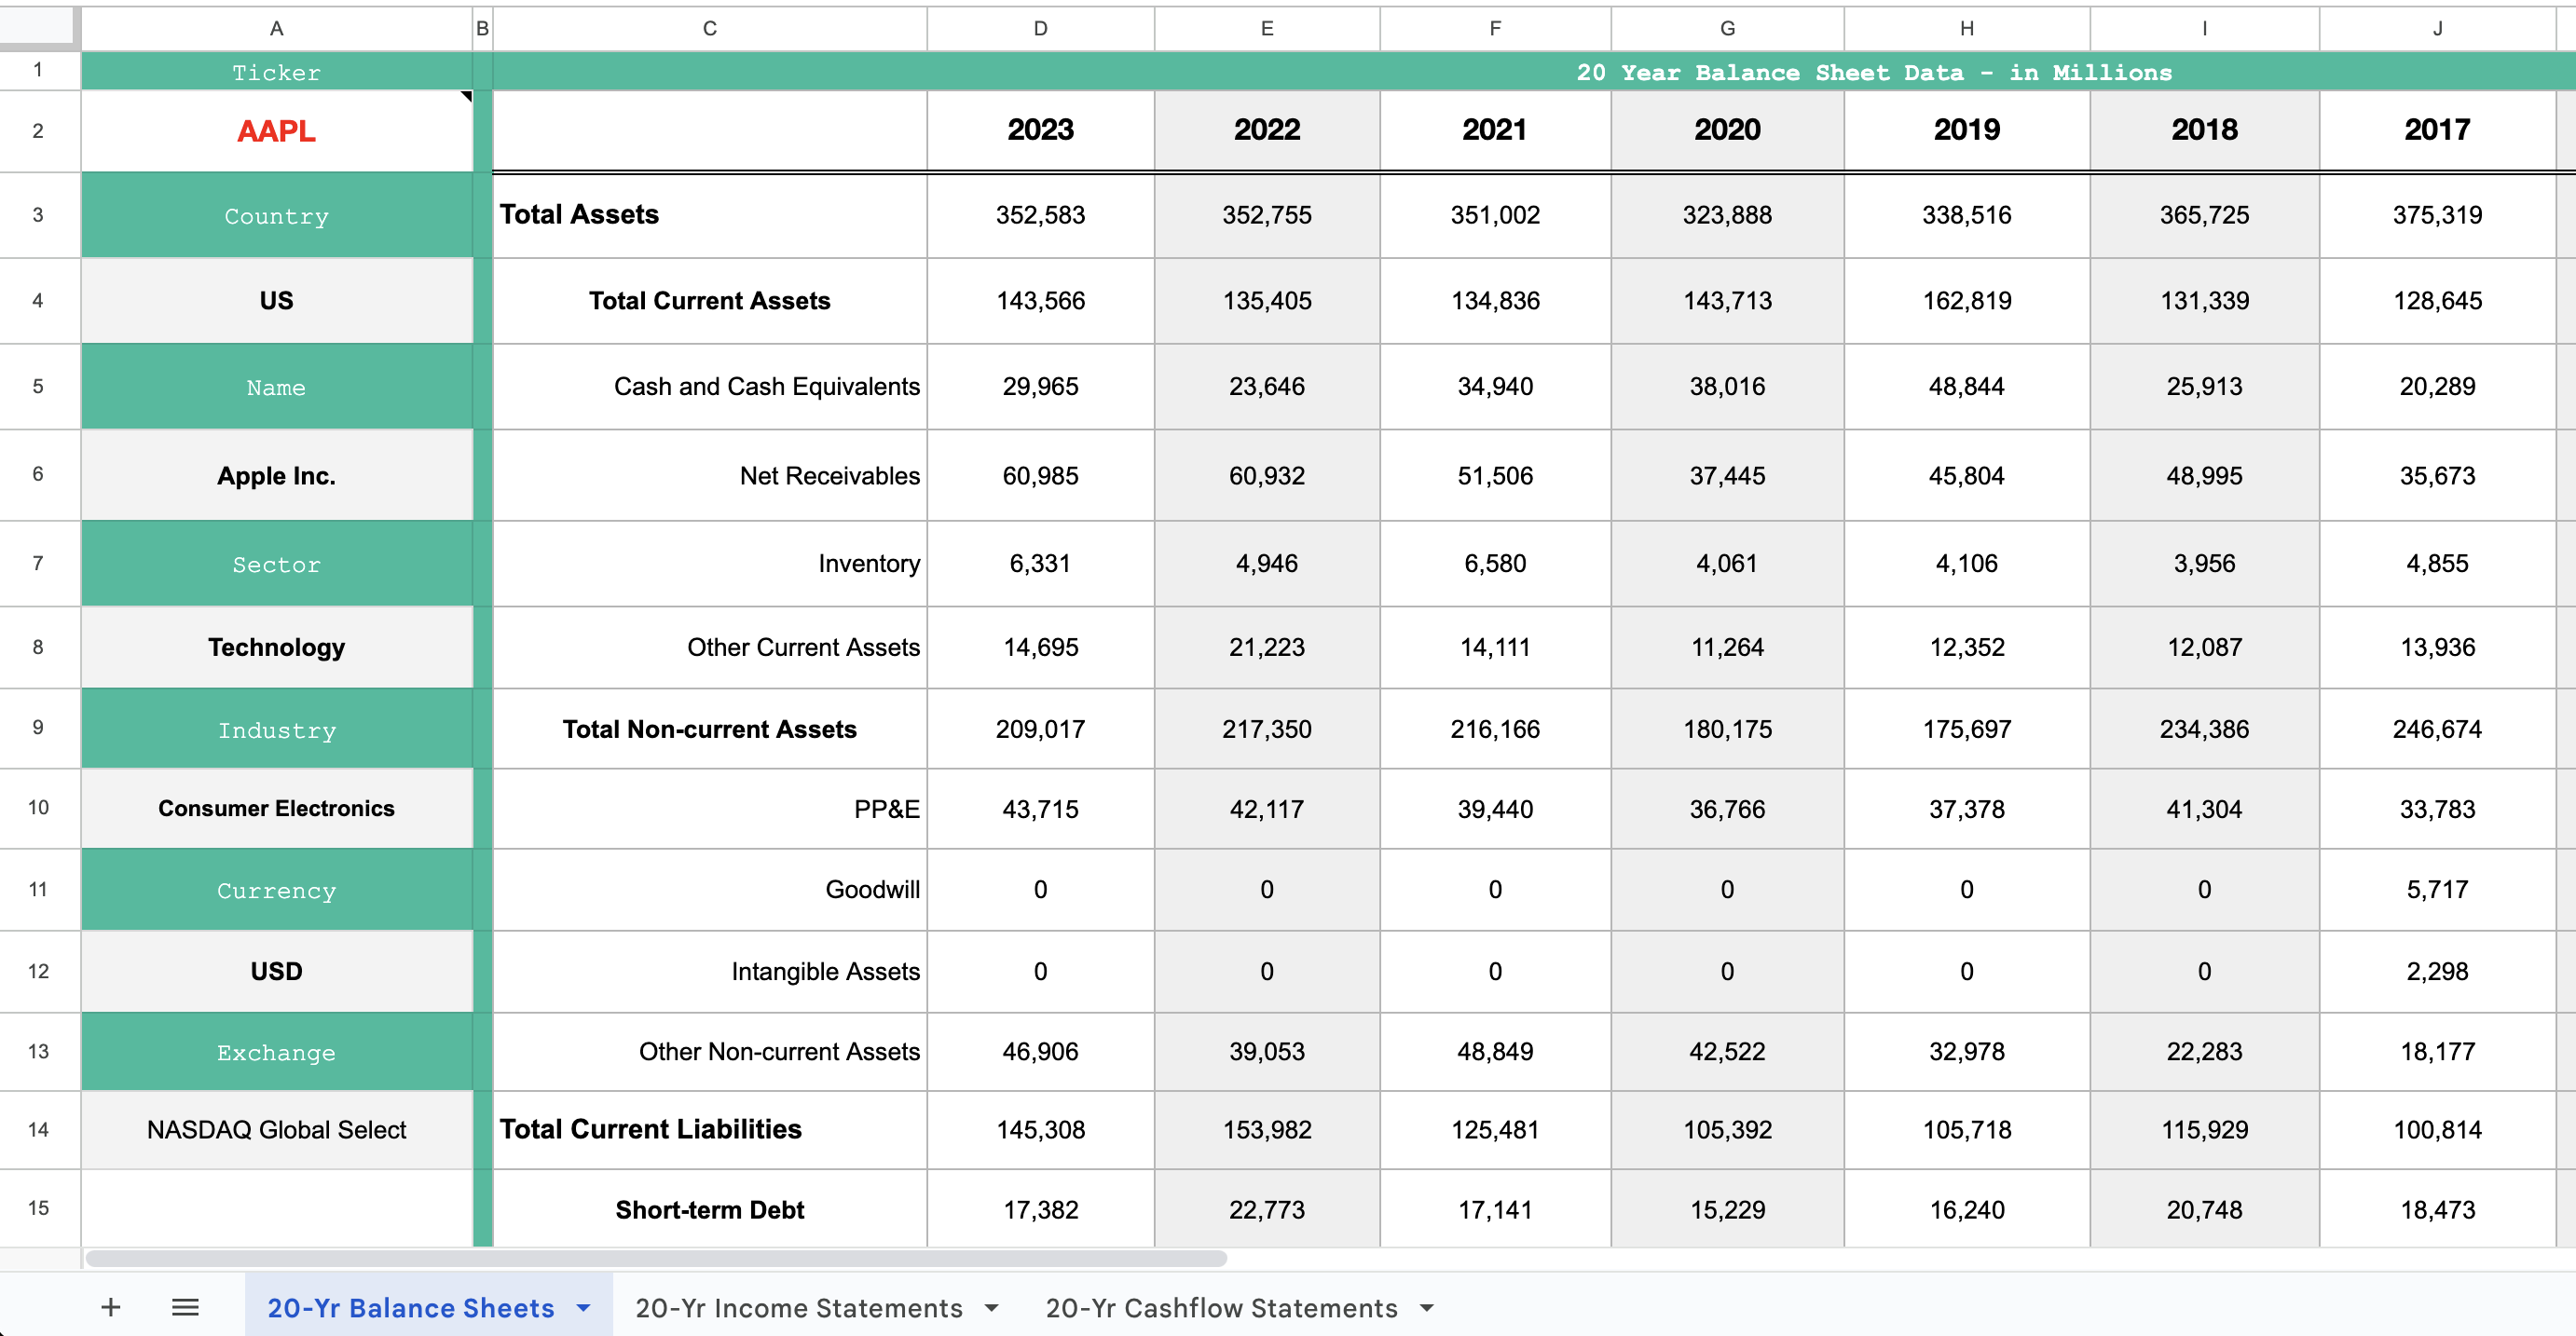
Note: You only need to change the ticker symbol in cell
A2of the Balance Sheet sheet, and the data will automatically update across all three sheets.
How it works
Using this template is as simple as changing the ticker symbol in cell A2 of the Balance Sheet sheet. The data will automatically update across all three sheets, providing you with 20 years of historical financial data for the company of your choice.
Under the hood the sheet runs only 3 SF functions, each function is in cell C3 of the respective sheet. The function chains together multiple statement metrics using the & operator and leverages a multi-year output to deliver 20 years of historical financial data in an instant. For example, the Balance Sheet function is as follows:
=SF($A$2, "balancesheet", "totalAssets&totalCurrentAssets&cashAndCashEquivalents&netReceivables&inventory&otherCurrentAssets&totalNonCurrentAssets&propertyPlantEquipmentNet&goodwill&intangibleAssets&otherNonCurrentAssets&totalCurrentLiabilities&shortTermDebt&accountPayables&taxPayables&deferredRevenue&otherCurrentLiabilities&totalNonCurrentLiabilities&longTermDebt&otherNonCurrentLiabilities&totalEquity&commonStock&retainedEarnings&othertotalStockholdersEquity", "2003-2023","NH&NLI-")Looks scary? Don't panic you can use our in-built Function Generator to search through our data and build all our functions for you.
You are now able to examine the financial health of a company by looking through the Balance Sheet, which provides a snapshot of its assets, liabilities, and equity; the Income Statement, which outlines its earnings and expenses over a specific period; and the Cashflow Statement, which is crucial when assessing its ability to generate and manage cash.
Symbol Search
If you aren’t sure what ticker to use for a certain company, either use the Symbol Search tool within Google Sheets (Extensions > Sheets Finance > Symbol Search), or visit the SF Symbol Search page.
You can also use the SF_MAP function to translate any ISIN, CUSIP or CIK code into the correct ticker used at SheetsFinance, for more information, kindly look through this documentation page.