Calculating the Daily Total Return of a Stock in Google Sheets
When it comes to investing, the total return of a stock is a key metric to understand. It tells you how much money you've made (or lost) on an investment, including both capital gains and dividends. Calculating the total return of a stock can be a complex process, but with the help of Google Sheets and the SheetsFinance add-on, it's easy to do.
Getting Started
- Make sure SheetsFinance is properly installed and linked to your Google account. If not, you can find how to do so here
- Open the pre-built template and create a copy
- Want to learn through a video tutorial? Check out our Youtube Walkthrough
Capital Gain vs Total Return
Before we dive into calculating the total return of a stock, it's important to understand the difference between capital gain and total return. Capital gain is the profit you make from selling an investment for more than you paid for it. Total return, on the other hand, includes both capital gains and dividends.
For example, let's say you bought a stock for $100 and sold it for $120. Your capital gain would be $20. But if the stock also paid a $5 dividend while you owned it, your total return would be $25. And as a percentage, your capital gain would be 20%, while your total return would be 25%.
All to often, investors focus solely on capital gains and overlook the importance of dividends. In fact, most online tools or brokers tend to show only the capital gain, which can be misleading. This is where tools like SheetsFinance come in which gives your the flexibility to build your own analysis in Google Sheets.
How to Calculate Total Return
The formula to calculate the total return of a stock is as follows:
Total Return = ((Ending Price - Beginning Price + Dividends) / Beginning Price)That's nice and straightforward.
Now we want to build a spreadsheet that will dynamically update with total return data for any stock we choose. You'll see in the provided template that the ticker cell of the stock we're analysing lives in cell B3. We additionally define a start and end date for our analysis in cells E3 and G3 respectively.
Next we need to generate both the daily price history and the dividend history between the specified start and end date. This can be done using the Time-series and Dividend functions. You'll see the time-series generated starting in cell A6 and the dividend history starting in cell F6. Here's the formula to generate the time-series:
=SF_TIMESERIES(B3,E3,G3,"daily","date&close", "-")Note: The
"-"formatting option is included to reverse the data ordering to ensure the output is in chronological order.
And here's the formula to generate the dividend history:
=SF_DIVIDEND(B3,E3,G3,"date÷nd&paymentDate", "-")With the data now in place, we can calculate the total return of the stock. We'll put this in column C starting in cell C8. The formula is as follows:
=((SUMIF($H$8:$H$11,"<"&A8,$G$8:$G$11)+B8)/$B$4)-1So what's happening here?
Well, putting it plainly, we're summing all the dividends paid out before the current date and adding this to the current price of the stock. We then divide this by the initial price of the stock and subtract 1 to get the total return as a percentage.
And that's almost it!
As a final touch we add the daily capital return in column D starting in cell D8. The formula is as follows:
=(B8/$B$4)-1Here we're simply dividing the current price of the stock by the initial price (on our set start date) and subtracting 1 to get the capital return as a percentage per day.
Now we can chart the comparison of the daily capital return and the total return over the specified time period. This will give us a visual representation of how the stock has performed over time and most importantly the impact of dividends on the total return of your investment.
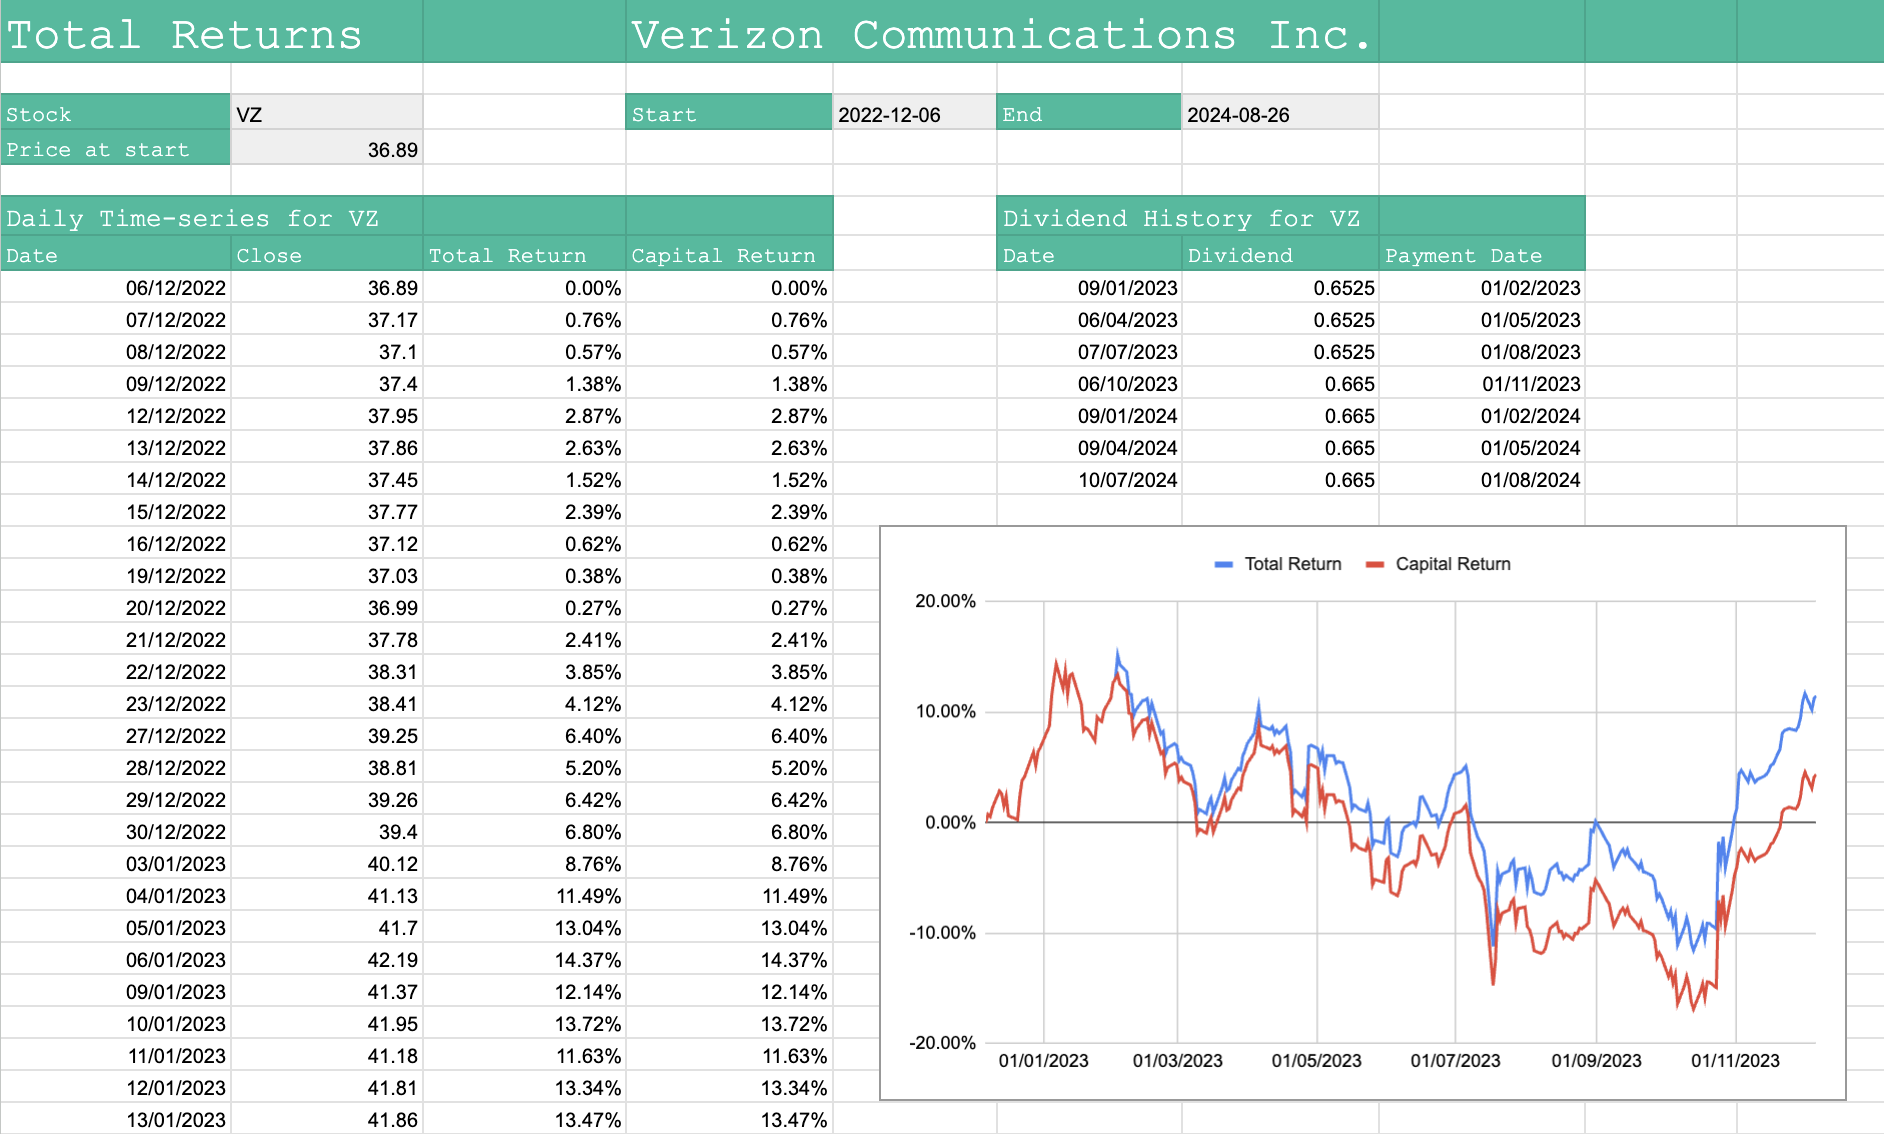
Notice how the impact of dividends on the total return is clearly visible in the chart. This is a simple, yet so frequently overlooked, metric that can have a significant impact on your investment strategy.