Understanding Quality: The Business Owner's Perspective
From a fundamental perspective, the quality of a business and the price we pay for it will ultimately determine a stock's return to us as the shareholder in the long run. But what is a quality business? "Quality" can mean different things to different people.
In this article we'll apply Warren Buffet's interpretation of quality to identify companies with durable competitive advantages. We'll also use SheetsFinance to analyze key metrics and indicators that help us find companies with consistent and predictable growth.
Getting Started
- Make sure SheetsFinance is properly installed and linked to your Google account, if not, you can find how to do so here
- Check out the free template and make your own copy
- Want to learn through a video tutorial? Check out our Youtube Channel
The Business Model
Our first step on this journey is to identify the company's business model.
Does the business in question sell either a unique product or unique service, are they the producer with the lowest associated costs, or do they provide a good or service that their customers constantly need?
As per Warren Buffet and the Interpretation of Financial Statements, written by Mary Buffet and David Clark, it is all about competing to gain a “share of mind”. Once you establish this, the number and trends are likely to follow suit.
We will group key metrics that arise from an existing durable competitive advantage into four key groups of fundamental metrics, which we'll explore in this post.
From a business owner's viewpoint, quality is about finding companies that achieve consistent and "predictable" growth. Of course, nothing in business is ever truly predictable, but we aim to get as close as possible.
Please note that all sources of information were extracted from Warren Buffet and the Interpretation of Financial Statements and that this piece is for educational purposes only and should not be construed as financial advice. All investments are made at your own risk. We assume no liability for any decision made or action taken, or not taken, based on the information provided on this platform.
Income Statement Metrics
While analyzing the Income Statement is crucial, it's equally important to question the sources of a company's profits and how they have evolved over time. A durable economic engine relies on multiple, well-balanced sources of income rather than just one.
The key factor is not the number or the metric itself, but the trend over time. Consistency and predictability in these trends are essential indicators of a company's financial health and stability.
Gross Profit Margin
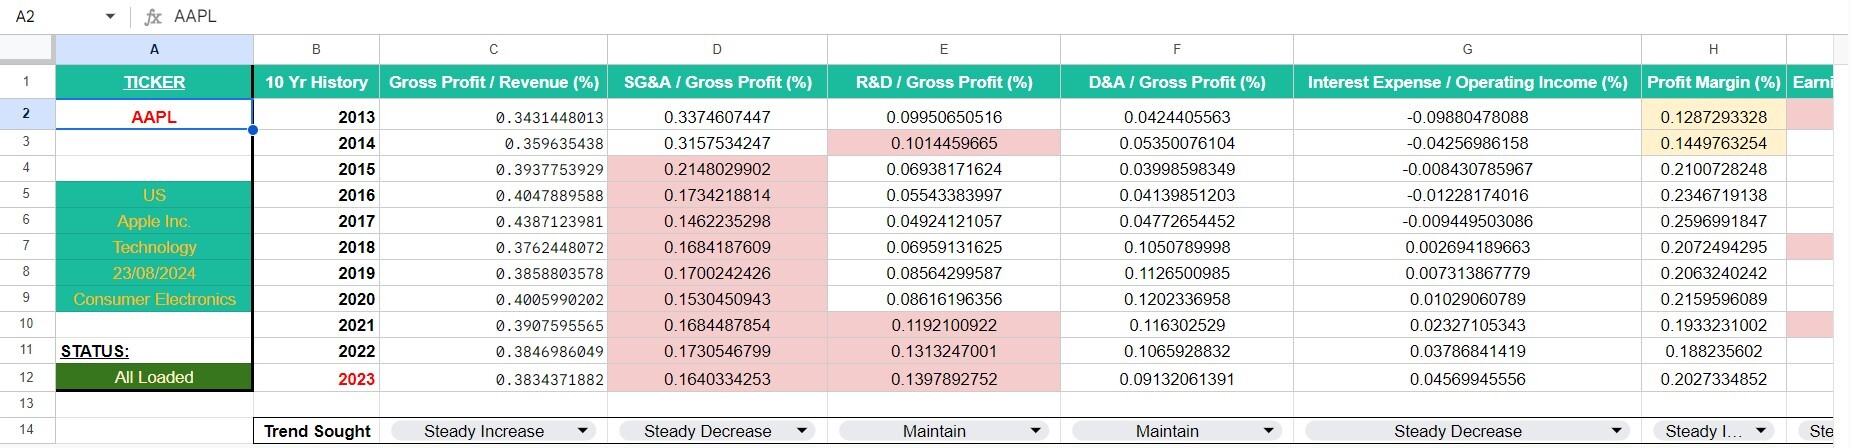
We aim to find a consistent or increasing trend in this ratio, ideally above 40% on average, and at worst, no lower than 20%. Companies with a proven, strong long-term track record typically achieve higher sales volumes while keeping their cost of revenues low. This is a crucial indicator of a company's ability to set prices for its products and services without losing market share. A lower margin often suggests that the company operates in a highly competitive industry, limiting its pricing power.
=SF("AAPL", "ratios", "grossProfitMargin", "2013-2023")Operating Expenses compared to Gross Profit
It’s essential to monitor how a company spends its gross profits. When comparing Selling, General and Administrative expenses (SG&A) to Gross Profits, companies with durable competitive advantages typically have lower and more consistent figures than their industry peers.
Comparative analysis can offer deeper insights than the metric alone. Generally, an SG&A/GP ratio between 30% and 80% is reasonable, with anything below 30% being exceptional. However, this figure should not be the sole focus, as it doesn't account for other operating expenses.
Additionally, we need to consider research and development (R&D) costs. Companies with a solid competitive edge often spend less on R&D because their products or services don't require frequent changes. For instance, Coca-Cola doesn’t need to constantly innovate its primary product. Conversely, companies in tech-heavy industries face intense competition and must continually adapt, leading to higher R&D expenses, which can reduce their bottom line. Comparative analysis here helps identify the industry leader.
=SF("AAPL", "income", "sellingGeneralAndAdministrativeExpenses&grossProfit&researchAndDevelopmentExpenses", "2013-2023")Finally, evaluating a company's long-term economics involves looking at depreciation and amortization costs relative to gross profits. These are real costs, and companies with a durable competitive advantage usually have lower depreciation and amortization expenses compared to their competitors or those in highly competitive sectors.
By comparing a company's metrics with its competitors and those in highly competitive industries, we can better understand its long-term economic viability.
Interest Expense - an important cost to look at
How much are companies spending to maintain their debt load?
This is a crucial question, especially when evaluating companies growing through acquisitions. Are they funding this growth with debt? If so, can they handle the associated interest costs?
To answer this, we must examine a company's interest expense relative to their operational income (gross profit minus operating expenses). According to Warren Buffet and the Interpretation of Financial Statements, companies with a durable competitive edge typically have low interest expenses, often not exceeding 15% of operating profits.
=SF("AAPL", "income", "interestExpense&operatingIncome", "2013-2023")This metric is particularly useful for identifying financially sound companies in competitive industries like airlines or financial services (though keep in mind that interest plays a crucial role in financial services revenue, and is likely to exceed this 15% threshold). Remember, the 15% guideline doesn't apply to all industries, so comparative analysis is essential. As always, look for consistency and steady improvement in these figures.
Profit Margin & Earnings Per Share (EPS)
Before diving into profit margins, it's crucial to watch out for non-recurring items. Since these events are rare, excluding them from your calculations is usually the best approach. This helps you assess whether a company truly has a sustainable competitive advantage. Note that a single year of entry is worthless, what matters is the trend and consistency, if there is any.
When analyzing both profit margins and earnings per share (EPS), look for a consistent upward trend. While there isn’t a specific profit margin figure to target—since this varies by industry—it’s essential to compare with competitors. For EPS, any year with a decline warrants further investigation into the cause and whether the company recovers to higher earnings the following year. If it doesn't, the company might be losing its competitive edge.
Also, be wary of "financial engineering," such as share buyback programs, which can artificially inflate EPS.
Here’s an example of something to look for in EPS, in this case Apple Inc. from 2008 to 2018:
2008: $0.2 → 2009: $0.23 → 2010: $0.55 → 2011: $1 → 2012: $1.59 → 2013: $1.43 → 2014: $1.62 → 2015: $2.32 → 2016: $2.09 → 2017: $2.32 → 2018: $3Here’s an example with a more varying and less consistent earnings profile, looking at General Electric from 2008 to 2018:
2008: $13.76 → 2009: $8.08 → 2010: $8.48 → 2011: $9.92 → 2012: $10.32 → 2013: $10.96 → 2014: $12.08 → 2015: -$4.96 → 2016: $7.2 → 2017: -$5.76 → 2018: -$20.6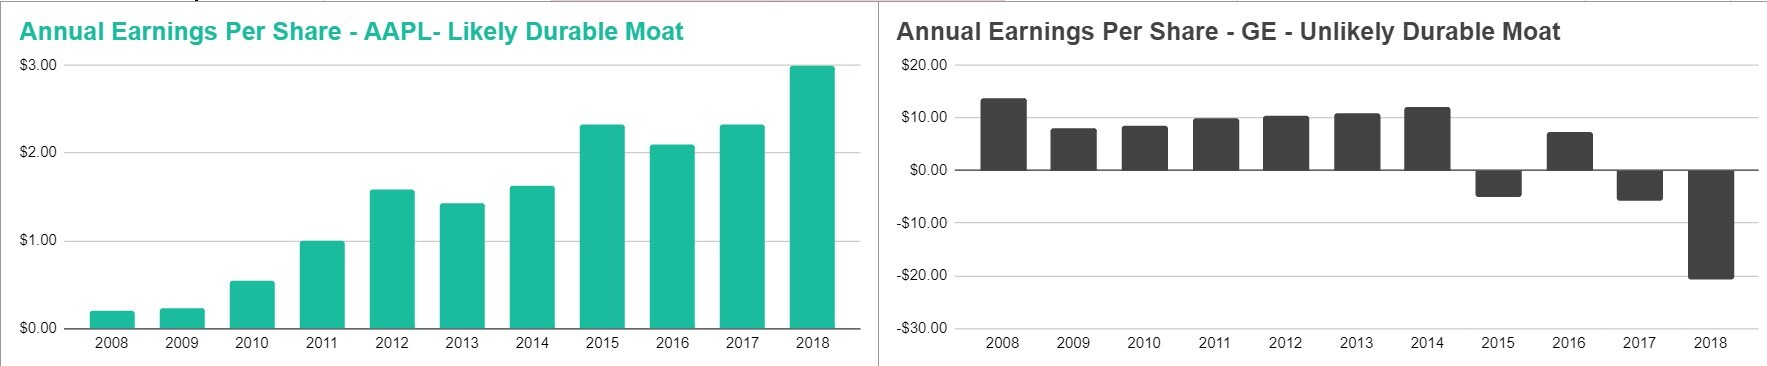
EBIT coverage of Long Term Debt
This metric should often be paired with the Interest Expense to Operating Profit metric to determine two key aspects. First, assess how many years it would take for the company to repay its long-term debt if it used its entire earnings before interest and tax (EBIT). For instance, a 25% EBIT to LTD coverage ratio indicates a payback period of 4 years, suggesting a healthy income-to-debt level.
=SF("AAPL", "income", "incomeBeforeTax", "2013-2023")/SF("AAPL", "balancesheet", "longTermDebt", "2013-2023")However, if the coverage ratio falls below 25%, meaning it would take longer than 4 years to repay the debt, it’s crucial to examine how much of the earnings are consumed by interest payments. In such cases, it might be more prudent to invest in the company’s debt rather than its equity, knowing that a significant portion of its earnings is directed towards creditors.
Return on Invested Capital
Return on Invested Capital (ROIC) is a highly sought-after metric that reveals how effectively management uses equity and debt to generate income (after dividend payments). A consistent increase in ROIC, often above 20%, typically indicates strong and stable profit generation. While this benchmark can vary by industry, Warren Buffet and the Interpretation of Financial Statements recommend steering clear of companies with a year-on-year ROIC of 10% or lower, or those displaying a cyclical pattern.
=SF("AAPL", "ratios", "roic", "2013-2023")Balance Sheet Metrics
While the Balance Sheet provides a snapshot of a company’s financial health at a specific point in time, it's important to understand its details to gauge how leveraged a company truly is—whether that’s too much or too little. Remember, a balance sheet is typically ordered by liquidity, which can help you assess the company's ability to meet its short-term obligations and overall financial stability.
Days Inventory Outstanding (DIO)
Days Inventory Outstanding (DIO) indicates the average number of days it takes for a company to cycle through its inventory. DIO reflects inventory liquidity: a short DIO means inventory is converted to cash more quickly, while a high DIO indicates poor inventory liquidity. It's important to remember that DIO should not be compared across industries, or used as a standardized metric, as it varies significantly between them. Generally, a lower DIO is more favorable than a high DIO.
Days Receivable
Days Receivables measures the average time it takes for a company to collect payment from its customers. A lower number of days often indicates a competitive advantage, as it suggests customers are more willing to pay earlier or in advance for the company’s products or services. Typically, anything above 110 days might signal a lack of competitive edge, while under 72 days can suggest the opposite. However, these figures are not absolute, and comparative analysis across similar companies is more informative.
Average Share Count (Diluted)
Historically, companies with a proven competitive moat have consistently used a portion of their earnings to buy back shares, gradually increasing the ownership stake of existing shareholders. On the other hand, companies that issue more shares end up diluting existing shareholders’ stakes. If a company consistently increases its share count and lacks any consistency year over year, it may indicate that the company is more likely to lose out in the long term to competitors. Conversely, companies that show a steady decrease in share count are more likely to possess a durable competitive edge.
Retained Earnings with Cumulative Share Buy Backs
Retained earnings are essentially the profits that a company keeps for future use, such as reinvesting in employees, products & services, and other growth opportunities. These earnings can also be distributed as dividends or used for share buyback programs. Share buybacks are particularly attractive because they are tax-advantaged ways to reward shareholders while indirectly benefiting the company. When analyzing retained earnings, we include all amounts previously spent on buyback programs. The key trend to look for is consistent growth over an extended period. A failure to achieve this may suggest a lack of reinvestment in future expansion opportunities, a diminished competitive edge, and an inability of management to allocate cash effectively.
Cash and Equivalents over Long Term Debt
This metric should also be considered with the Interest Expense to Operating Profit metric, and the EBIT to LTD metric to determine two previously mentioned aspects. First, assess how many years it would take for the company to repay its long-term debt if it used the entirety of its available cash and equivalents (e.g. treasury notes or short term bonds). For instance, a 25% Cash & eq. to LTD coverage ratio indicates a payback period of 4 years, suggesting a healthy cash-to-debt level. However, if the coverage ratio falls below 25%, meaning it would take longer than 4 years to repay the debt. It would then be crucial to examine how much of the earnings cover long term debt, and how much of the profits are consumed by interest payments. In such cases, it might be more prudent to invest in the company’s debt rather than its equity, knowing that a significant portion of its earnings is directed towards creditors, and that cash may be insufficient to cover the rest of the non-current debt, in the short term at least.
Cash Flow Statement Metrics
The Cash Flow Statement is a crucial document that reveals how a company generates and uses cash. It's important to understand the sources of a company's cash flow and how they have evolved over time.
Free Cash Flow Per Share (FCFPS)
Similar to earnings per share (EPS), with FCFPS we look for a consistent upward trend. Any year with a decline warrants further investigation into the cause and whether the company recovers to higher free cash flow the following year. If it doesn't, the company might be losing its competitive edge. However, it is harder to find consistency in this metric than compared to earnings. Also, be wary of "financial engineering," such as share buyback programs, which can artificially inflate FCFPS, just like it would for EPS.
Earnings to Free Cash Flow conversion
Assessing how much of the earnings convert to Free Cash Flow helps determine how much of the reported earnings on the income statement, which can often be affected by various items, translate into actual cash or "owner profits." Ideally, an 80% or higher conversion rate indicates that the company is a strong profit and cash flow generator, suggesting a durable competitive advantage. Conversely, a conversion rate below 40% may highlight inefficiencies and potential issues with how items are reported on the income statement, warranting further investigation. A consistent trend is key, and conducting a comparative analysis is more insightful than simply looking at these values in isolation.
Total Dividends
We first look at whether the company has a history of dividend payments, and is it consistent and upwards trending ? Any year with a decline warrants further investigation into the cause, and questioning whether the company could afford the dividend in the first place. This may create some questions about whether management’s interests are aligned with long term shareholders. This metric should be used alongside the DPR in order determine whether dividend payments are sustainable and affordable, without impacting a company’s long term future performance.
Dividend Payout Ratio
As mentioned earlier, dividends are an attractive financial reward for holding a company's stocks, but they come at a cost. One downside is that taxes take a portion of any payment. Another is that less money is retained by the company for future growth investments.
So, what should we look for? Consistency is key. We aim for a Dividend Payout Ratio (DPR) below 60% year after year. This indicates that the dividend is sustainable and the company is still retaining a substantial portion of earnings for future operational costs, growth investments, or debt repayment.
Pulling all the information together
By combing metrics and ratios derived from the Income Statement, Balance Sheet, and Cash Flow Statement we can create an analysis like the one seen in the attached template. With a minimum of 10 years of history we can build a comprehensive picture of a company's financial health and stability and determine whether it has a durable competitive advantage when compared to its peers.