Unlock 30+ Years of Intra-day and Daily Historical Stock Data in Google Sheets 📈
Whether you're a day trader analyzing minute-by-minute price movements or a long-term investor tracking decades of market performance, having access to comprehensive historical and real-time stock data is crucial for making informed investment decisions. With SheetsFinance's powerful SF_TIMESERIES() function, you can instantly pull 30+ years of daily data or dive deep into intraday movements—all directly into your Google Sheets.
What We'll Cover
In this comprehensive guide, you'll learn how to:
- Pull 30+ years of historical daily stock data with a single formula
- Access real-time intraday data from 1-minute to 4-hour intervals
- Customize your data output to show only the metrics you need
- Build multi-timeframe trading dashboards for comprehensive analysis
- Use advanced formatting options for better data presentation
- Integrate time series data with Google Sheets' charting tools
- Apply pro tips and best practices for maximum efficiency
- Troubleshoot common issues and optimize your workflows
By the end of this post, you'll have the skills to transform Google Sheets into a powerful financial analysis platform that rivals expensive trading software.
Prerequisites & Getting Started
Before we dive into the exciting world of time series data, let's make sure you're set up for success:
What You'll Need
- SheetsFinance Add-on: Make sure SheetsFinance is properly installed and linked to your Google account. If you haven't installed it yet, follow our step-by-step installation guide.
- Basic Google Sheets Knowledge: Familiarity with entering formulas and basic spreadsheet navigation will help you get the most out of this tutorial.
- Stock Symbols: Know the ticker symbols for the stocks you want to analyze (we'll show you how to find these if you're unsure).
Quick Setup Check
Let's verify everything is working with a simple test. In any empty cell, try entering:
=SF("AAPL")Essential Resources
Keep these handy as we work through the examples:
- SF_TIMESERIES Documentation - Complete function reference
- Function Generator - Automatic formula builder
- Symbol Search - Find ticker symbols easily
Okay let's get started generating some data!
Building Your First Stock Chart in Seconds
Let's start with something simple but powerful—getting the last 3 years of daily price data for Apple Inc. (AAPL):
=SF_TIMESERIES("AAPL")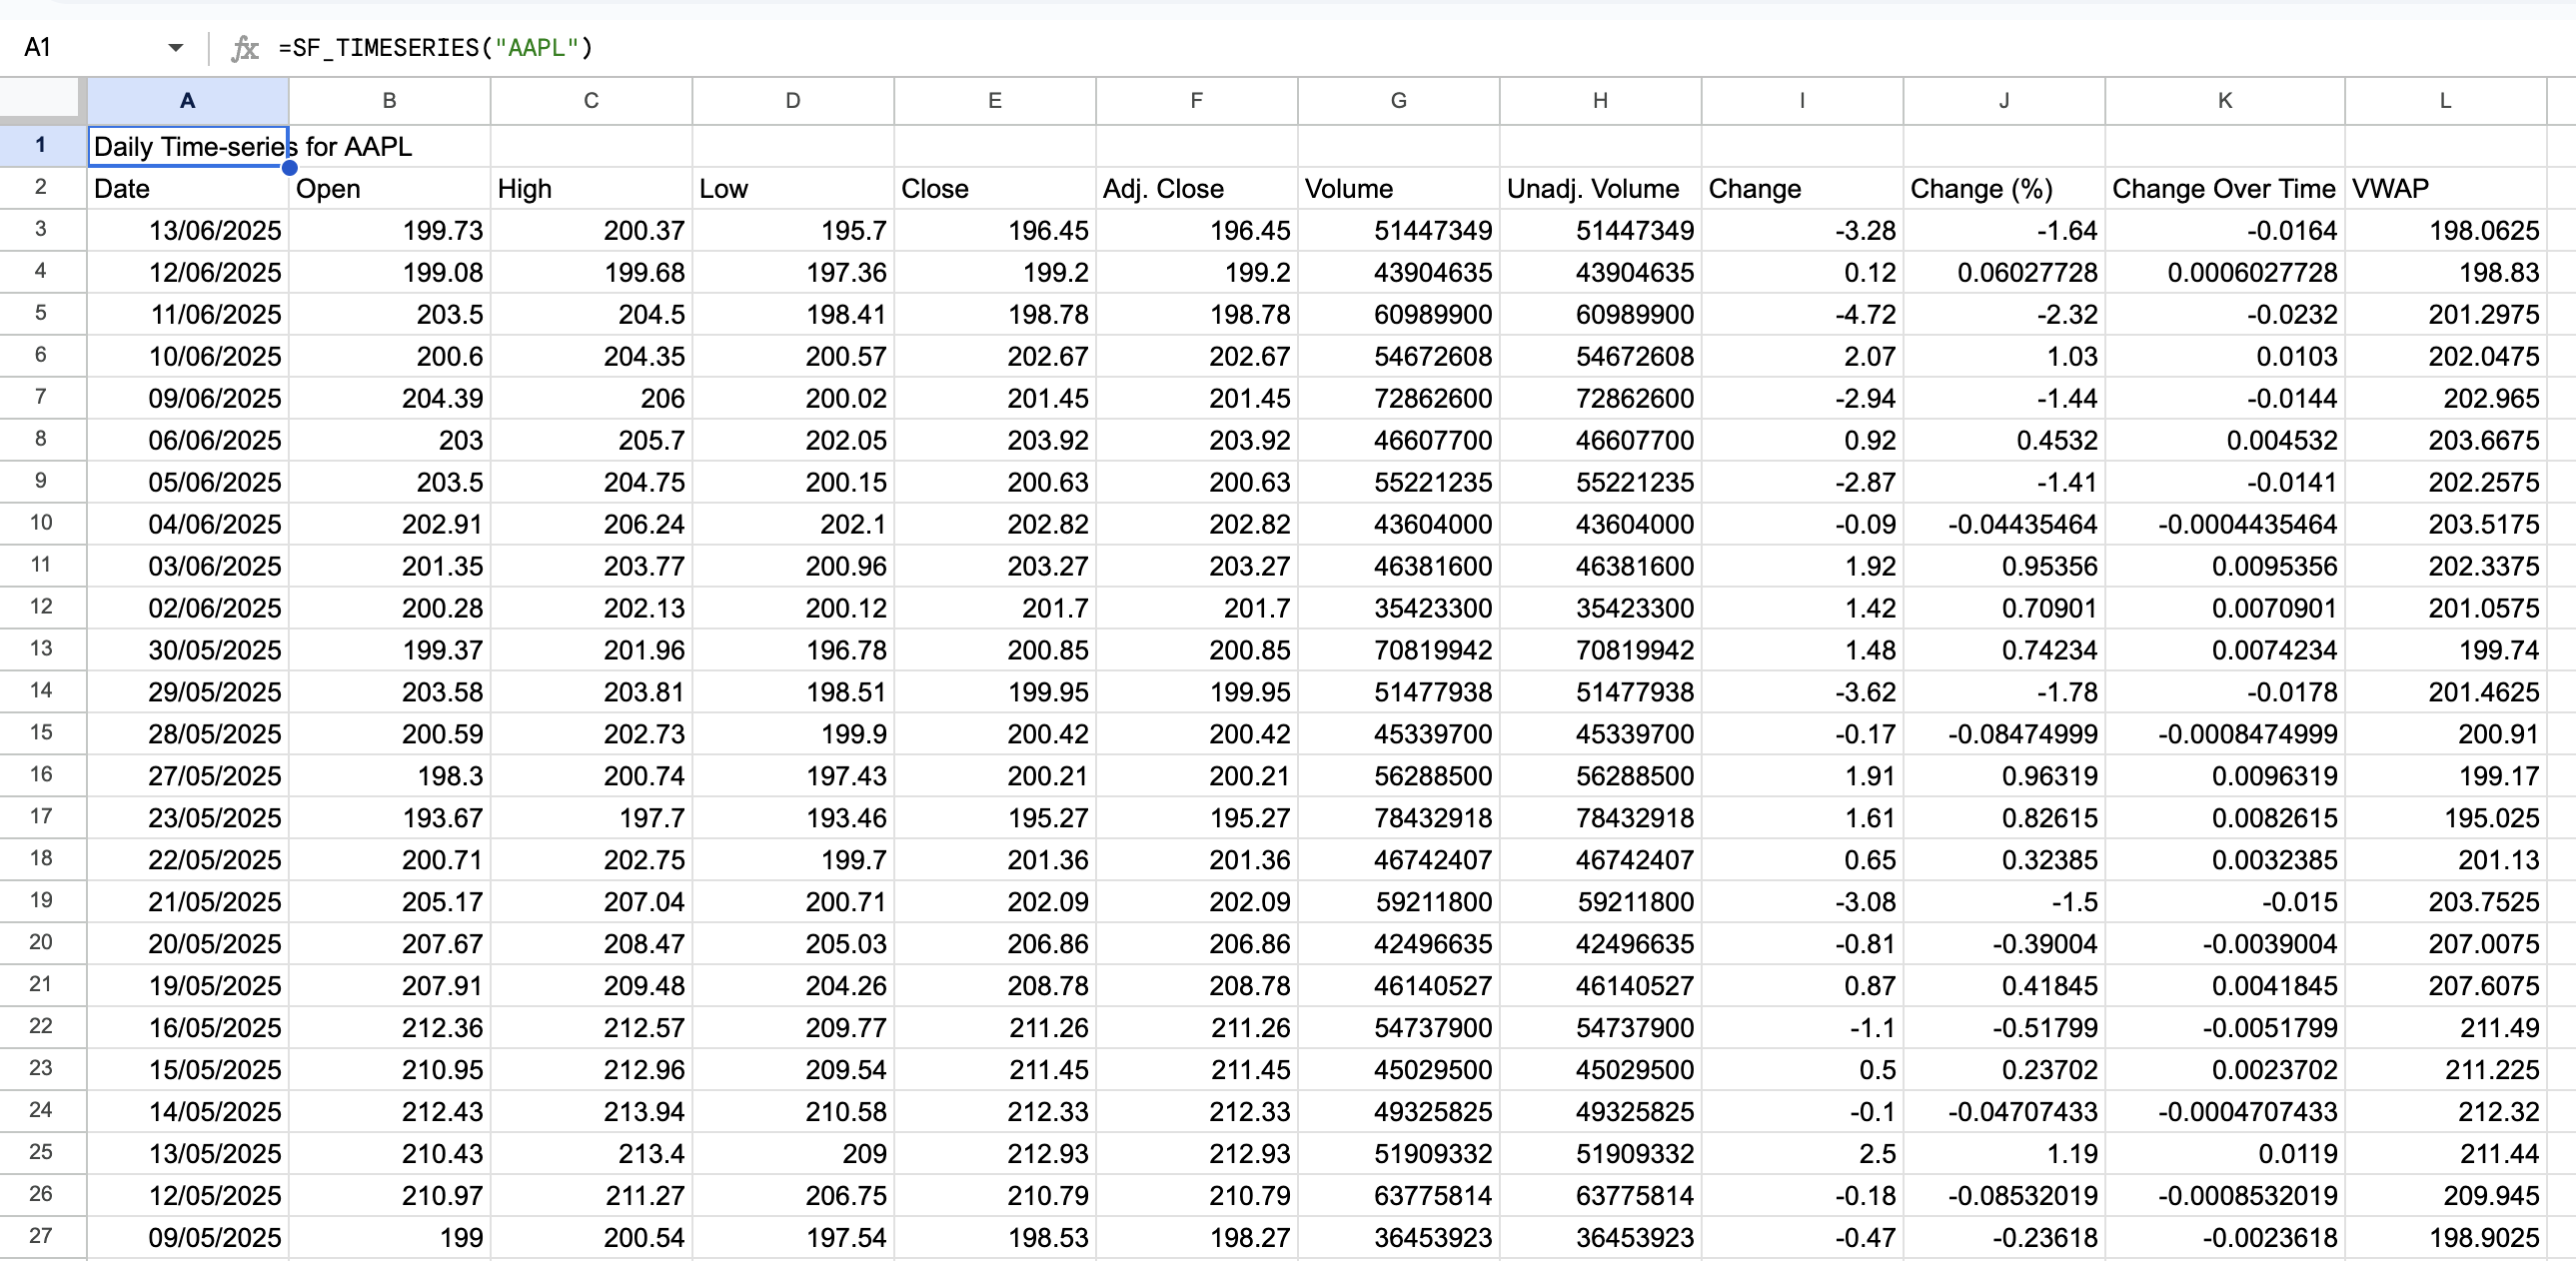
Incredible! In just one formula, we've pulled 3 year's worth of daily OHLCV (Open, High, Low, Close, Volume) data for Apple. What's going on here is that when you omitt any additional arguments the SF_TIMESERIES() function will automatically use the last 3 years as the default date range. You'll see that the function returns:
- Date - Each trading day's date
- Open - Opening price for the day
- High - Highest price reached during the day
- Low - Lowest price reached during the day
- Close - Closing price for the day
- Adj. Close - Split-adjusted closing price
- Volume - Number of shares traded
- Unadjusted Volume - Raw volume data without adjustments
- Change - Daily price change (Close - Open)
- Change % - Daily percentage change formatted
- Change Over Time - Daily percentage change unformatted
- VWAP - Volume Weighted Average Price
Customizing Your Time Series Data - Selecting Dates and Metrics
Now that we've got our first chart, let's customize it to fit our needs. The SF_TIMESERIES() function allows you to specify a date range, intraday intervals, and the metrics you want to retrieve.
Specifying Date Ranges
You can easily adjust the date range by providing a start and end date. For example, to get data from January 1, 2023, to January 1, 2024, you would use:
=SF_TIMESERIES("AAPL", "2023-01-01", "2024-01-01")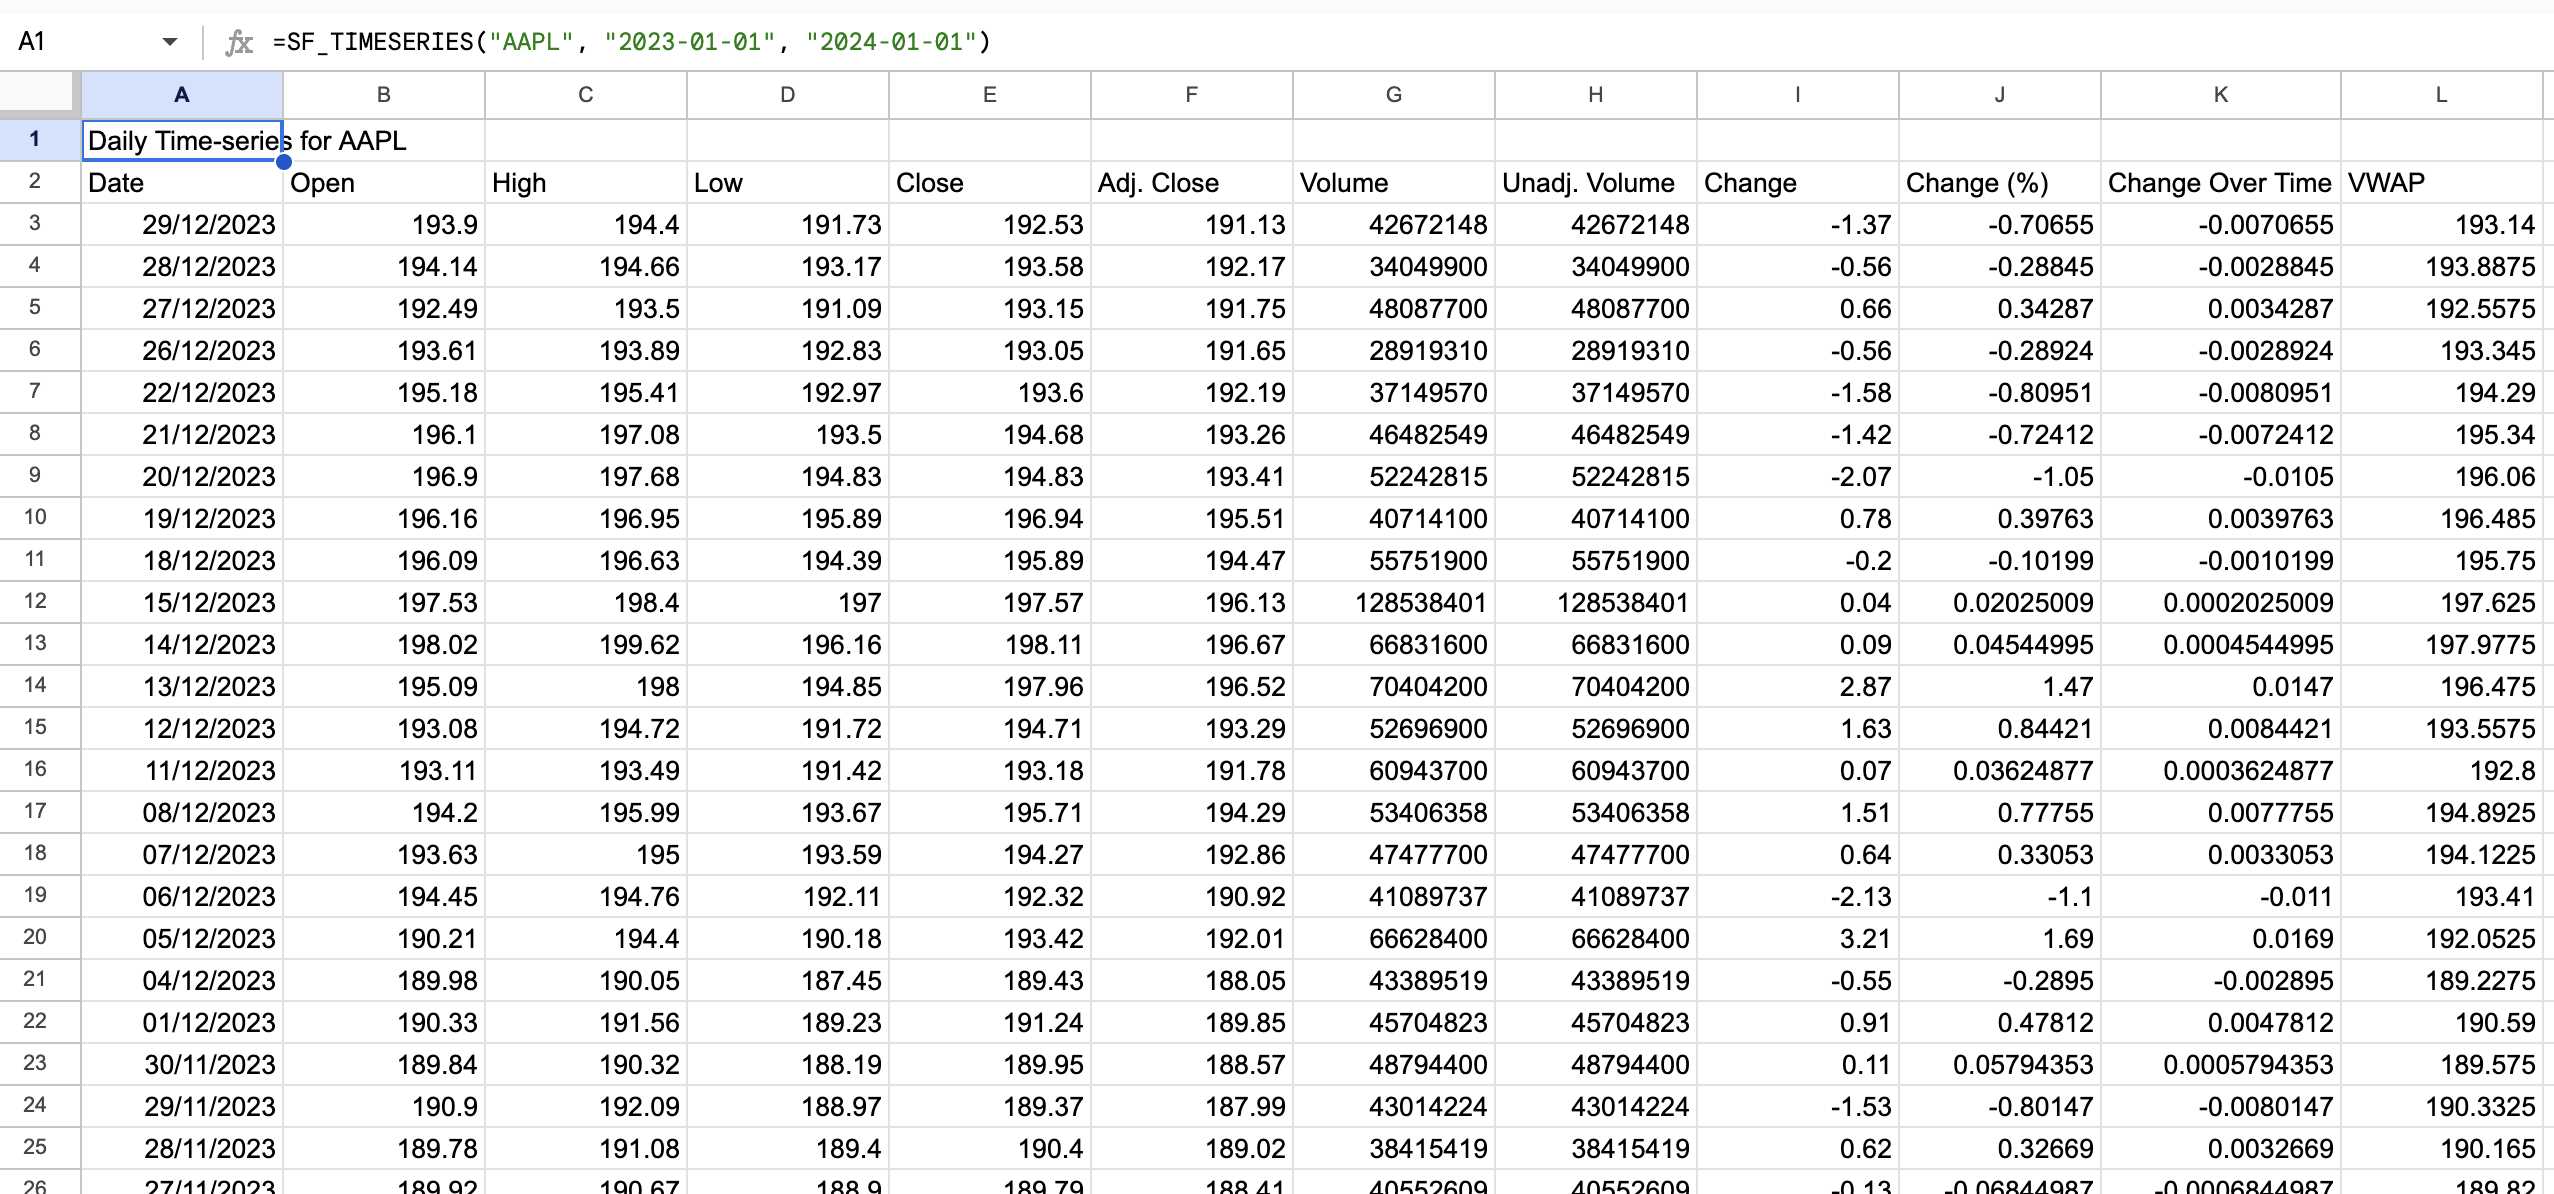 This gives you a focused view of Apple's performance over that specific year, allowing for more targeted analysis.
Filtering Metrics for Cleaner Analysis
Often, you don't need all the available metrics. Let's say you only want to track the date, closing prices, and volume for a cleaner analysis:
=SF_TIMESERIES("AAPL", "2023-01-01", "2024-01-01", "", "date&close&volume")⛓️ Let's talk chaining! The
&symbol is used to chain multiple metrics together. This allows you to specify exactly which data points you want to retrieve, making your analysis more efficient and focused. The order of the metrics matters, giving you full control over the output.
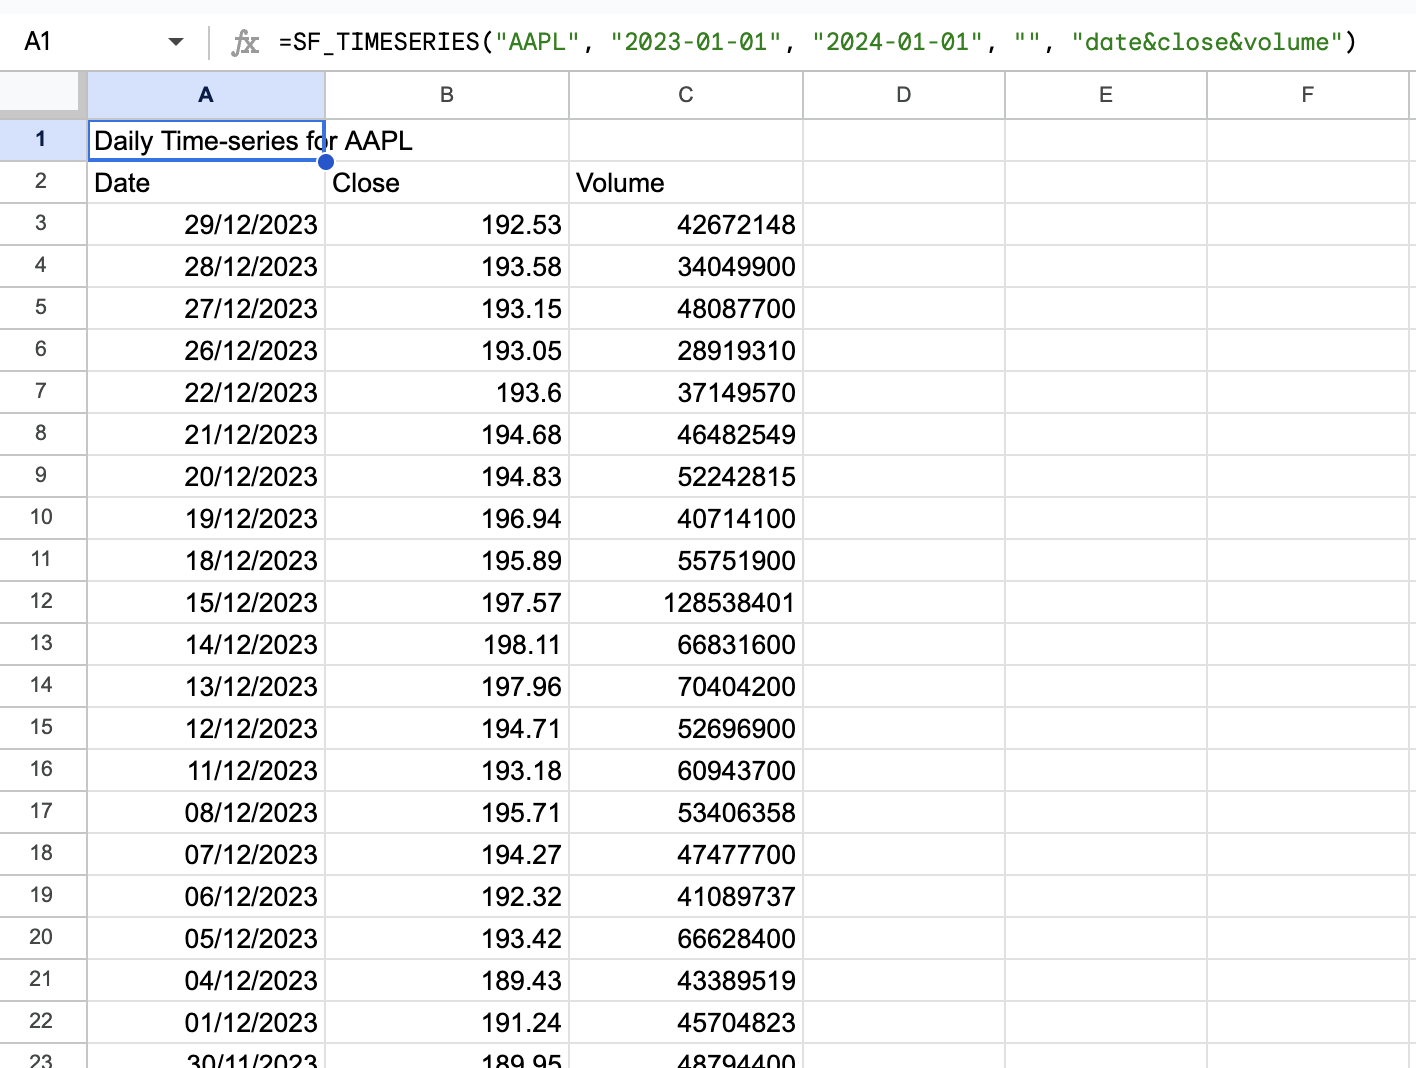
Perfect! By specifying "date&close&volume" in the metrics parameter, we've streamlined our data to focus on just what we need. This makes it much easier to create charts and perform analysis without information overload.
Diving Deep: Intra-day Analysis for Active Traders
Here's where SheetsFinance really shines. Want to see how a stock performed throughout a single trading day? Let's explore all the intra-day periods available with the SF_TIMESERIES() function. For example, to get 1-minute intraday data for Apple over the last 3 days, you can use:
=SF_TIMESERIES("AAPL", TODAY()-3, TODAY(), "1min", "date&open&close&volume")⚠️ Caution: If you're using the
TODAY()function, be sure to call it only once in your spreadsheet. So generate today's date in a separate cell (e.g.,A1) and reference that cell in your formulas. This will improve performance and avoid unnecessary recalculations.
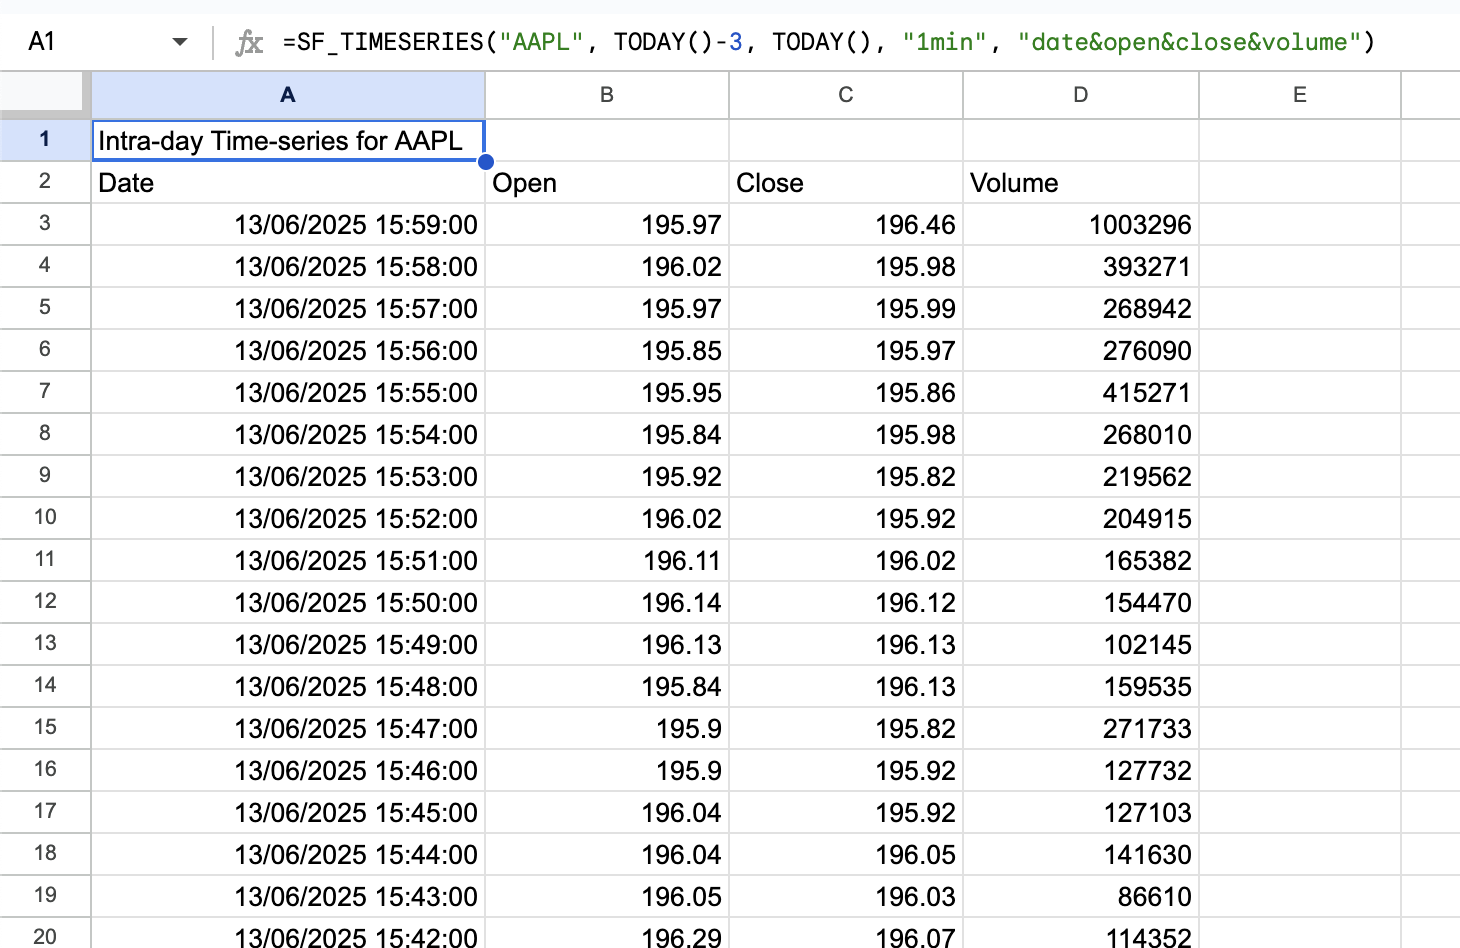
This is a game-changer for day traders! You can now track every minute of price action, identify key support and resistance levels, and spot intraday patterns that might indicate profitable trading opportunities.
The available intra-day periods include:
- 1 minute (
"1min") - 5 minutes (
"5min") - 15 minutes (
"15min") - 30 minutes (
"30min") - 1 hour (
"1hour") - 4 hours (
"4hour")
Advanced Analysis: Inter-day and Long-term Trends for Investors
For long-term investors, daily data is often too granular. Instead, you might want to analyze weekly or monthly trends to identify broader market movements.
For example, to get weekly data for Apple from January 1, 2020, to January 1, 2024, you can use:
=SF_TIMESERIES("AAPL", "2020-01-01", "2024-01-01", "1week", "date&close&volume")This view gives you a clean perspective on Apple's performance over four years, making it easier to spot major trends, seasonal patterns, and significant market events.
The available longer-term periods include:
- 1 week (
"1week") - 1 month (
"1month") - 1 year (
"1year")
Formatting Options for Better Analysis & Charting
When working with time series data, presentation matters. SheetsFinance allows you to format your output for better readability and integration with other functions.
The best example of this is using the reverse ordering option "-" to output data in chronological order (oldest dates first) for charting.
=SF_TIMESERIES("AAPL", "2024-01-01", "2024-02-01", "", "date&close&volume", "-")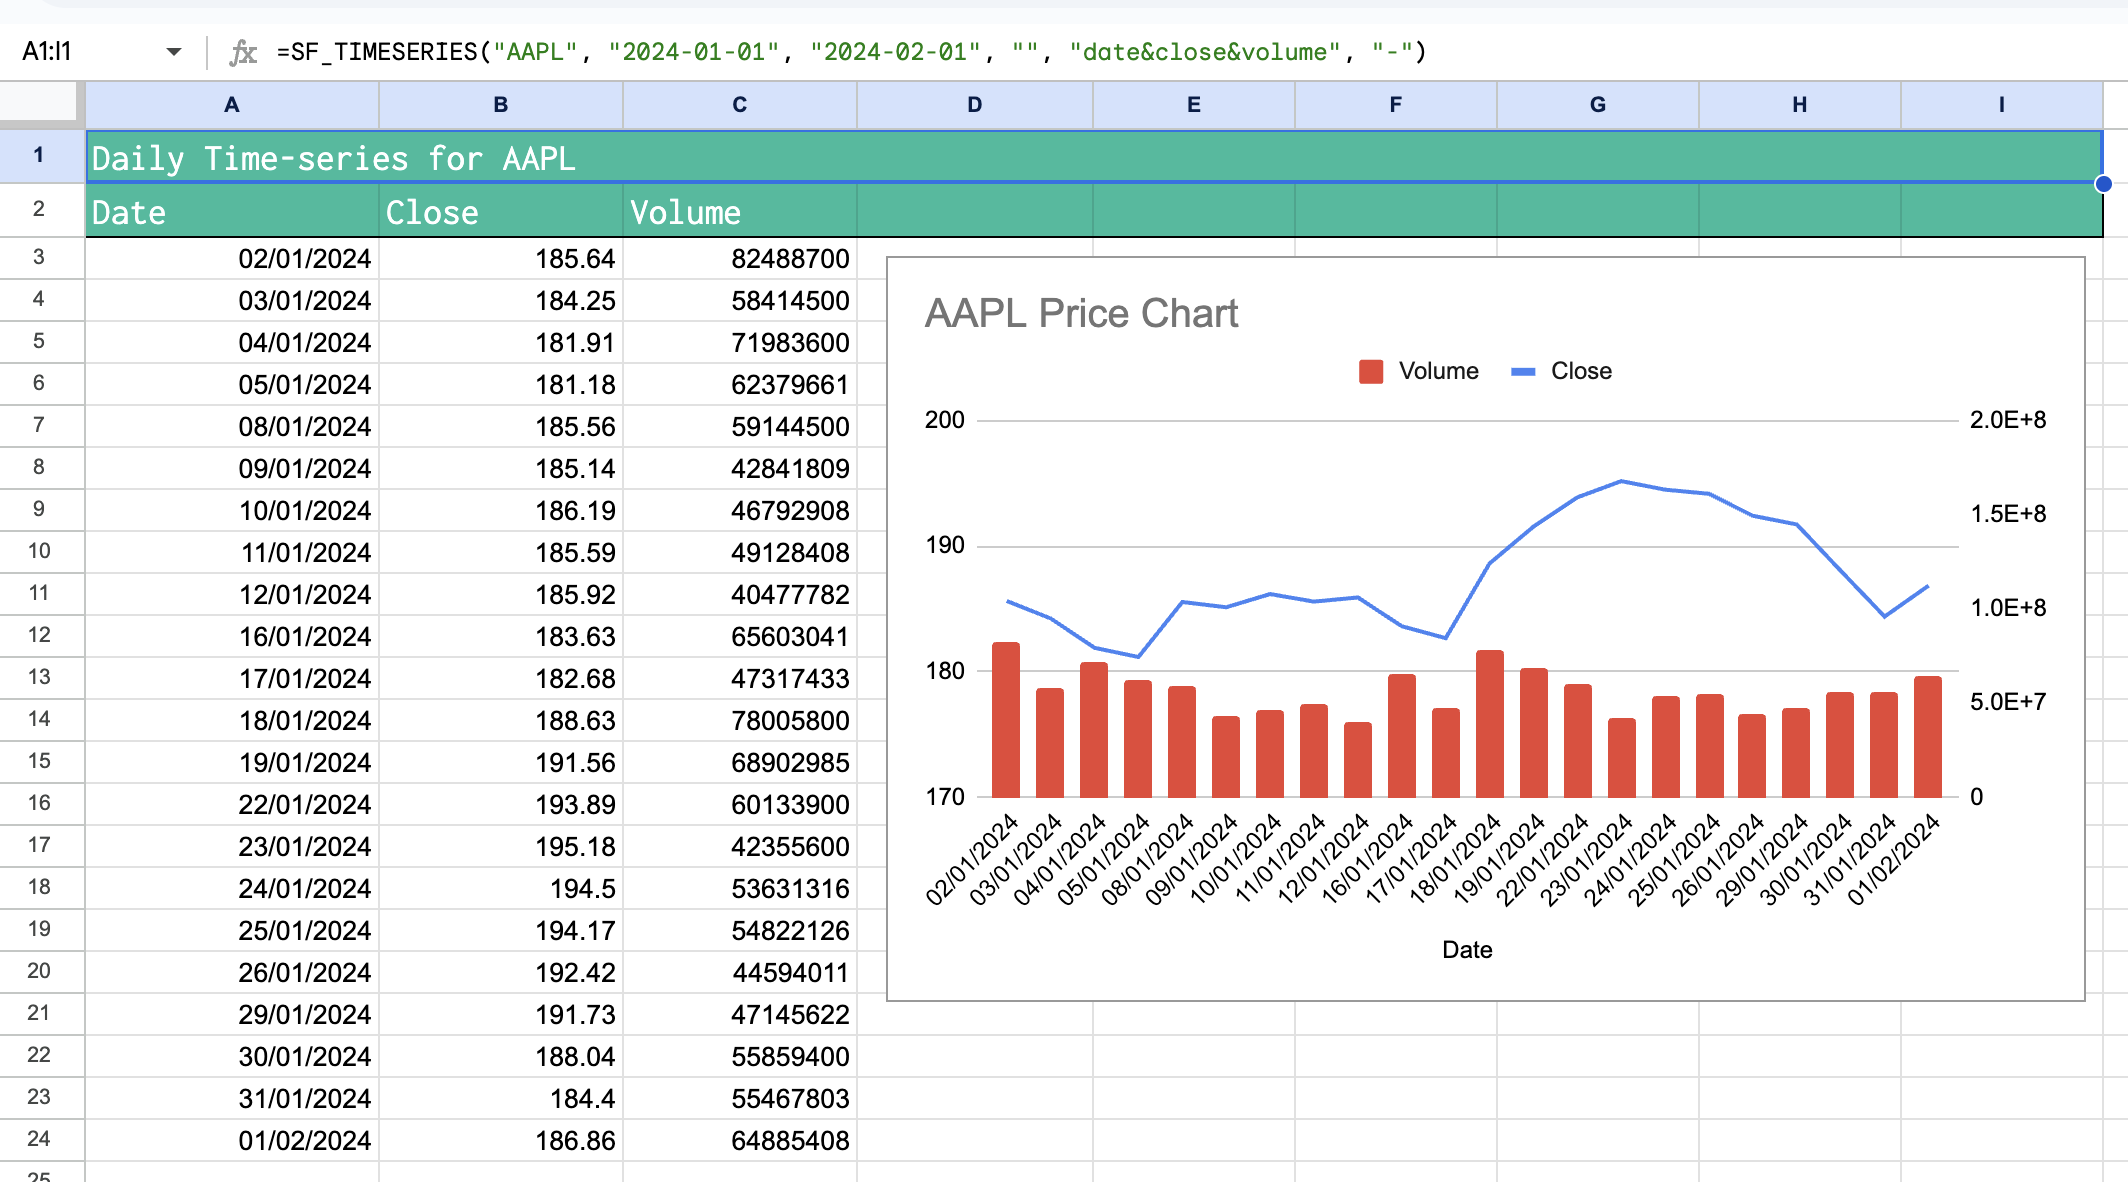
There are often a number of formatting options available for a function and we can use chaining again to select multiple options. The "-&NH" option formats the output as follows:
-- Chronological order (oldest dates first)NH- No header row
This is particularly useful when you're feeding data into other functions or creating custom dashboards.
Real-world Application: Building a Trading Dashboard
Let's put it all together and create a comprehensive trading dashboard. Here's how you might set up different views for the same stock.
Let's say our stock symbol is in cell A1 (e.g., "AAPL") and we run TODAY() in cell B1 to get today's date. You can then create multiple sections in your Google Sheet for different timeframes:
Long-term Overview (5 years, monthly):
=SF_TIMESERIES(A1, $B$1-1825, $B$1, "1month", "date&close&volume")Medium-term Analysis (6 months, daily):
=SF_TIMESERIES(A1, $B$1-180, $B$1, "", "date&open&high&low&close&volume")Short-term Trading (2 weeks, hourly):
=SF_TIMESERIES(A1, $B$1-14, $B$1, "1hour", "date&close&volume")Function Generator: Your New Best Friend
Don't want to memorize all the parameters? SheetsFinance includes a handy Function Generator that builds your formulas automatically. Access it through Extensions > SheetsFinance > Function Generator in Google Sheets.
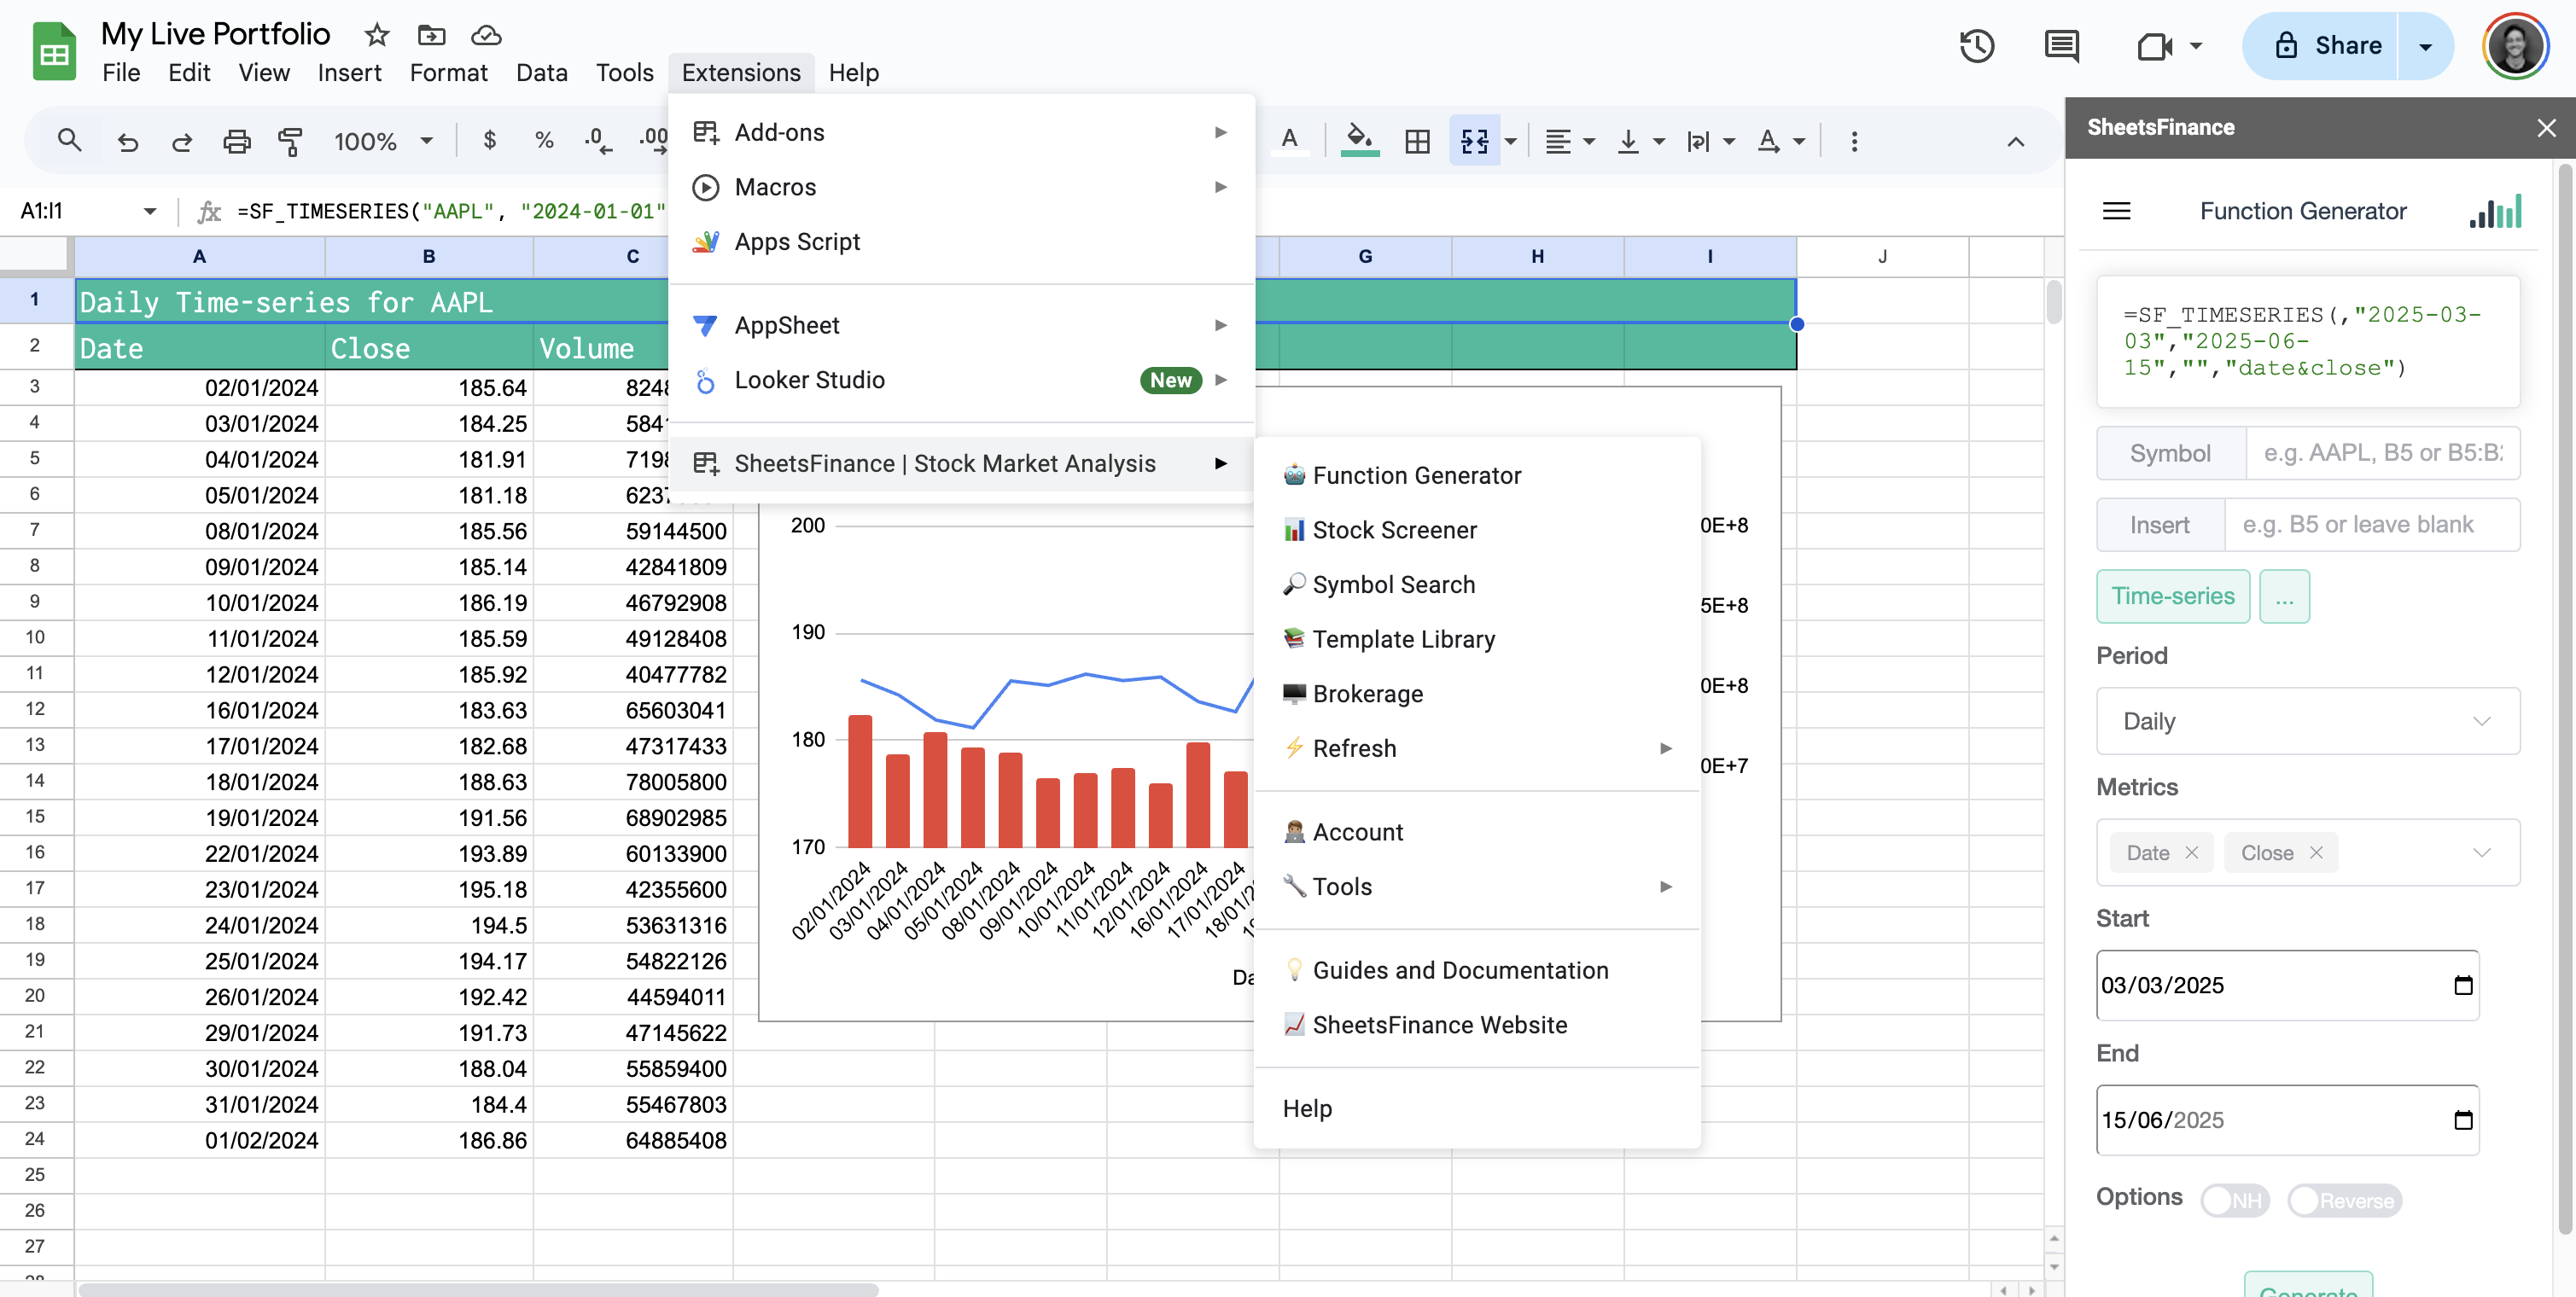
Simply select Time-series from the function type, input your desired parameters, and the generator creates the perfect formula for you. It's especially helpful when you're exploring different combinations of metrics and time periods.
Pro Tips for Maximum Efficiency
1. Dynamic Date References
Use Google Sheets' built-in date functions for automatic updates. Be sure to reference cells for dates instead of hard-coding them. For example, if you have today's date in cell B1, you can use:
=SF_TIMESERIES("AAPL", $B$1-30, $B$1)2. Multiple Symbols Analysis
Reference cell ranges instead of hard-coding tickers:
=SF_TIMESERIES(A1, $B$1, $C$1, "", "date&close")A1 and automatically get new data.3. Error Handling
The function won't display if there's data in cells it wants to occupy. You'll see a #REF! error saying "Array result was not expanded because it would overwrite data in XX". Simply clear the target area first.
4. Chart Integration
The data returned by SF_TIMESERIES integrates perfectly with Google Sheets' charting tools. Select your data range and insert a chart to visualize trends instantly. Be sure to format your time-series to output chronologically (oldest first) for better charting results (use the "-" option).
Symbol Search Made Easy
Not sure about a company's ticker symbol? Use SheetsFinance's Symbol Search tool:
- In Google Sheets: Extensions > SheetsFinance > Symbol Search
- Online: Visit the SF Symbol Search page
You can also use the SF_MAP function to convert ISIN, CUSIP, or CIK codes to the correct ticker format. Check the mapping documentation for details.
Conclusion
The SF_TIMESERIES function transforms Google Sheets into a powerful financial analysis platform. Whether you need 30 years of historical context or minute-by-minute trading data, you can access it all with a single formula. From building sophisticated trading dashboards to conducting long-term investment research, this function provides the foundation for data-driven investment decisions.
The flexibility to customize metrics, adjust time periods, and format output makes it suitable for everyone from casual investors tracking their portfolio to professional traders executing complex strategies. Best of all, it's all happening in the familiar Google Sheets environment you already know.
Ready to revolutionize your investment analysis? Install SheetsFinance today and start exploring decades of market data with the power of SF_TIMESERIES.
For detailed documentation and examples, visit the SF_TIMESERIES documentation page. Have questions? Reach out to us on Discord or through our contact page.
Happy analyzing!