How to Access 30+ Years of Historical Stock Data in Google Sheets: From Single Stocks to Massive Portfolios 📊
Picture this: You need yesterday's closing prices for your entire portfolio of 50 stocks. Or maybe you're backtesting a strategy and need specific price points from exactly 5 years ago for hundreds of symbols. Without the right tools, you're looking at hours of manual data entry or complex API integrations.
With SheetsFinance's historical function, you can pull precise End of Day (EOD) data for any trading day in the last 30+ years, whether it's for a single stock or thousands of symbols at once. In this article we'll explore how this powerful feature can transform your investment analysis workflow.
What We'll Cover
In this comprehensive guide, you'll learn how to:
- Pull historical EOD data for any stock from the last 30+ years
- Extract specific metrics like open, high, low, close, and volume
- Batch process dozens or even hundreds of symbols simultaneously
- Build portfolio tracking systems with historical snapshots
- Explore use cases like backtesting frameworks for investment strategies
- Handle market-closed days like weekends and holidays
- Optimize your formulas for maximum efficiency
By the end of this post, you'll be able to instantly retrieve historical market data that would otherwise take hours to compile manually.
Prerequisites & Getting Started
Before diving into historical data analysis, let's ensure you're set up for success:
What You'll Need
- SheetsFinance Add-on: Make sure SheetsFinance is properly installed and linked to your Google Sheets account. If you haven't installed it yet, follow our step-by-step installation guide.
- Basic Google Sheets Knowledge: Familiarity with entering formulas and basic spreadsheet navigation will help you get the most out of this tutorial.
- Stock Symbols: Have your ticker symbols ready. We'll show you how to find them if needed.
Quick Setup Check
Let's verify everything is working with a simple test. In any empty cell, try entering:
=SF("AAPL")Essential Resources
Keep these handy as we work through the examples:
- SheetsFinance Documentation - Complete function reference
- Function Generator - Automatic formula generation tool
- Symbol Search - Find ticker symbols easily
Okay let's start pulling historical data!
Your First Historical Data Pull
Let's start with something straightforward, getting Apple's opening price from a specific date:
=SF("AAPL", "historical", "open", "2021-07-28")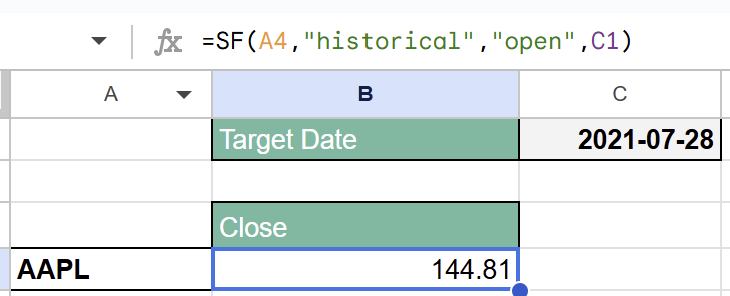
Just like that, you've retrieved the exact opening price from over 3 years ago! The function returns $144.81, which was Apple's opening price on July 28, 2021.
But why stop at just the opening price? Let's expand our view to get the complete picture of that trading day.
Pulling Multiple Metrics for Complete Market Analysis
Often, you need more than just one data point. Here's how to get the full OHLC (Open, High, Low, Close) data for the same date:
=SF("AAPL", "historical", "open&high&low&close", "2021-07-28")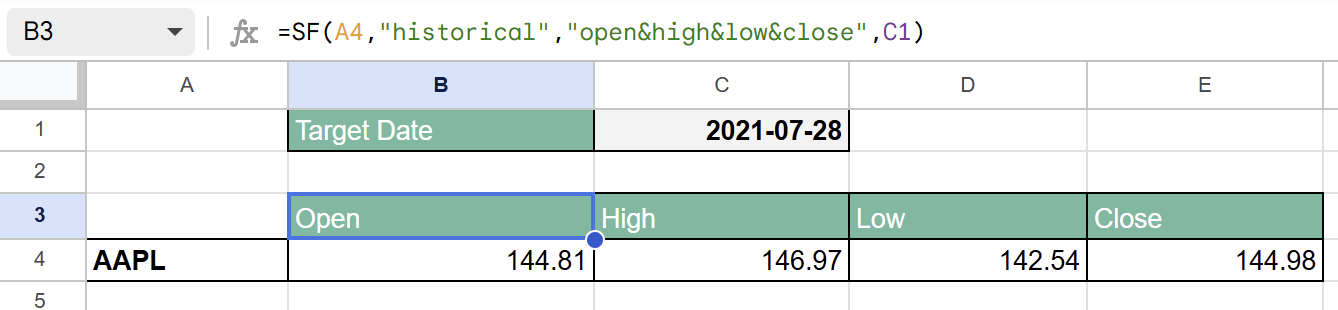
Notice how we use the & operator to chain multiple metrics together. This gives us a complete view of the trading day:
- Open: How the stock started the day
- High: The peak price reached
- Low: The lowest point during trading
- Close: Where it ended
⛓️ Chaining Metrics: The
&symbol lets you combine any available metrics in your preferred order. This flexibility means you can customize your output exactly how you need it for your analysis.
Available Metrics
You can access these historical metrics:
"open"- Opening price"high"- Daily high"low"- Daily low"close"- Closing price"adjClose"- Adjusted closing price (accounts for splits and dividends)"volume"- Trading volume
Want to see all available metrics at once? Simply use:
=SF("AAPL", "historical", "all", "2021-07-28")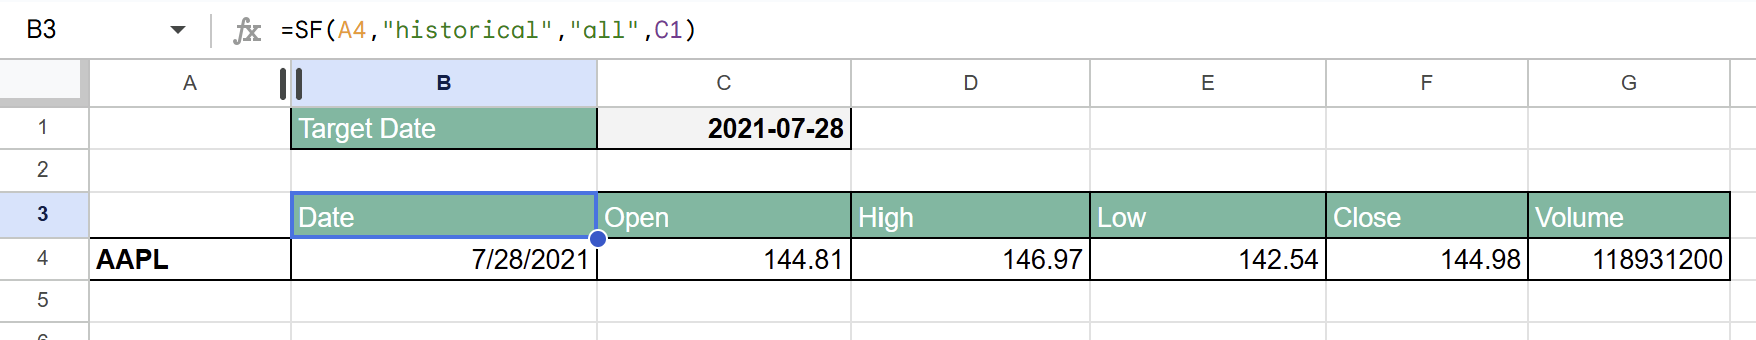
The Power of Batch Processing: Analyzing Multiple Stocks Simultaneously
Here's where SheetsFinance truly shines. Instead of pulling data one stock at a time, you can retrieve historical data for dozens, hundreds, or even thousands of symbols with a single formula.
Let's say you have a list of stocks in cells A2:A7 (AAPL, MSFT, NVDA, GOOG, NKE, V) and you simply want their closing prices from a specific date (again our randomly chosen 28th July 2021):
=SF(A2:A7, "historical", "close", "2021-07-28")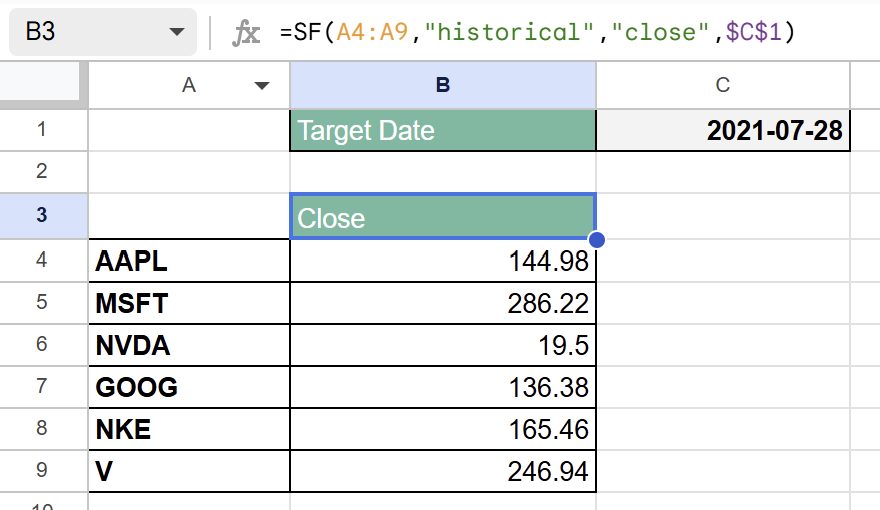
This single formula instantly retrieves historical data for all six stocks! The time savings compound dramatically as your portfolio grows.
Advanced Batch Example: Complete Market Snapshot
Want a comprehensive view of your portfolio on a specific date? Let's pull multiple metrics for multiple stocks:
=SF(A2:A7, "historical", "open&high&low&close&volume", "2021-07-28")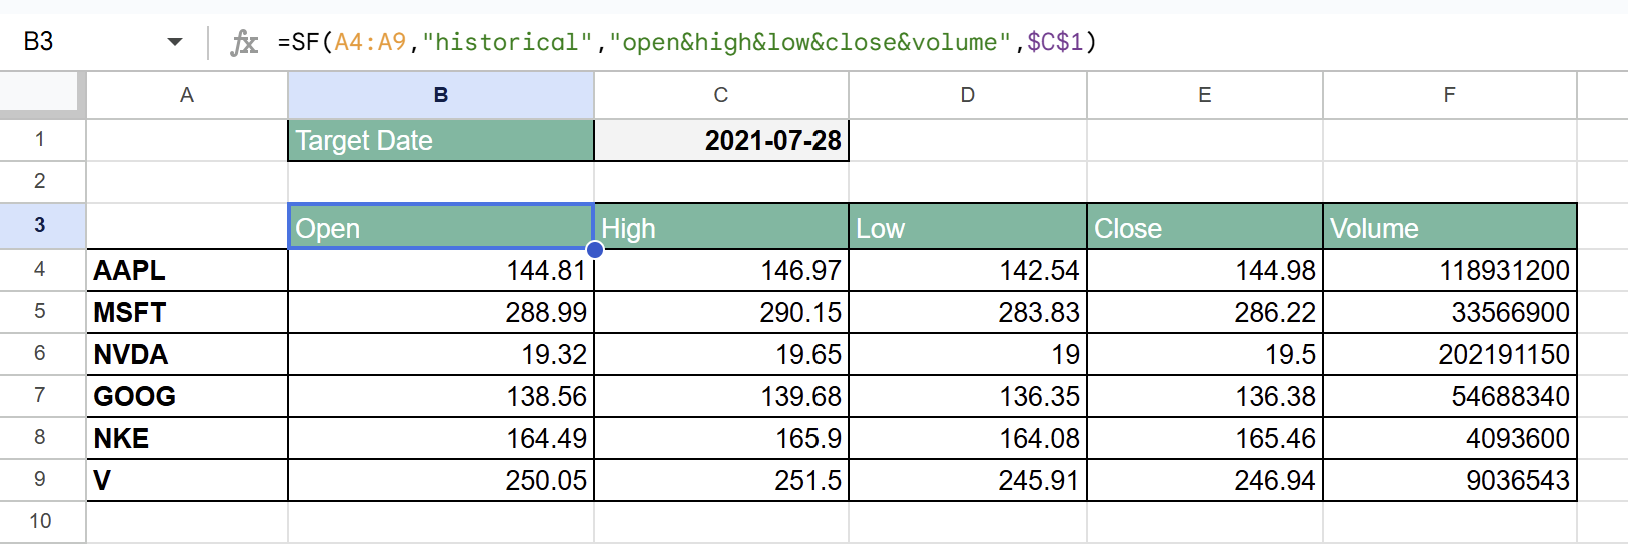
This creates a complete market snapshot, showing you exactly how each stock in your portfolio performed on that specific day. Perfect for:
- Portfolio performance analysis
- Historical volatility studies
- Correlation analysis between stocks
- Backtesting trading strategies
Handling Edge Cases: Weekends and Holidays
The market isn't open every day, so what happens when you request data for a weekend or holiday?
=SF("AAPL", "historical", "close", "2021-07-31")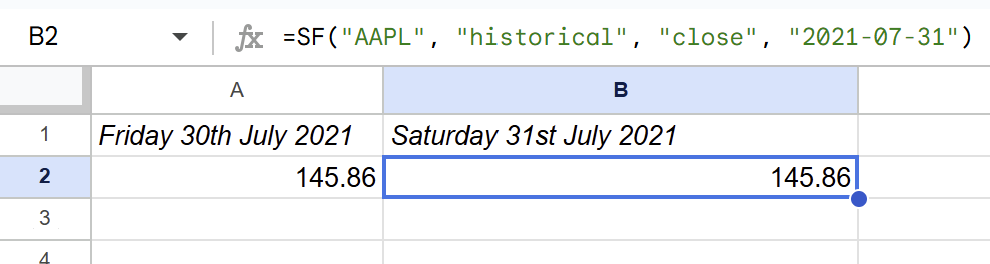
Since July 31, 2021 was a Saturday, the function intelligently returns data from the most recent trading day (Friday, July 30). This automatic adjustment saves you from having to check calendars constantly.
⚠️ Important Note: While the function handles weekends automatically, it doesn't account for all global holidays. If you get a "no data" error, verify that the market was open on that date.
Building Real-World Applications
Portfolio Snapshot Tool
Create a dynamic portfolio analyzer that shows your holdings' values on any historical date. Set up your spreadsheet like this:
- Column A: Stock symbols (
A2:A13) - Cell B2: Target date (e.g.,
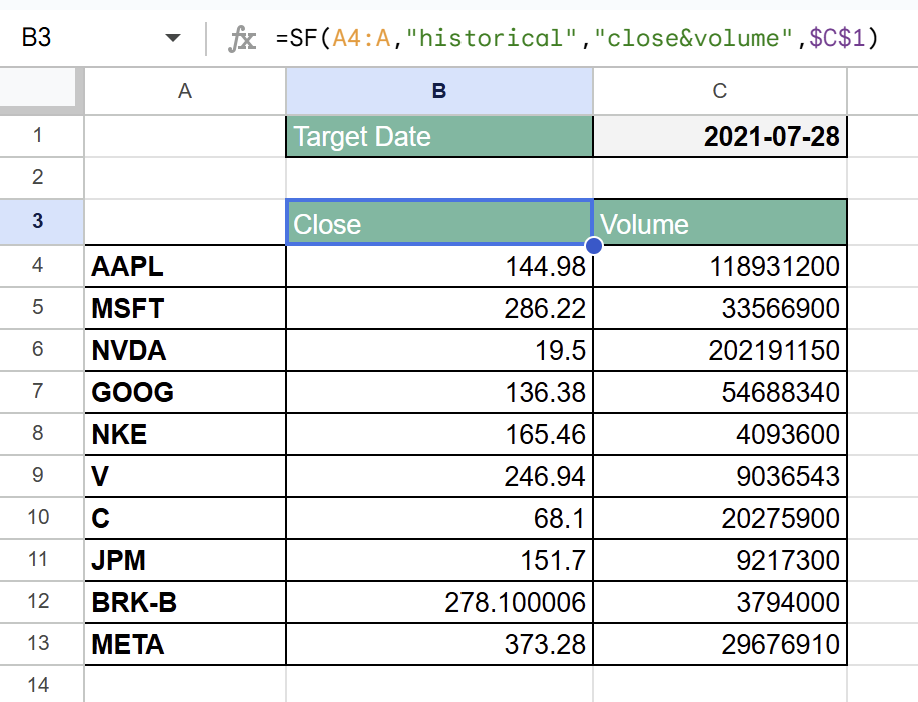
"2021-12-31") - Formula in C1:
=SF(A2:A13, "historical", "close&volume", B2)Now you can change the date in B1 to instantly see your portfolio's historical snapshot for any trading day in the last 30+ years!
Backtesting Framework, Year-Over-Year Comparison and more...
Explore more real use cases via building a backtesting system by pulling historical data for specific entry and exit dates:
=SF(A2:A50, "historical", "adjClose", "2020-03-23")This would show you the adjusted closing prices for 50 stocks on March 23, 2020 (the COVID-19 market bottom), perfect for analyzing "what if" scenarios.
Pro Tips for Maximum Efficiency
1. Use Adjusted Close for Accurate Historical Analysis
When analyzing long-term performance, always use "adjClose" instead of "close":
=SF("AAPL", "historical", "adjClose", "2015-01-02")2. Remove Headers for Cleaner Data
Add "NH" (No Header) option when you don't need column labels:
=SF(A2:A10, "historical", "close", "2021-07-28", "NH")3. Dynamic Date References
Instead of hard-coding dates, use cell references for flexibility:
=SF("AAPL", "historical", "close", B1)Understanding the Output Format
The function's output adapts based on your request:
- Single symbol, single metric: Returns just the value (no headers)
- Multiple symbols OR multiple metrics: Includes headers by default for clarity, these can be removed using the options argument
"NH" - Batch requests: Organized in a table format with symbols as rows
This intelligent formatting means your data is always presentation-ready.
Common Use Cases
1. Year-End Portfolio Valuation
Pull December 31st closing prices for tax reporting:
=SF(A1:A100, "historical", "close", "2023-12-31")2. Anniversary Analysis
Check how your investments performed exactly one year ago:
=SF(A1:A100, "historical", "close", TODAY()-365)3. Event-Driven Analysis
Analyze market reactions to specific events at a point in time:
=SF(A1:A100, "historical", "open&close&volume", "2023-03-10")Function Generator: Your Secret Weapon
Don't want to memorize all the parameters? SheetsFinance includes a handy Function Generator that builds your formulas automatically. Access it through Extensions > SheetsFinance > Function Generator in Google Sheets.
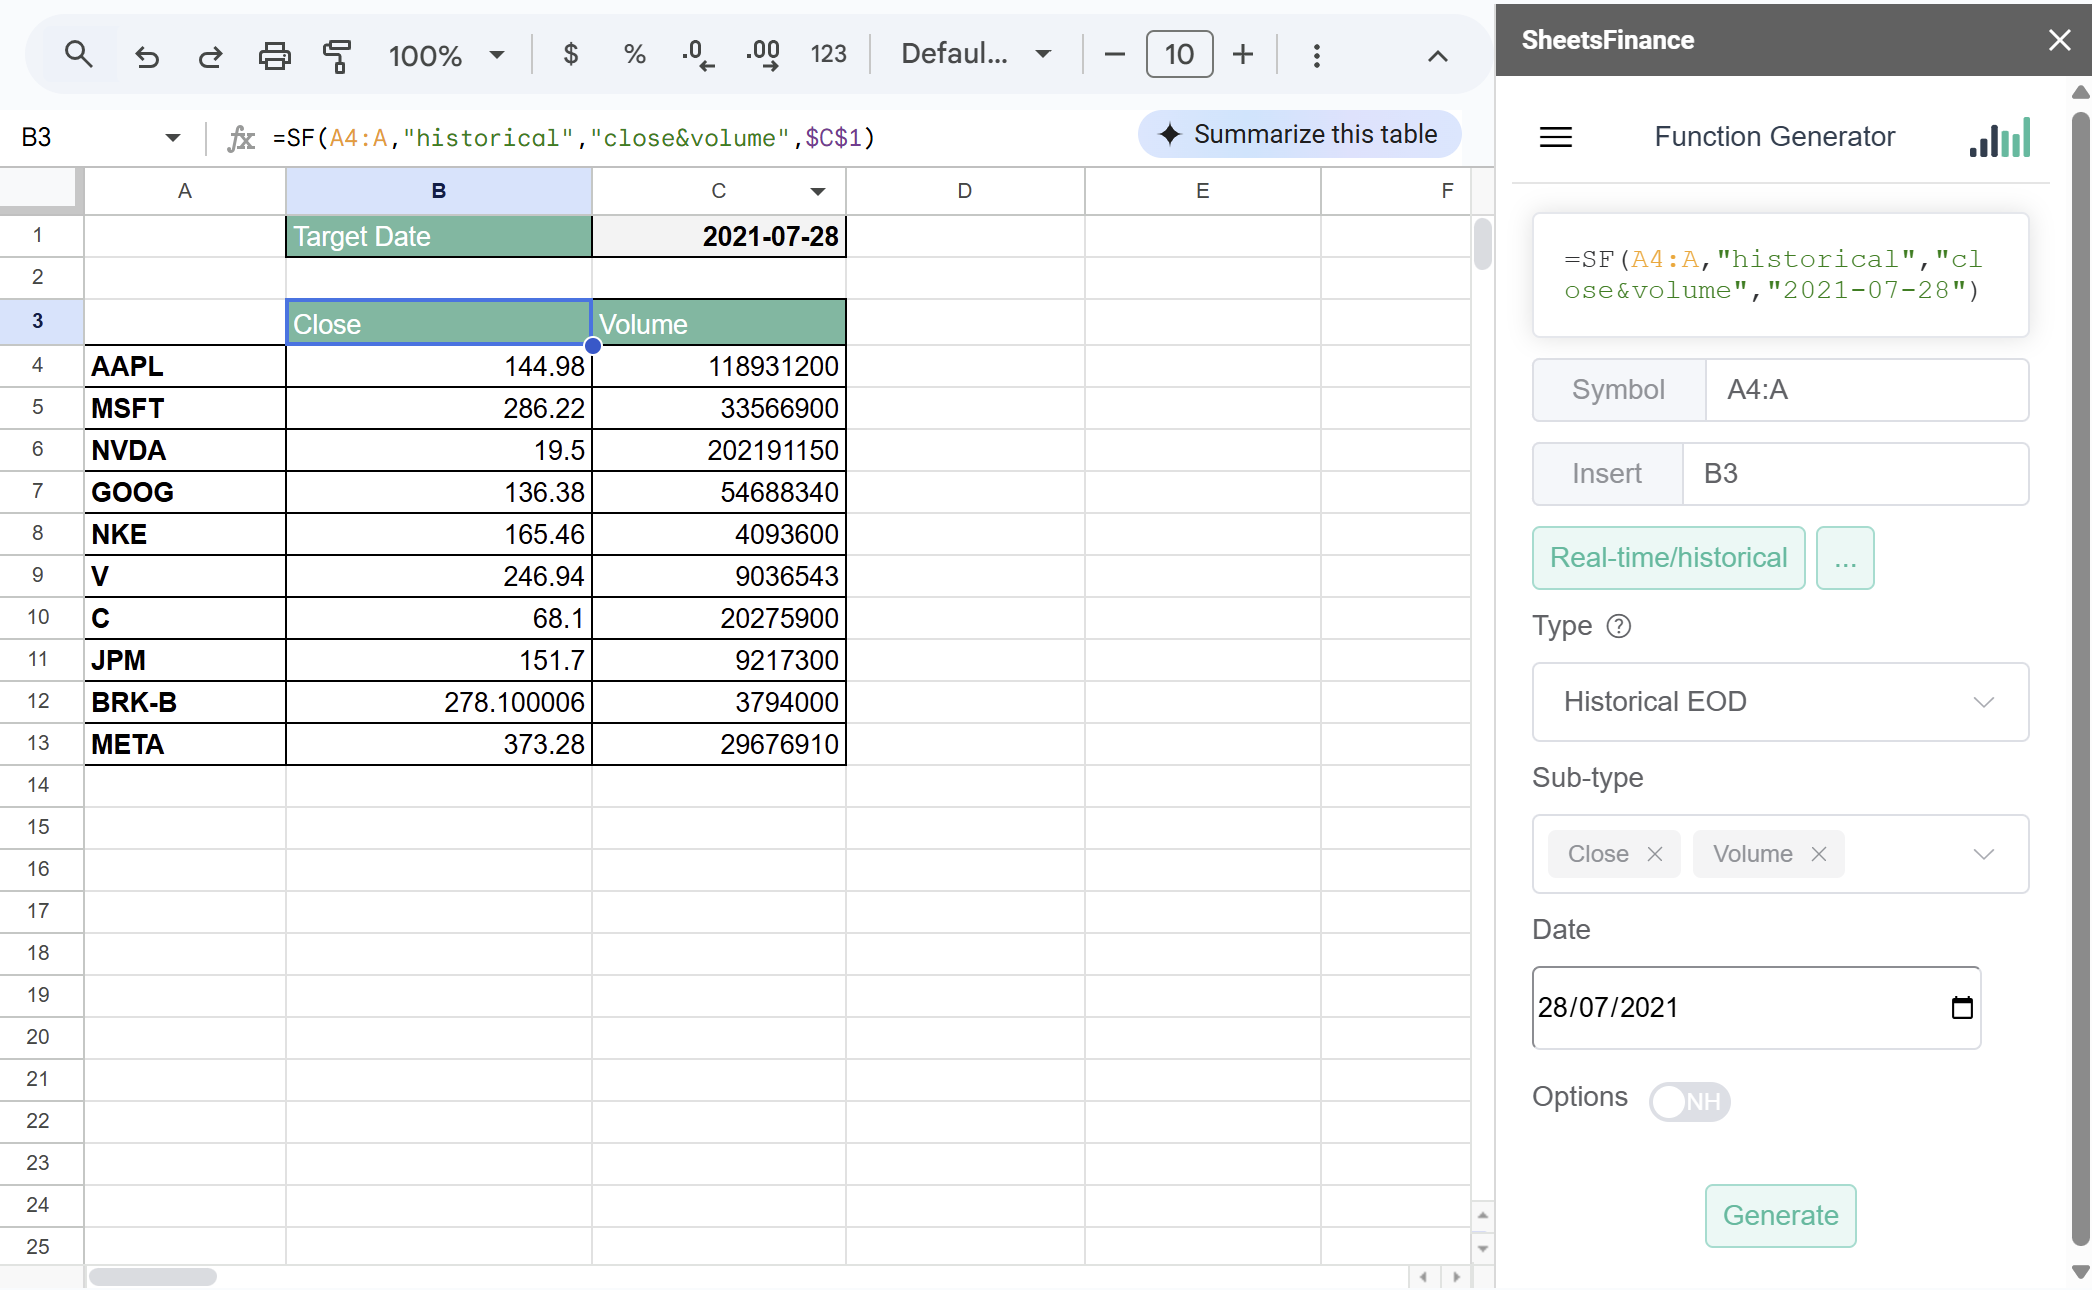
Simply select your function type, input your desired parameters, and the generator creates the perfect formula for you.
Limitations to Keep in Mind
- Market Caps: The
"marketCap"metric cannot be used in batch operations - Plan Limits: Batch size depends on your subscription level (check our pricing page)
- Holiday Handling: Manual verification needed for market holidays
Conclusion
The historical function transforms Google Sheets into a powerful historical data platform. Whether you're analyzing a single stock's performance from 2005 or pulling yesterday's closing prices for 500 symbols, you now have the tools to access decades of market data instantly.
From portfolio tracking to sophisticated backtesting, this function eliminates the barriers between you and historical market insights. No more manual data entry, no more switching between multiple platforms—just pure, efficient analysis.
Ready to unlock 30+ years of market history? Start with a simple formula and watch as historical analysis becomes effortless. Your future investment decisions will thank you for the historical perspective!
For more advanced examples and complete documentation, visit the SheetsFinance historical data documentation. Have questions? Our support team is here to help.
Happy spreadsheeting!