Build a Real-time Cryptocurrency Watchlist in Google Sheets
Producing an entire cryptocurrency watchlist can be a difficult task, particularly when trying to find real-time data across a myriad of blockchain solutions, data providers and more. Whilst you may be interested in some of the more well known tokens like Bitcoin or Ethereum, as well as some less known ones, you are likely going to end up with different portfolios across different wallets and exchanges. Having it all in one place would be quite handy and simple to track you're overall wealth and its change.
Well in this article we'll step through how to build a cryptocurrency watchlist in Google Sheets leveraging SheetsFinance. The watchlist runs off only a few batch functions and so the data loads in super fast. Not only that, but a bit of conditional formatting and some sparklines can give you a great 'at a glance' view on all the symbols you're tracking.
Alright, let's get started!
Getting Started
- Make sure SheetsFinance is properly installed and linked to your google account, if not, you can find how to do so here.
- Check out the free template and create a copy.
- Want to learn through a video tutorial? Check out our YouTube Channel.
Crypto Price and Price Change
We'll first set up along row 1 the symbols we want to track. In this example, we'll track some of the more popular tokens, including Bitcoin, Ethereum and BNB, but a few more as well. To do so, we'll add BTCUSD, ETHUSD, and BNBUSD in cells B1, C1, and D1 respectively, and repeat the same process when wishing to add further symbols.
💡 Quick Tip: You must specify the base currency in the token name/symbol to ensure the value is outputted in that currency. For example,
BTCUSDwill output the price of Bitcoin in United States Dollars (USD).
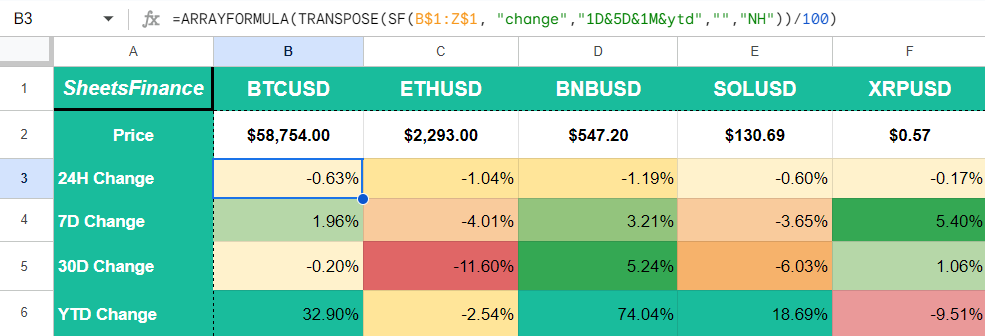
Next, we'll add certain metrics down column A that we'd like to track. Let's begin with the real-time price, and multi-interval % changes, from 24 hours all the way to year-to-date performance.
Use the following to to generate the real-time price for all the symbols with one function:
=TRANSPOSE(SF(B$1:Z$1))This function is our Real-time Batch function, which delivers real-time data for multiple symbols with a single call. TRANSPOSE() is an in-built Google Sheets function used in this case to transpose the data from a row to a column to make it more appealing in the sheet.
Now, let's add the 1-day, 7-day, 30-day, and year-to-date percentage price change for all the symbols:
=ARRAYFORMULA(TRANSPOSE(SF(B$1:Z$1, "change","1D&5D&1M&ytd","","NH"))/100)This uses our Price Change Batch to generate real-time performance metrics. To ensure the output is returned in a percentage format we're dividing the output by 100. Seeing as we're applying calculations to an entire range of cells, we're using Google Sheet's in-built ARRAYFORMULA() function. You can read more on that in Google's Docs here.
Next we've applied some conditional formatting to the percentage change data to make it more visually appealing. This helps us quickly see which assets have performed well or poorly over the specified timeframes
📝 Note: The
SFfunction is used to fetch the data from SheetsFinance, and is capable of data batching, i.e. load multiple data points at the same time to reduce your Google daily quota usage. TheTRANSPOSE()function is used to transpose the data from a row to a column to make it more appealing in the sheet.
Sparklines
Sparklines are an excellent tool for visualizing data in a compact and easily digestible form. They can provide a quick visual representation of how the price of an asset has changed over time, right next to the numerical data. To enhance our watchlist, we'll add sparklines below the percentage change data for each symbol.
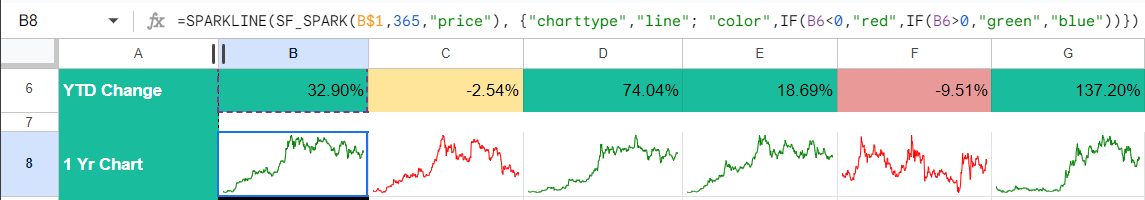
To generate a sparkline for each symbol, use the following formula. Let's use BTCUSD as an example:
=SPARKLINE(SF_SPARK(B$1, 365, "price"), {"charttype", "line"; "color", IF(B6 < 0, "red", IF(B6 > 0, "green", "blue"))})In this formula, two functions work together: SF_SPARK() and Google Sheets' native SPARKLINE() function. The SF_SPARK() function fetches historical price data for the specified symbol (BTCUSD in this case) over a specified number of days, here set to 365. The SPARKLINE() function then uses this historical data to create a small, inline chart that represents the price movement over the past year.
📝 Note: You can read more about formatting Google's sparklines in Google's documentation.
We've also added conditional formatting to the sparklines to provide immediate visual feedback on the performance. The sparkline's color changes based on the year-to-date (YTD) percentage change value located in the cell directly above it (in this case, B6):
- Red if the YTD change is negative
- Green if the YTD change is positive
- Blue if there is no significant change
This color-coding gives you a quick way to assess at a glance whether the asset's value has trended upward or downward over the year.
By incorporating sparklines alongside your data, you create a more dynamic and informative watchlist that combines both numerical and visual analysis to help you quickly interpret market trends.
Relative Token Market Cap
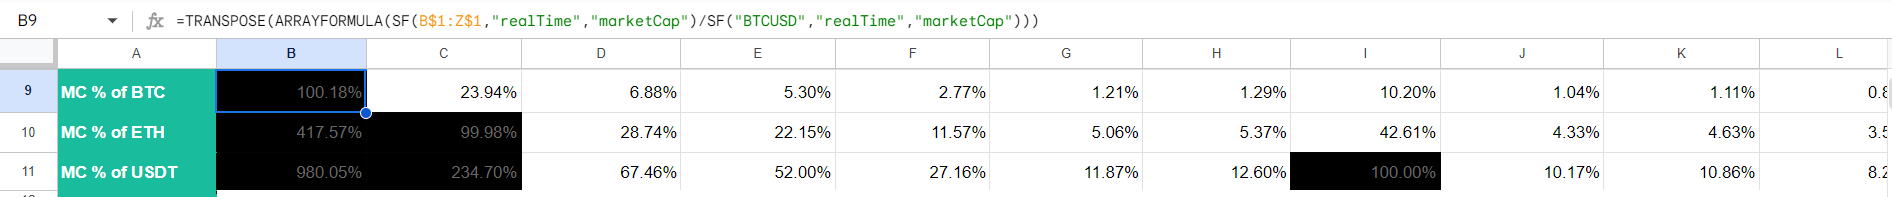
It is well known that Bitcoin, Ethereum and the USDT stablecoin make up the 3 biggest tokens by market cap. We can add a small calculation to our watchlist that shows the relative market cap of the tokens we are tracking, compared to the total market cap of all tokens.
Use the following to generate the relative market cap with respect to BTCUSD for all your added symbols:
=TRANSPOSE(ARRAYFORMULA(SF(B$1:Z$1,"realTime","marketCap")/SF("BTCUSD","realTime","marketCap")))
You can repeat the same line for a relative market referenced to ETHUSD and USDTUSD. We'll also add a some more conditional formatting here to the relative market cap, where if the value exceed 100% (i.e. often when comparison BTC to itself, or ETH to BTC), the cell will filled in black just to reduce visually the impact of the value.
Perceiving the Market's Mood
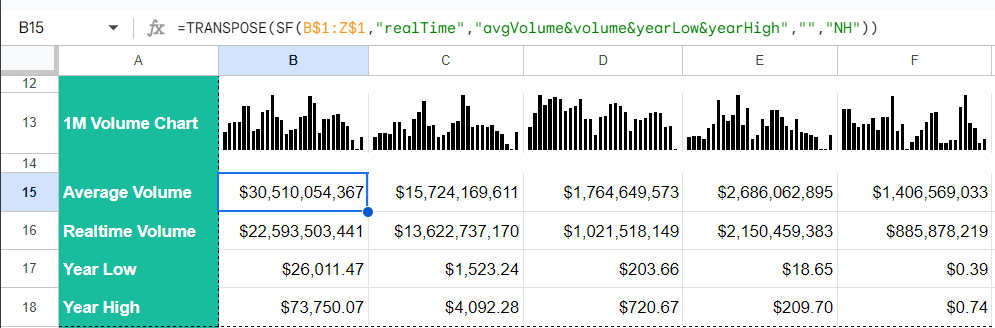
Volume data is quite relevant to touch upon in the cryptocurrency world, hence why we'll add another sparkline to visualize the monthly volumne changes over time. Let's do so for BTCUSD:
=SPARKLINE(SF_SPARK(B$1,30,"volume"),{"charttype","column"})💡 Quick Tip: You can modify the timeframe of the sparkline by changing the second parameter of the
SF_SPARK()function. In this case, we've set it to 30 days.
Let's also add the average volume per token, as well as the real-time volume to get a sense of how the market is moving compared to the average. We'll generate both of these in a single go, this time taking advantage of both the batch and 'metric chaining' functionalities of the SF() function:
=TRANSPOSE(SF(B$1:Z$1,"realTime","avgVolume&volume&yearLow&yearHigh","","NH"))As you've likely noticed we've also added in the yearLow and yearHigh here. This gives us a more complete view of the market's mood over the past year. Is it greedy, fearful, or neutral? Well a combination of volume trends, relative % changes and the yearLow and yearHigh can give you a good idea!
📝 Note: Metric chaining is where we output multiple metrics from the same function by chaining them together with the
&operator. In the above example we outputted 4 metrics from the real-time function like so,"avgVolume&volume&yearLow&yearHigh".
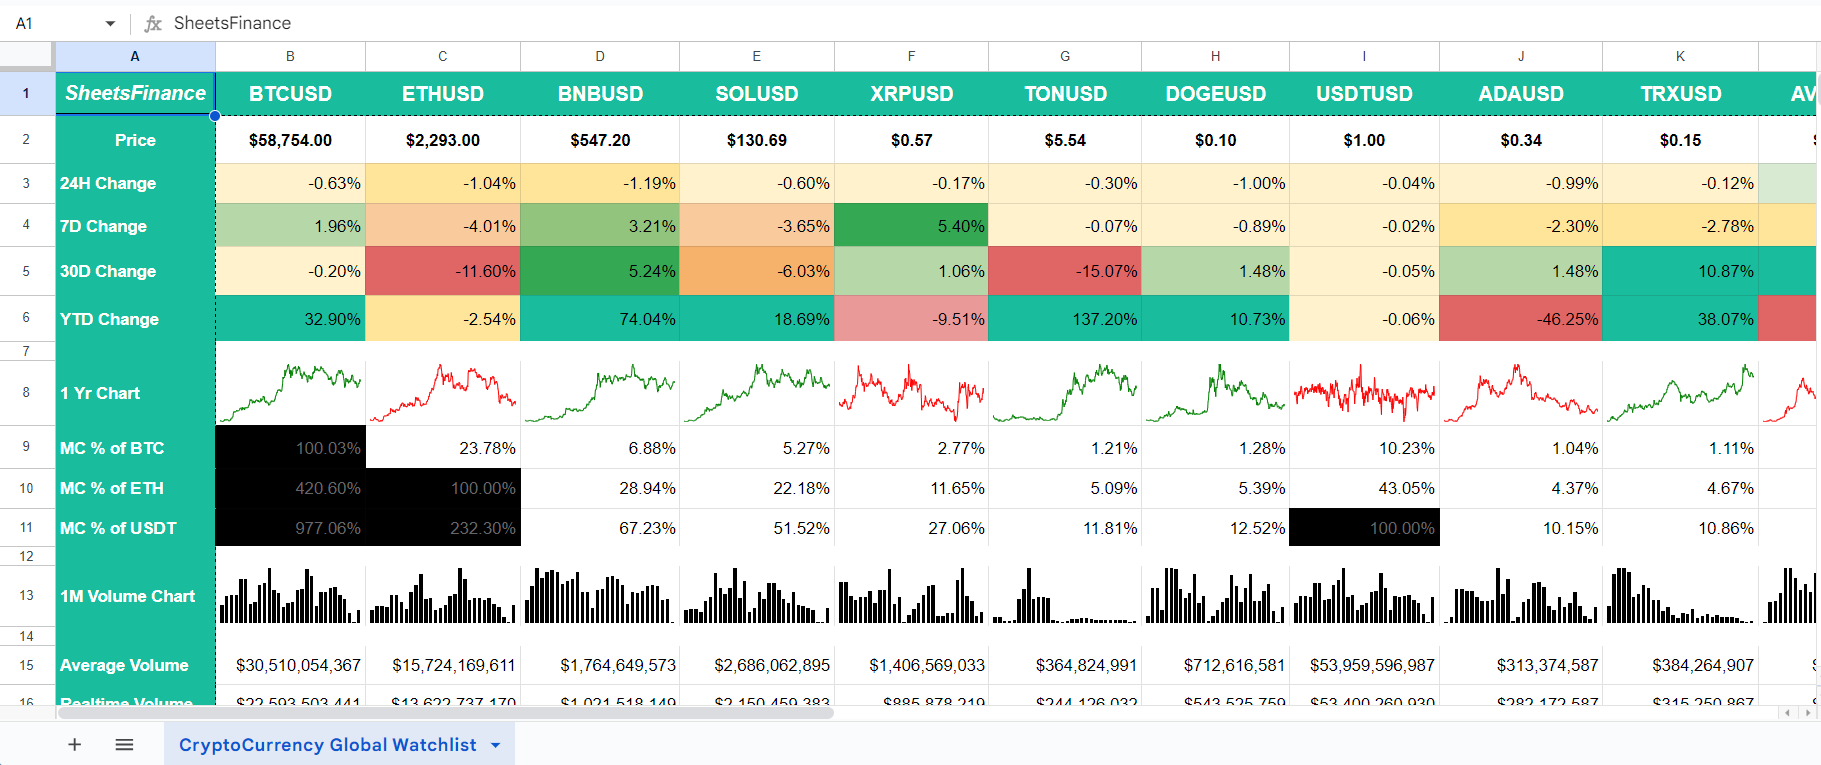
And that's it! Here's an overall image of the template, which you can access for free right here.
Further Market Coverage on Sheets Finance
You can also view the full list of available markets on SheetsFinance on our Available Markets page in our docs, which provides a comprehensive list of all the exchanges supported by Sheets Finance.
Using the Function Generator to build these functions for you
Feeling a bit overwhelmed by all the functions? Don't worry, we've got you covered 😁
Our Function Generator is a tool that builds these functions for you. Just select the function you want to use, input the required parameters, and the Function Generator will generate the function for you and automatically insert it into your Google Sheet. You can find the Function Generator in the Google Sheets under (Extensions > Sheets Finance > Function Generator).
Symbol Search
If you aren’t sure what ticker to use for a certain company, either use the Symbol Search tool within Google Sheets (Extensions > Sheets Finance > Symbol Search), or visit the SF Symbol Search page.
You can also use the SF_MAP function to translate any ISIN, CUSIP or CIK code into the correct ticker used at SheetsFinance, for more information, kindly look through this documentation page.