How to Get Altmans Z-Score and Piotroski F-Score for any listed company in Google Sheets
Evaluating a company's financial health, likelihood of bankruptcy, or even the quality of its financial statements can be a daunting task. However, with the help of financial scoring metrics like the Altman Z-Score and the Piotroski F-Score, you can simplify this process and make more informed investment decisions.
Now you can easily fetch both these scores for any listed company around the world, directly in your Google Sheets, using the SheetsFinance add-on.
Getting Started with SheetsFinance
- Make sure SheetsFinance is properly installed and linked to your google account, if not, you can find how to do so here.
- Check out the following documentation page for reference.
- Check out our Financial Scores Video or our Youtube Channel for even more insights!
A short history on Altman's Z-Score
Edward Altman, in 1968, was seeking to answer some important questions, particularly about the likelihood of a company going bankrupt. He developed the Z-Score model, which is a combination of five financial ratios that can be used to predict the likelihood of a company going bankrupt within two years. Through his research, he has aimed to answer three key questions. Which ratios are vital in finding potential bankrupcty risks. What weights should each ratio have? And how do you establish these weights factually?
Let's have a look at the equation for the Z-Score model:
Z = 1.2A + 1.4B + 3.3C + 0.6D + 1.0EAWorking capital divided by total assets: This first ratio assesses the liquidity and size of a firm, with working capital being the difference between current assets and current liabilities. While there are two other alternative liquidity ratios, such as the quick ratio and the current ratio, in his original paper, Altman assessed the working capital ratio as the most effective, and thus most valuable.BRetained earnings divided by total assets: This ratio is useful to assess the age of a company, as a younger firm would have a lower retained earnings ratio, while a more mature one, benefiting from the long runway of compounding retained earnings, would highlight a higher value. A quick note though, occasionally, retained earning figures may be subject to some accounting manipulation through the use of reserves or some other financial engineering, so it's always good to keep an eye out for that. In particular, companies that have excellent cashflow properties may choose to disburse large dividend amounts, so occasionally showing negative retained earning values.CEarnings before interest and taxes (EBIT) divided by total assets: This is a useful ratio to highlight a companies ability to withstand financial shocks. Can this firm generate enough cash to cover its interest payments? Even if the two prior variables showcase a more negative outlook, can the company still reasonably afford a higher debt financing cost?DMarket value (or book value) of equity divided by total liabilities: The market value of equity is the market capitalization of the company, while the book value of an equity is the value of the company's equity as per the balance sheet. This ratio is useful to understand the leverage of a company, and how much of the company's assets are financed by equity. Tracking this figure overtime could also bring light to the future path of the company. Is it heading towards insolvency, or is it on a path to financial stability?ESales divided by total assets: This ratio is unique, given that it highlights a special connection to the top line of the income statement. It's a useful ratio to understand how efficiently a company is using its assets to generate revenue.
The total score, Z, could then categorise public companies in three different tranches:
DistressedZ-Score under -1.81GreyZ-Score between -1.81 and 2.99SafeZ-Score above 2.99
📝 The More You Know: The original Altman's Z-Score was actually computed as follows,
Z = 0.012A + 0.014B + 0.033C + 0.006D + 0.999E. This was changed in the early 2000s for simplification and ease of use.
A short history on Piotroski's F-Score
Joseph Piotroski, in 2000, was seeking to answer some important questions as well, particularly about the quality of a company's financial statements. He developed the F-Score model, which is a combination of nine financial ratios that can be used to assess the quality of a company's financial statements.
This method is more linear, tallying up 0 or 1 for 9 different criteria, and then summing up the total. The higher the score (up to 9), the better the quality of the financial statements.
Let's have a look at the nine criteria:
- Return on Assets (ROA) divided by average total assets for the year (positive = 1, negative = 0)
- Cash Flow Return on Assets (CFROA) i.e. Net Cash Flow from operating activities divided by average total assets (positive = 1, negative = 0)
- Change in ROA year on year (positive = 1, negative = 0)
- CFROA greater than ROA (positive = 1, negative = 0)
- Change in gearing ratio i.e. the ratio of total debt to total assets year on year (negative = 1, positive = 0)
- Change in working capital i.e. current assets minus current liabilities year on year (positive = 1, negative = 0)
- Number of shares outstanding year on year (unchanged or decreased = 1, increased = 0)
- Change in gross margin year on year (higher = 1, lower = 0)
- Change in asset turnover year on year (positive = 1, negative = 0)
The total score, F, which is the sum of all the above 0 variables, could then categorise public companies in three different tranches:
WeakF-Score under 3AverageF-Score between 4 and 6StrongF-Score above 7
How to Get Financial Scores in Google Sheets
Ookay so we know how the Altman Z-Score and Piotroski F-Score are calculated. Now, how do we get these scores for any company in Google Sheets?
You can generate these scores alongside their calculation components using the Financial Score SheetsFinance function. Here are the basics:
=SF(symbol, "score", metrics, "", options)Underlying Components of Scores
revenue- Company's total revenuetotalLiabilities- Total liabilities from balance sheetmarketCap- Current market capitalizationebit- Earnings before interest and taxesretainedEarnings- Accumulated retained earningstotalAssets- Total assets from balance sheetworkingCapital- Current assets minus current liabilities
Scores
piotroskiScore- Piotroski F-Score (0-9 rating)altmanZScore- Altman's Z-Score
All-in-One Option
all- Fetches all available metrics in a single call. This is the default response if no metrics are entered.
🔥 Hot Tip: You can select as many metrics as you'd like by chaining them together with the
&operator, for example=SF("NVDA", "score", "piotroskiScore&altmanZScore").
Examples of Using the Financial Score Function (Copy and Paste into Your Google Sheet!)
Here's the quickest way of fetching all metrics, using NVIDIA (NVDA) as our example:
=SF("NVDA", "score")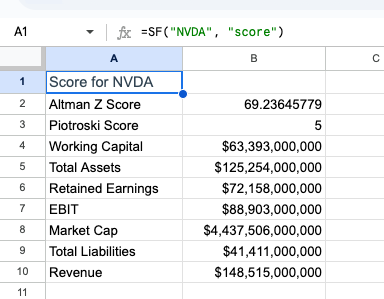 To display the specific scores, add the
 metric parameters desired, as highlighted previously:
=SF("NVDA", "score","piotroskiScore&altmanZScore")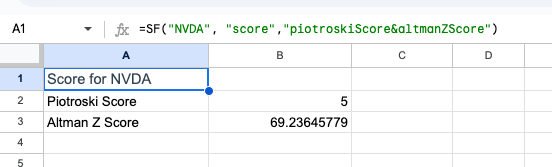
💡 Quick Tip: You can modify the
optionsparameter in the function to remove the line items ("NLI") and/or remove the header row ("NH"). You can combine options with the&operator for example=SF("NVDA", "score", "piotroskiScore&altmanZScore", "", "NLI&NH").
And that's it! It's that simple. You can now run this function for any of our 80,000+ available global tickers.
Using the Function Generator to Build these Functions For You
Feeling a bit overwhelmed by all the functions? Don't worry, we've got you covered! 😁
Our Function Generator is a tool that builds these functions for you. Just select the function you want to use, input the required parameters, and the Function Generator will generate the function for you and automatically insert it into your Google Sheet. You can find the Function Generator in the Google Sheets under (Extensions > Sheets Finance > Function Generator).
Symbol Search
If you are not sure what ticker to use for a certain company, either use the Symbol Search tool within Google Sheets (Extensions > Sheets Finance > Symbol Search), or visit the SF Symbol Search page.
You can also use the SF_MAP function to translate any ISIN, CUSIP or CIK code into the correct symbol used by SheetsFinance, for more information, kindly look through this documentation page.
Conclusion
In conclusion, obtaining the Altman Z-Score and Piotroski F-Score in Google Sheets is a straightforward process with the SheetsFinance function. By leveraging the power of this function, you can easily analyse the financial health of any company using these important metrics. Whether you're a seasoned investor or just starting out, having access to these scores can provide valuable insights into a company's performance and potential risks.
~ Happy Spreadsheeting