How to Get Company Revenue Segmentation by Product or Geography in Google Sheets
Revenue segmentation involves breaking down a company's total revenue into its key components, whether by geography, product lines, or services. This granular view not only highlights which segments are fueling overall performance but also pinpoints critical areas for improvement.
For investors, understanding revenue segments is crucial. It reveals how diversified a company is, which markets are growing, and where potential risks lie. For example, if a company relies heavily on one geographic region or product line, any downturn in that area could significantly impact overall performance.
SheetsFinance makes it simple to extract this level of detail directly from SEC filings. For example, you can retrieve revenue segmentation by geography using specialized data types such as "revSegGeoQ" (for quarterly data). This feature enables you to view historical data side-by-side, making it easier to monitor trends over time.
If you're after a quick read, here's an example that demonstrates how you can pull quarterly revenue metrics for Apple segregated by geographic regions, such as the Americas and Japan:
=SF("AAPL", "revSegGeoQ", "period&date&Americas Segment&Japan Segment", "2023-2024")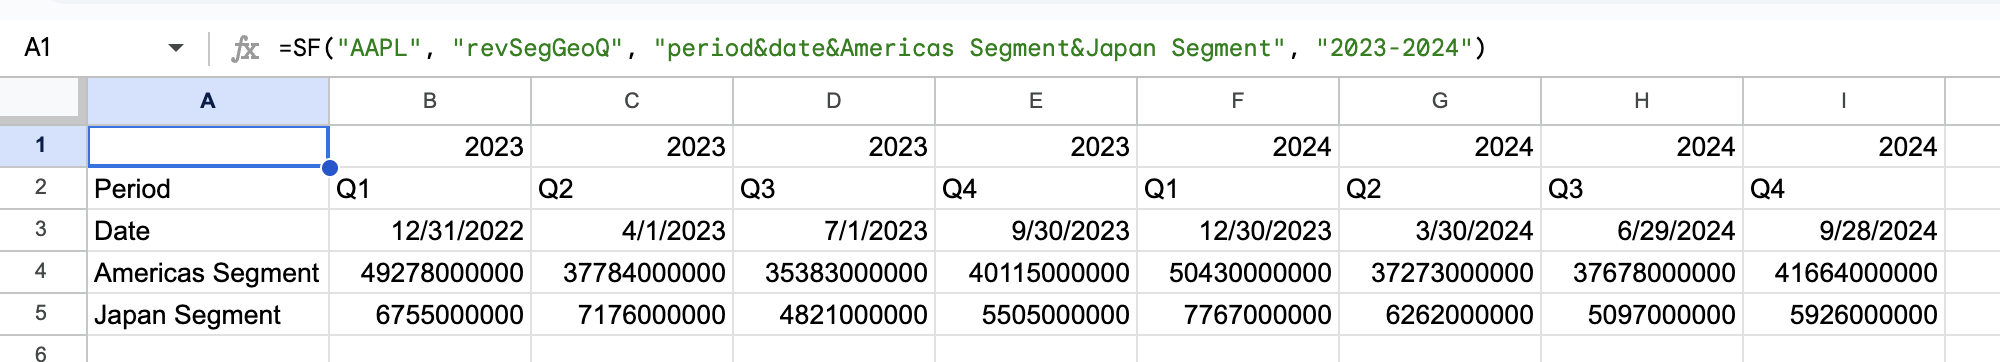
For product segmentation, similar logic applies. Although geographical segmentation is commonly used, you can also analyze revenue by product categories, such as iPhone, Mac, iPad, and Services, to understand which offerings drive your revenue growth.
By incorporating these functions into your Google Sheets, you not only get a historical perspective but also a dynamic tool to support real-time decision-making. Whether you're assessing the impact of a new product launch or evaluating market expansion strategies, the insights you gain will help transform your financial analysis process into a strategic advantage.
Let’s now explore how you can set up your account and seamlessly extract data into Google Sheets, setting the stage for your advanced revenue segments analysis journey.
How to Analyze Company Revenue Segments with SheetsFinance
What You’ll Learn
- Analyze company revenue segments using SheetsFinance
- Break down revenue by business or geographic segment
- Compare segment performance across time periods
- Visualize revenue composition for strategic insights
Prerequisites & Getting Started
Let's make sure you have everything set up to start analyzing revenue segments effectively.
What You'll Need
- SheetsFinance Add-on: Make sure SheetsFinance is properly installed and linked to your Google account. If you haven't installed it yet, follow our step-by-step installation guide.
- Basic Google Sheets Knowledge: Familiarity with entering formulas and basic spreadsheet navigation will help you get the most out of this tutorial.
Quick Setup Check
Let's verify everything is working with a simple test. In any empty cell, try entering:
=SF("AAPL")Essential Resources
Keep these handy as we work through the examples:
- Revenue Segmentation by Product Documentation - Complete function reference
- Revenue Segmentation by Geography Documentation - Complete function reference
- Function Generator - Automatic formula builder
- Symbol Search - Find ticker symbols easily
Okay let's get started generating some data!
Breaking Down Revenue by Segments
Revenue Segmentation by Geography 🌎
For companies that report revenue by region, SheetsFinance offers the "revSegGeo" data type. These functions pull geographical segmentation data directly from SEC filings, enabling you to see how much revenue comes from each region.
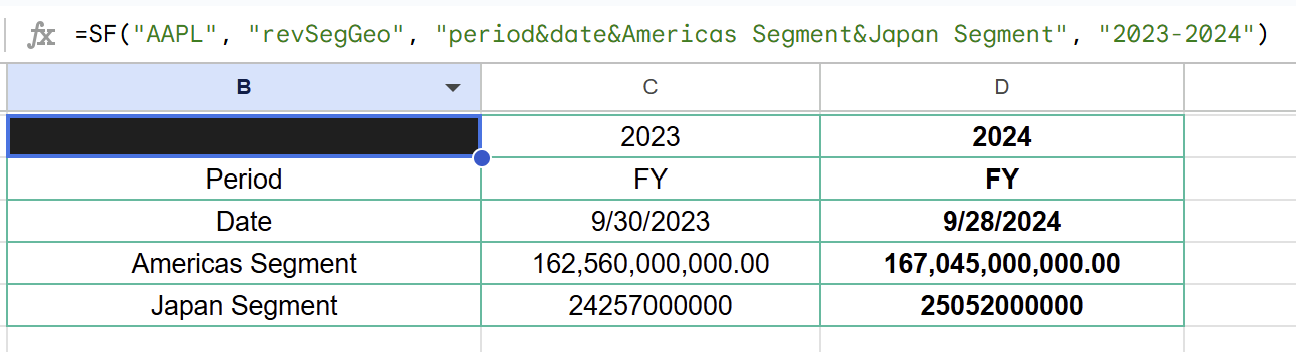
For example, to analyze Apple’s revenue segmentation annually across the Americas and Japan you can use:
=SF("AAPL", "revSegGeo", "period&date&Americas Segment&Japan Segment", "2023-2024")🔥 Hot Tip: Segment names and structures can vary (e.g., "Americas Segment", "Japan Segment"). It's best to start off by generating
"all"segments for a company to see how they report their data, then refine your queries based on the actual segment names.
In this formula:
"AAPL"specifies Apple Inc."revSegGeo"returns data on a per annum basis, while"revSegGeoQ"returns quarterly revenue data by geography.- The chained metrics
"period&date&Americas Segment&Japan Segment"select what data we'd like to output from the function, in this case we're after the reporting period, date, and two specific geographic segments. The order here matters, so you select how you'd like to organise the data. Don't forget you can leave this blank or use"all"to get all segments. - The date range
"2023-2024"defines the period for the analysis.
This formula will return the following:
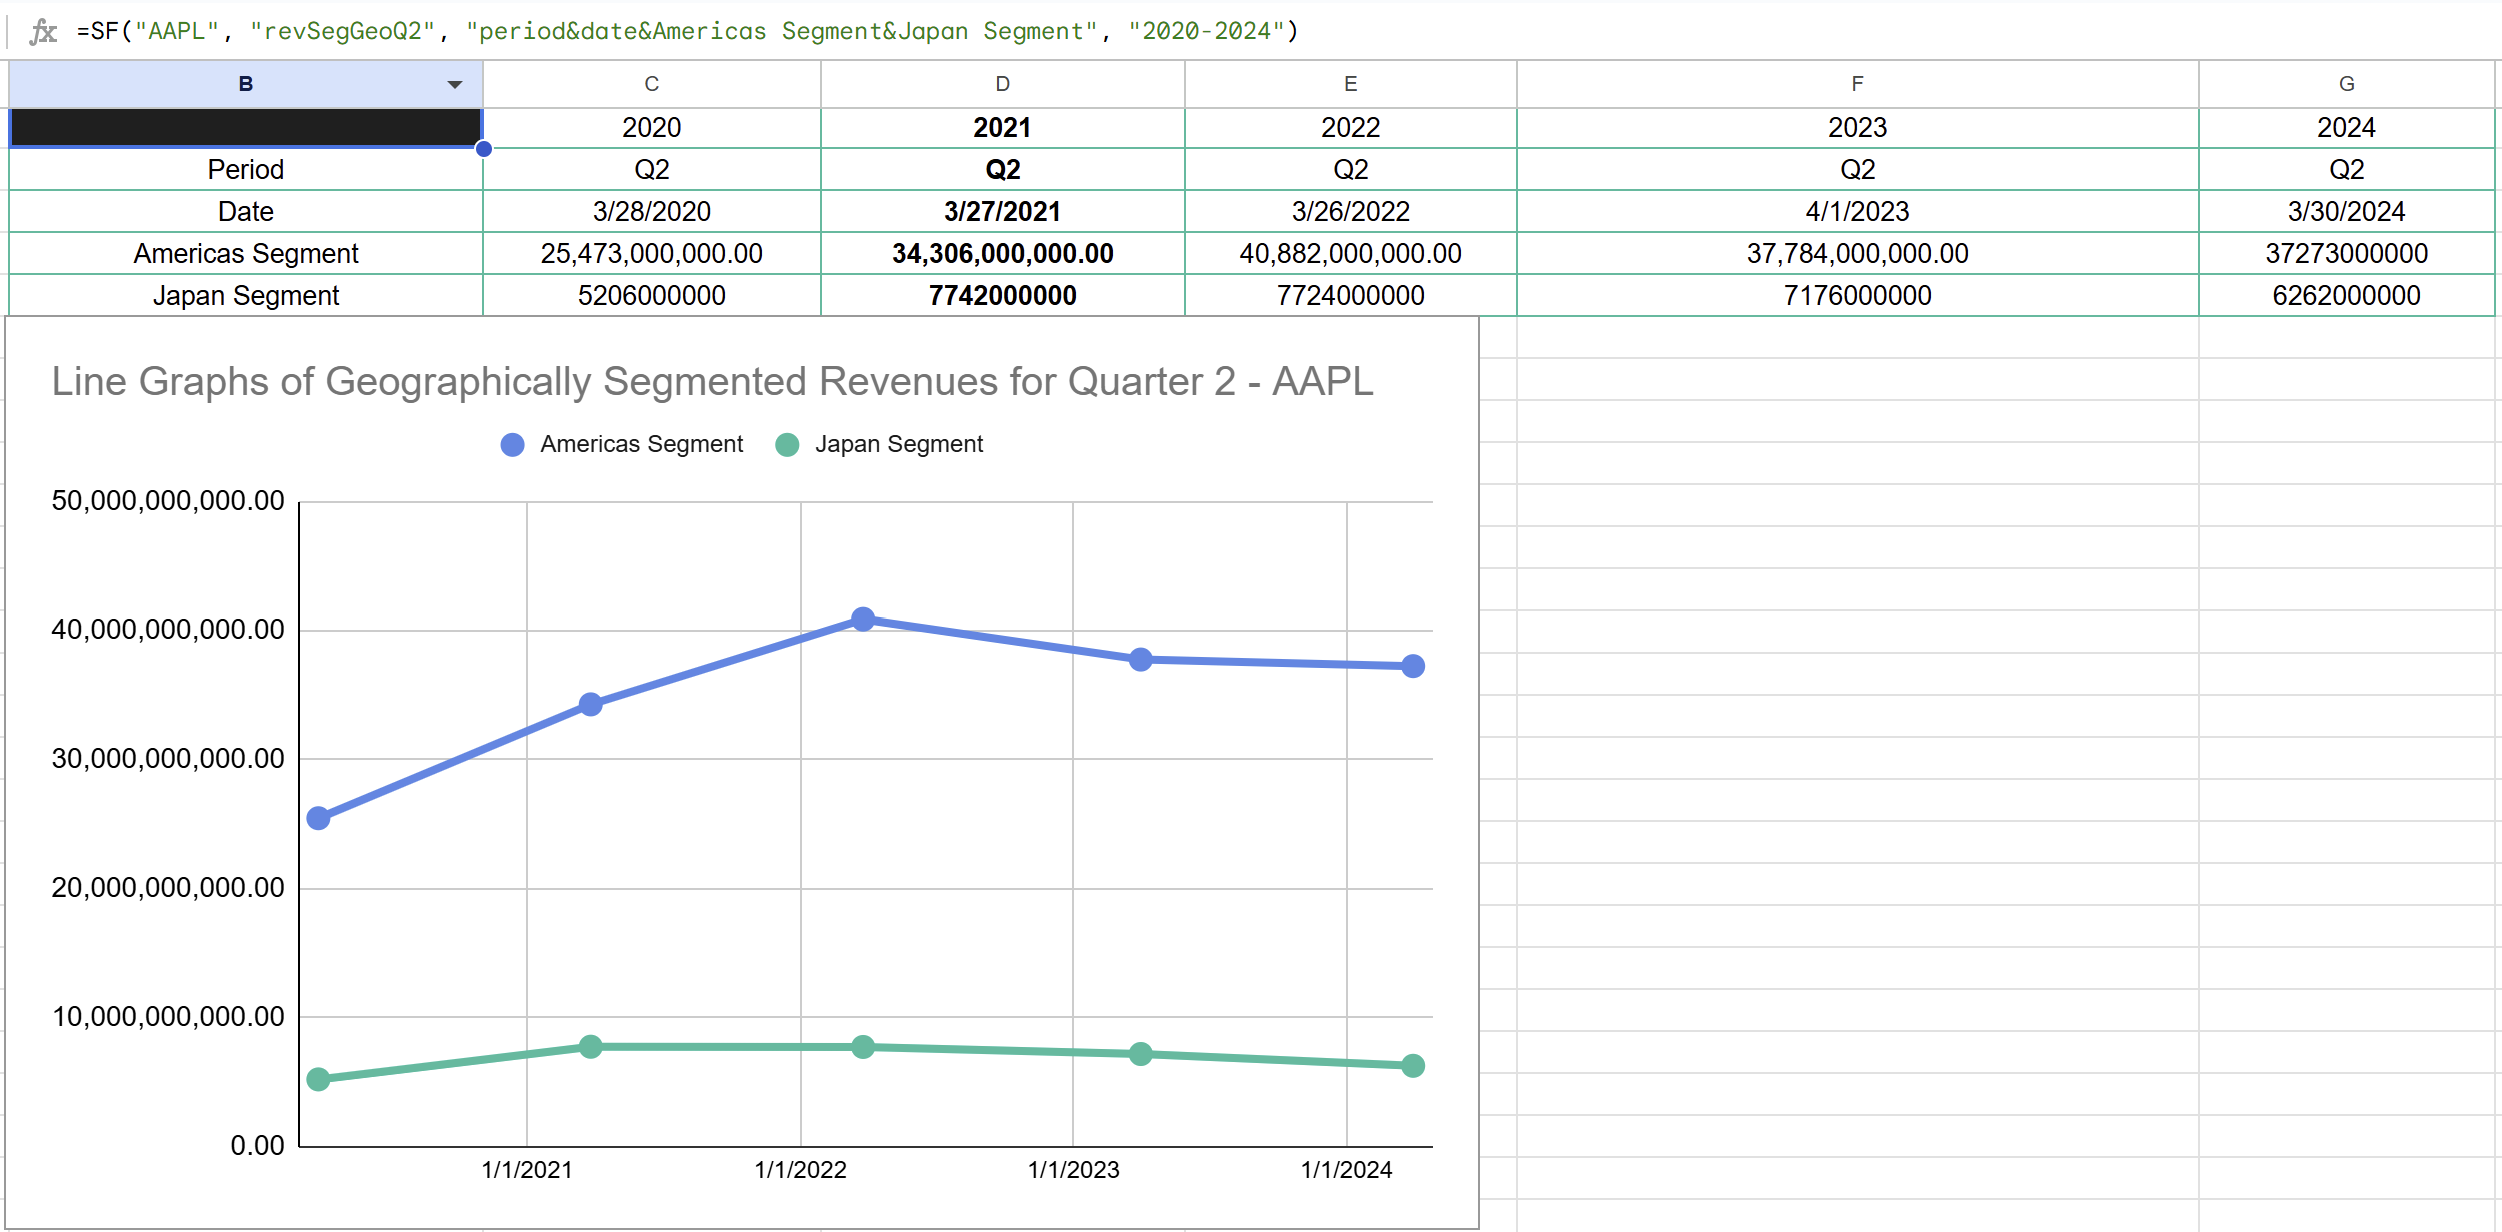
Need to focus on a specific quarter? Simply modify the data type, for example with "revSegGeoQ2". You can then combine this with a range of years to get the all Q2 data over multiple years. For instance, to get the second quarter data for Apple from 2020 to 2024, you can use:
=SF("AAPL", "revSegGeoQ2", "period&date&Americas Segment&Japan Segment", "2020-2024")Now let's visualize the results:
Revenue Segmentation by Product 🧸
For companies that report revenue by product line, SheetsFinance provides the "revSegProduct" data type. This allows you to break down earnings across multiple product categories, such as iPhone, Mac, iPad, and Services, offering a clear view of the company’s diversified revenue streams.
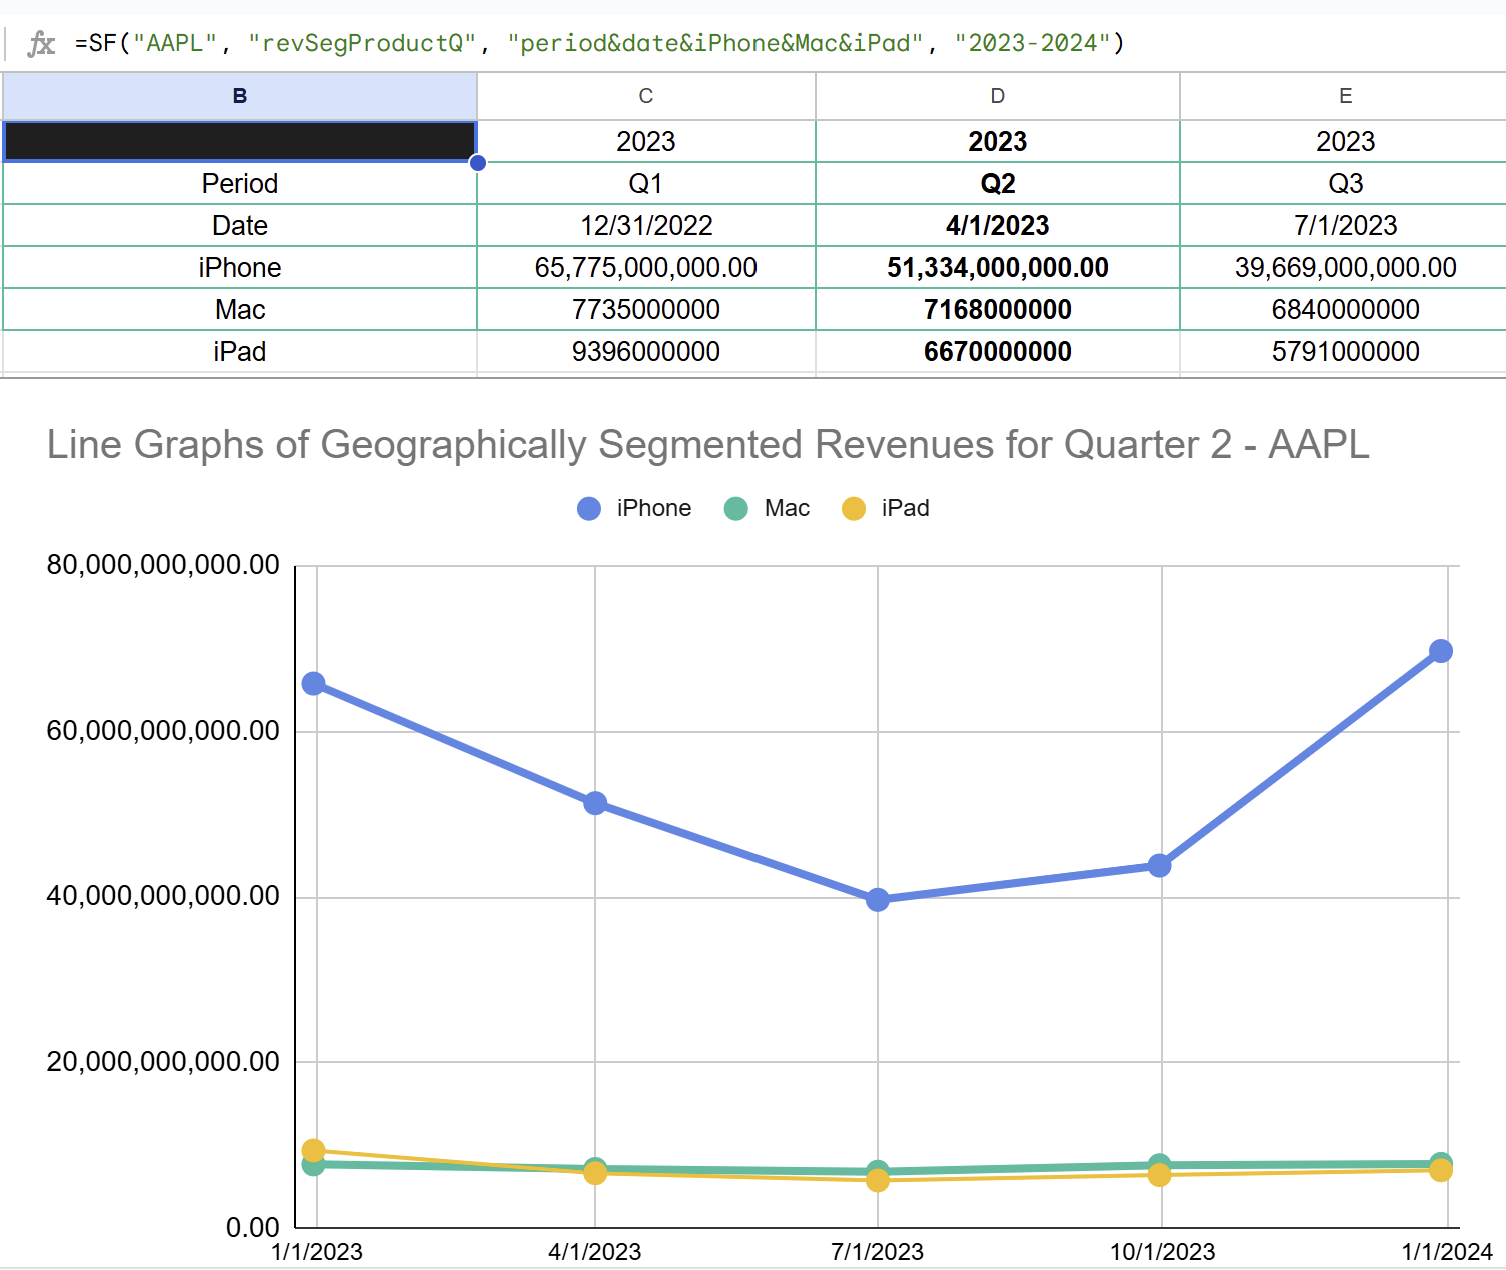
To see Apple’s revenue by product across all quarters from 2023 to 2024, you can use:
=SF("AAPL", "revSegProductQ", "period&date&iPhone&Mac&iPad", "2023-2024")This formula displays:
- The time period and date for context.
- Segments for the iPhone, Mac, and iPad divisions.
Check out the corresponding screenshot for a visual representation:
Similar to the function shown in geographical segmentation, for more granular insights in a specific quarter use:
=SF("AAPL", "revSegProductQ2", "period&date&iPhone&Mac&iPad", "2020-2024")This variant targets a particular quarter each year between 2020 and 2024, making it easier to spot quarterly trends over time.
Both segmentation methods, by geography and by product, detailed insights into revenue trends, allowing you to compare different segments’ performance, spot emerging trends, and even forecast future performance based on historical data. By leveraging these built-in SheetsFinance functions, you transform raw data into actionable intelligence that can fine-tune your financial analysis strategy.
Visualize Revenue Composition for Strategic Insights
Once your segment data is in Sheets, use Google Sheets charts (like pie charts and stacked bars) to quickly see:
- Which regions or products drive the most revenue
- Growth rates across segments
- Strategic shifts and new opportunities
For example, let's build a pie chart to assess the 2024's revenue breakdown of Apple from a geographical perspective, using:
=SF("AAPL", "revSegGeo", "all", "2024")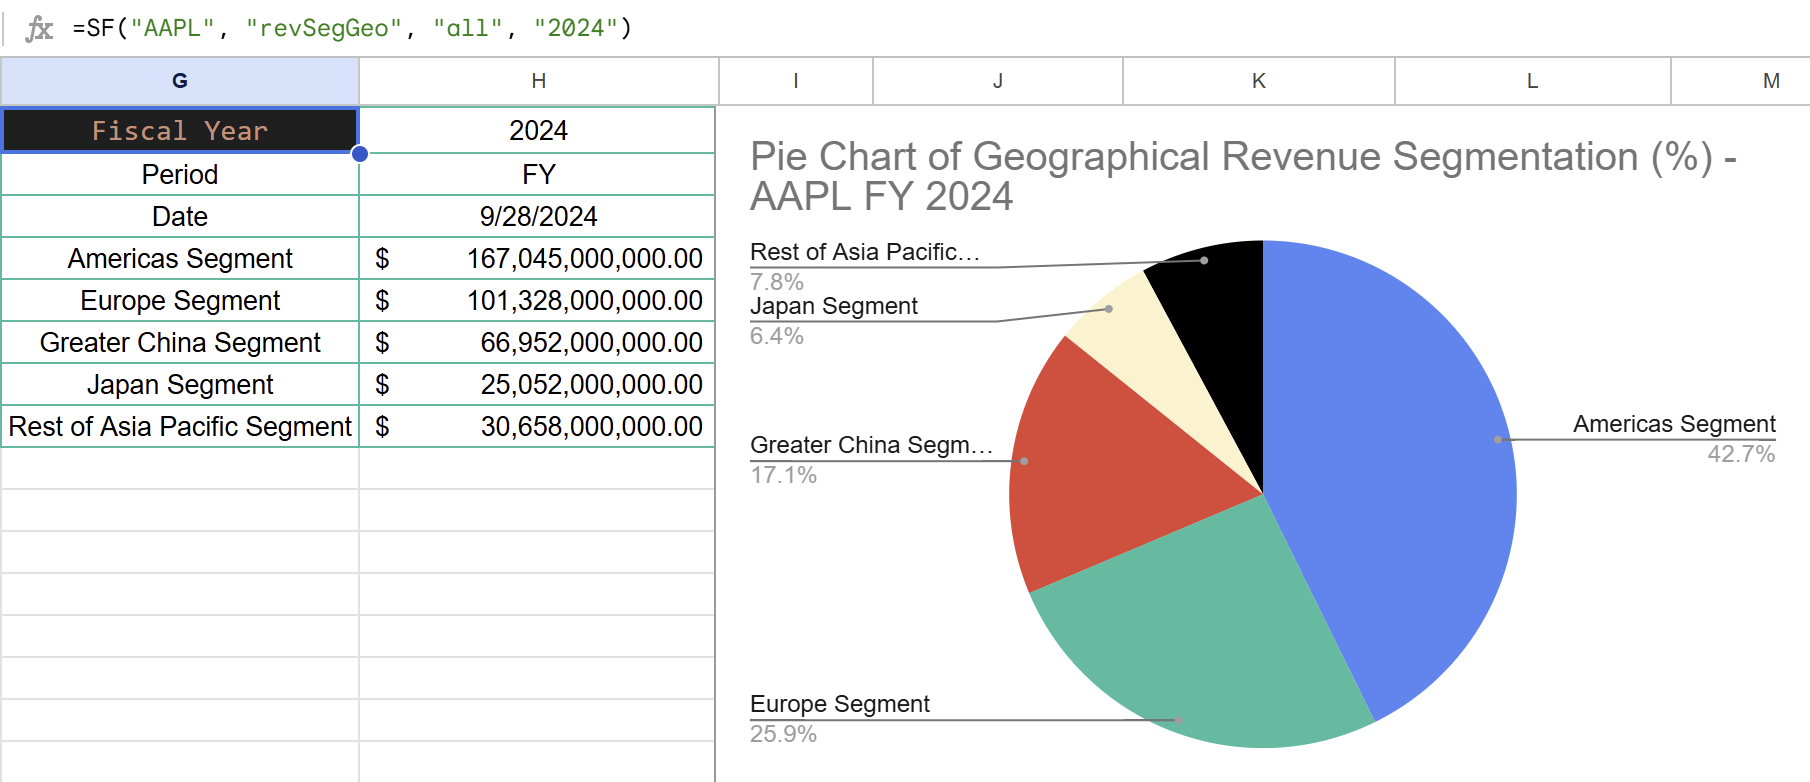
Best Practices ⚡
- At the time of writing this blog, only US-listed companies are supported for segment breakdowns in SheetsFinance (the data is sourced directly from SEC filings).
- If a formula returns blank or an error, the company likely doesn't report segmented revenue, or that specific metric isn’t available.
- Always validate the segments returned, names and groupings can change from year to year as companies reorganize. You can do this by first pulling all segments with
"all"to see the current structure.
Still confused? Jump into our comprehensive documentation for more examples and guidance. And, in the meantime, here are some clear examples to get you started.
Example 1: Most Recent Annual Revenue by Geography
Pulling the most recent year’s revenue breakdown by region for Apple Inc.:
=SF("AAPL", "revSegGeo")Example 2: All Geographical Segments in a Specific Year
Display all reported geography segments for Apple in 2022:
=SF("AAPL", "revSegGeo", "all", "2022")Example 3: Most Recent Annual Revenue by Product
Most recent annual revenue by product:
=SF("AAPL", "revSegProduct")Example 3: All Products Segments in a Specific Year
Want to see all product segments for Apple in 2022? Use this:
=SF("AAPL", "revSegProduct", "all", "2022")Example 4: All Quarterly Revenue by Product for a range of years
Want to see how Apple’s iPhone, Mac, and iPad performed across all quarters of 2023-2024? Use this:
=SF("AAPL", "revSegProductQ", "period&date&iPhone&Mac&iPad", "2023-2024")Example 5: Custom Geographical Segment Selection for Quarter 2 YoY
Want only key regional segments, like Americas & Japan, quarterly over multiple years, and only for Quarter 2? Here’s how:
=SF("AAPL", "revSegGeoQ2", "period&date&Americas Segment&Japan Segment", "2023-2024")Conclusion
Revenue segment analysis is a game-changer for investors who want an edge. It tells you where the action is in a business, how trends shift, and which markets or products are driving value.
Key Takeaways:
- With SheetsFinance, you can pull up-to-date, company-reported revenue segment data into Google Sheets in seconds using intuitive functions.
- Analyze segment performance by region or product, annually or quarterly, for any US-listed company that reports segments.
- Effortlessly compare and visualize segment trends to spot growth engines, emerging risks, or strategic pivots, often before the market catches on!
🙋🏽♂️ Need Help? Get in touch with us anytime, either contact us via our website or hop onto our Discord server to chat to our community and support team. We’re here to help you make the most of SheetsFinance!
Happy analyzing! 🎉