Master Financial Calendars in Google Sheets: Track Earnings, Dividends, Splits & Economic Events Across All Major Global Markets
Imagine this: It's Sunday evening, and you're preparing for the week ahead. You need to know which of your portfolio companies are reporting earnings, when your dividend payments are coming, and what major economic events might move the markets. Without the right tools, you're juggling multiple websites, calendars, and spreadsheets just to stay informed.
With SheetsFinance's SF_CALENDAR() function, you can pull all this critical financial event data directly into Google Sheets, from earnings releases and dividend payments to economic indicators and treasury rates. Whether you're tracking a single stock or monitoring entire markets across 75+ global exchanges, this powerful function transforms your spreadsheet into a comprehensive financial command center.
What We'll Cover
In this comprehensive guide, you'll learn how to:
- Build dynamic earnings calendars to never miss a quarterly report
- Track dividend payments across your entire portfolio
- Monitor stock splits before they happen
- Create economic event dashboards for macro analysis
- Generate historical treasury rate curves for yield analysis
- Filter events by specific exchanges, markets, or symbols
- Combine multiple calendar types for holistic market views
- Handle the 90-day range limitation with smart workarounds
By the end of this post, you'll have the tools to create professional-grade financial calendars that keep you ahead of market-moving events.
Prerequisites & Getting Started
Before diving into financial calendars, let's ensure you're set up for success:
What You'll Need
- SheetsFinance Add-on: Make sure SheetsFinance is properly installed and linked to your Google account. If you haven't installed it yet, follow our step-by-step installation guide.
- Basic Google Sheets Knowledge: Familiarity with entering formulas and basic spreadsheet navigation will help you get the most out of this tutorial.
- Market Symbols: Know the exchange suffixes you'll be filtering by (e.g., ".NS" for NSE, ".DE" for XETRA). We'll show you how to find these, or leverage our Symbol Search tool.
Quick Setup Check
Let's verify everything is working with a simple test. In any empty cell, try entering:
=SF("AAPL")Essential Resources
Keep these handy as we work through the examples:
- SF_CALENDAR Documentation - Complete function reference
- Available Markets - List of 75+ global exchanges
- Function Generator - Automatic formula builder
- And again, our Symbol Search - Find ticker symbols easily
Now let's dive into building your first financial calendar!
Your First Earnings Calendar
Let's start by creating an earnings calendar for the next 30 days. This will show you which companies are reporting and when:
=SF_CALENDAR("", "earnings", TODAY(), TODAY()+30, "all")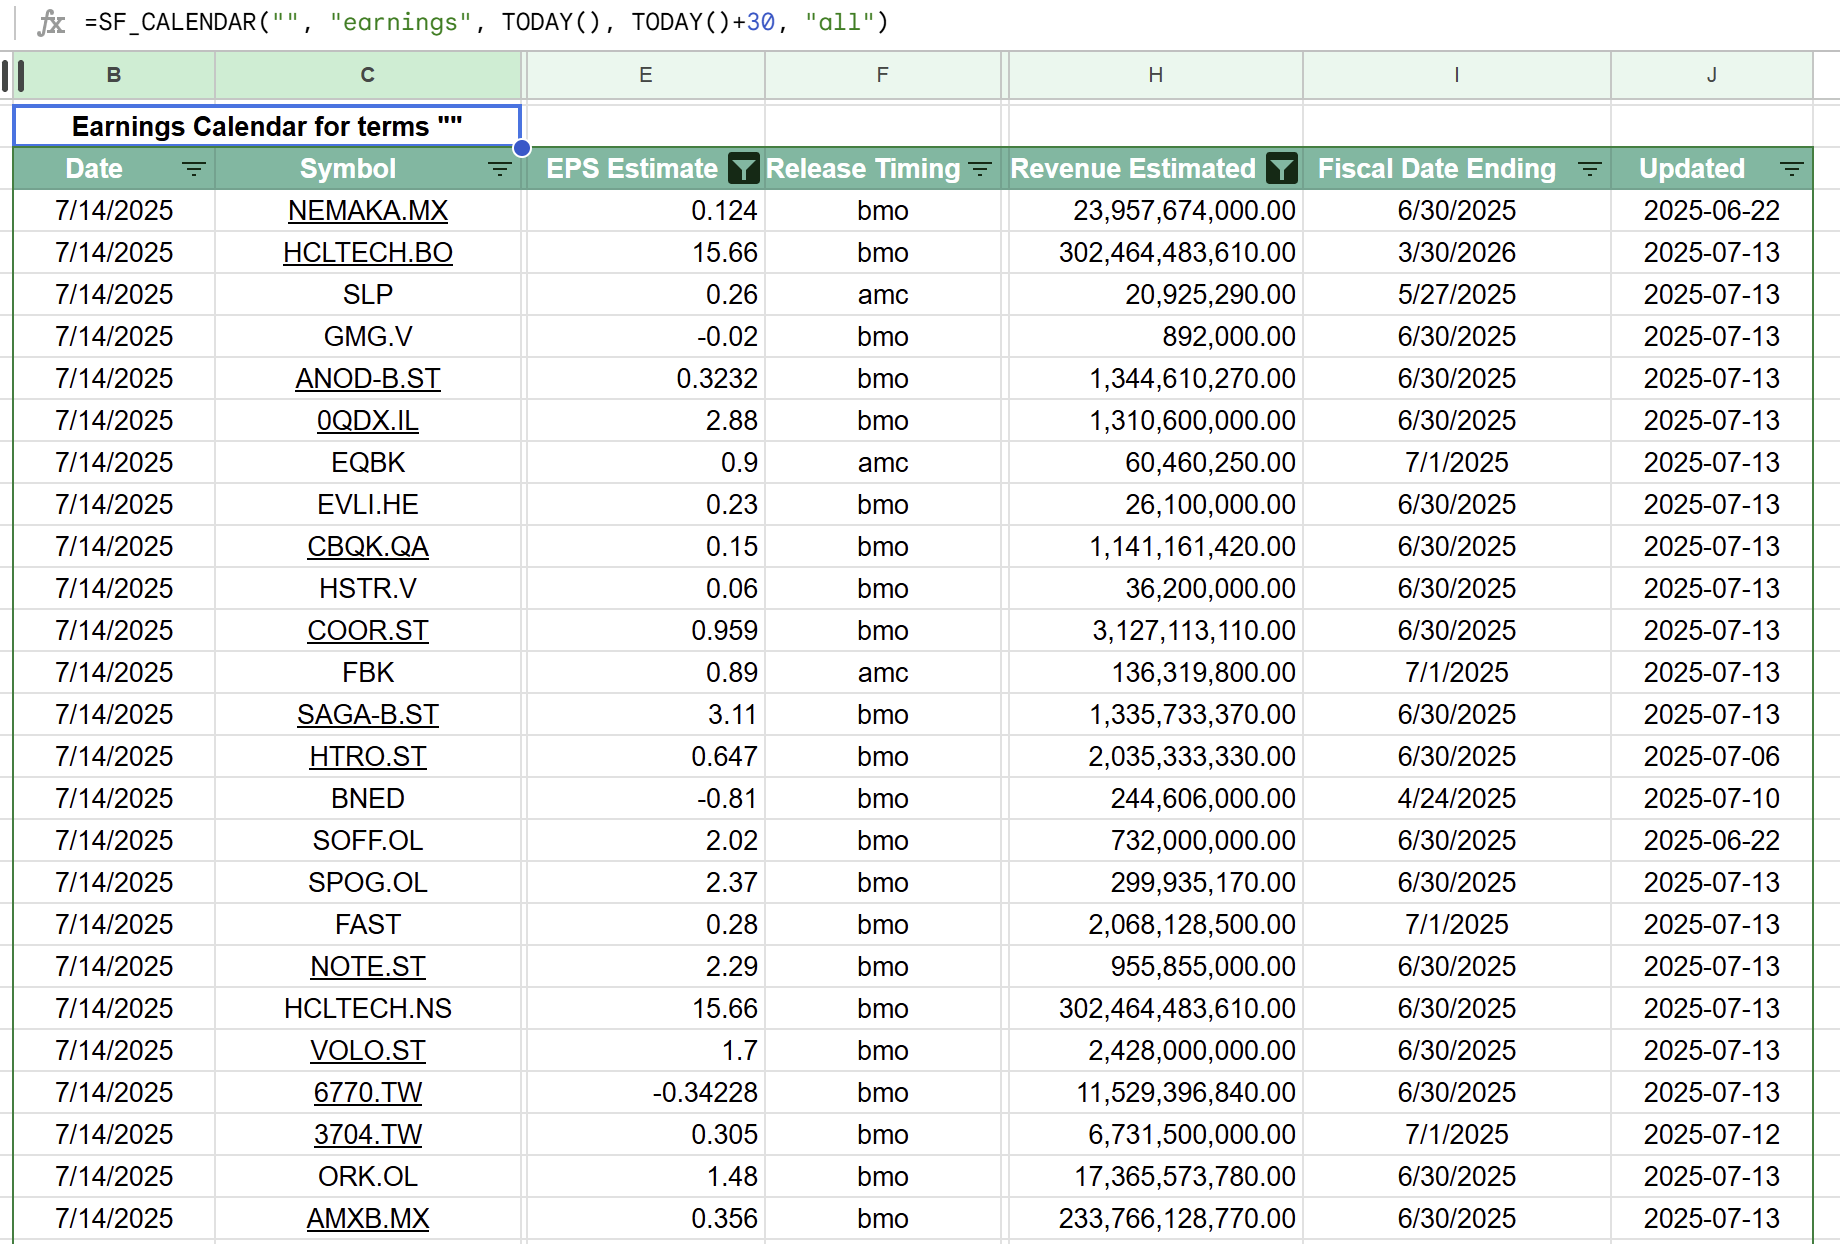
Just like that, you've created a comprehensive earnings calendar! The function returns:
- Date - When the earnings will be released
- Symbol - The stock ticker
- EPS - Actual earnings per share (if already reported)
- EPS Estimated - Analyst consensus estimates
- Time - Whether it's before market, after market, or during trading
- Revenue - Actual revenue (if reported)
- Revenue Estimated - Revenue expectations
- Fiscal Date Ending - The quarter/period being reported
- Updated - When the data was last updated
‼️ Important: Whilst we've included
TODAY()directly in our functions for simplicity, we strongly advise against this practise in general, as multiple calls toTODAY()can significantly slow down your spreadsheet's loading times. Instead use=TODAY()only once in your spreadsheet, e.g. in cellB1, then reference it everywhere you need, e.g.=SF_CALENDAR(".DE", "earnings", B1, B1+30, "all").
Filtering for Specific Markets/Exchanges
Now let's get more targeted. Say you want to track earnings only for German stocks on the Frankfurt Stock Exchange stocks:
=SF_CALENDAR(".DE", "earnings", TODAY(), TODAY()+30, "date&symbol&epsEstimated&time")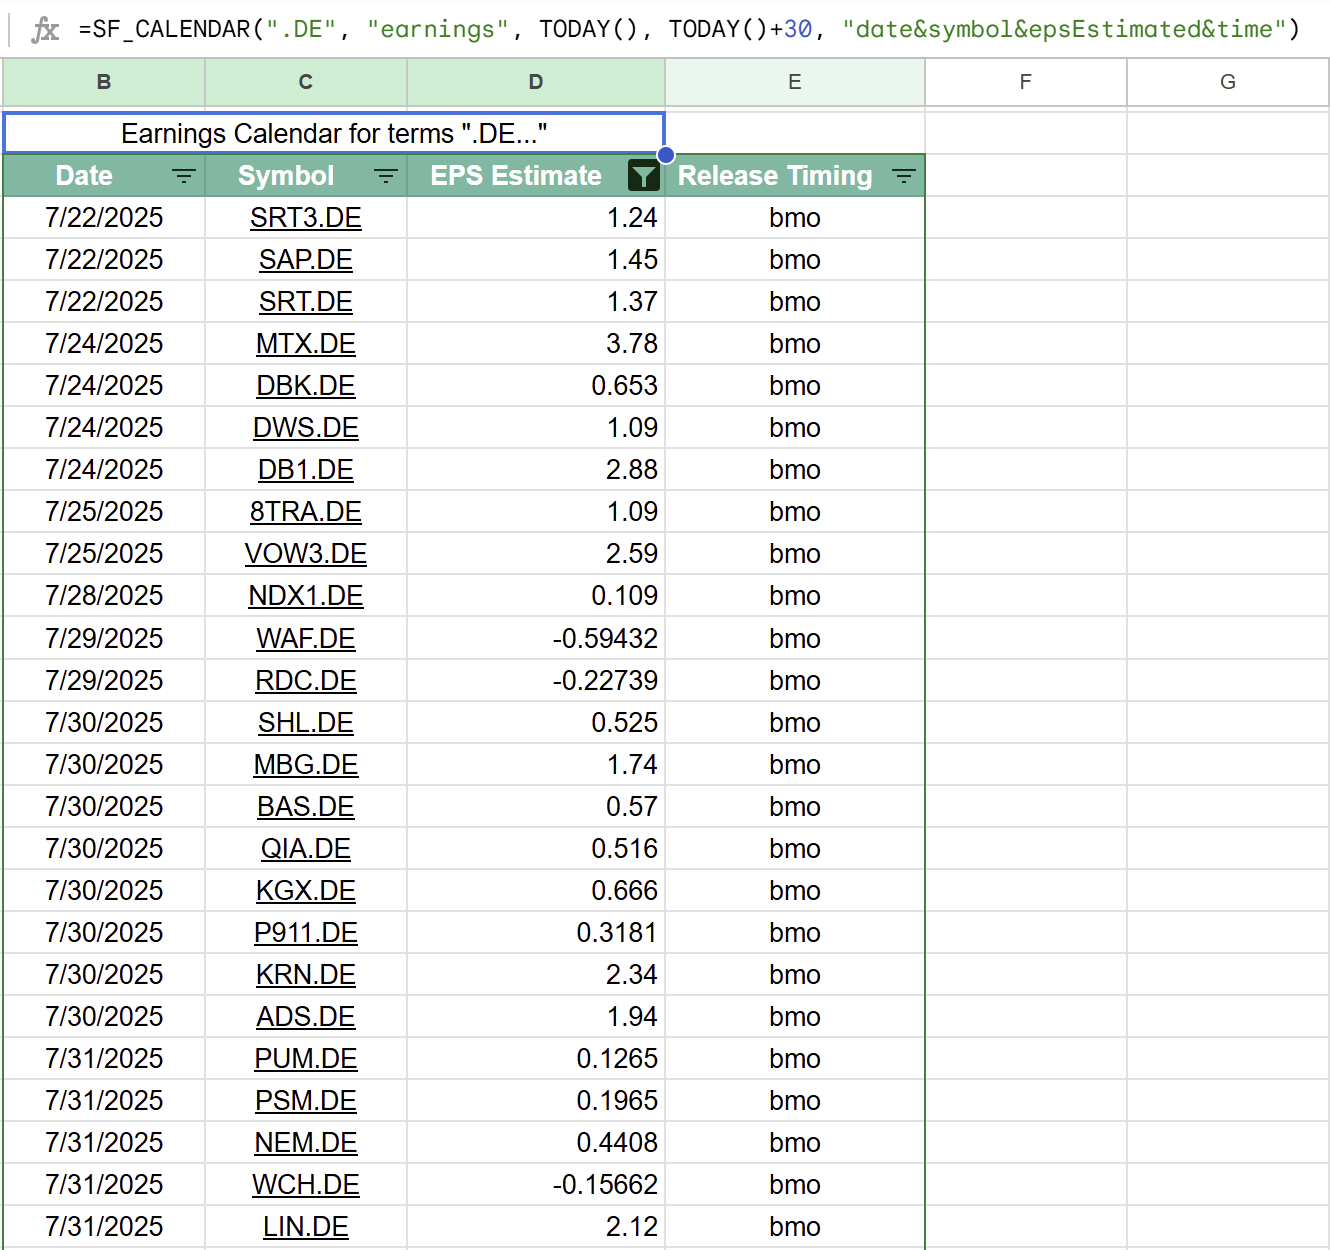
Notice how we:
- Used
".DE"to filter for just German-listed companies - Selected specific metrics using the
&operator - Created a cleaner view focused on what matters most
Tracking Multiple Exchanges
Want to monitor earnings across multiple markets? Chain them together:
=SF_CALENDAR(".NS&.DE", "earnings", TODAY(), TODAY()+14, "date&symbol&time&fiscalDateEnding")This tracks earnings for both NSE (India) and XETRA (Germany) listed companies, perfect for globally diversified portfolios!
🇺🇸 What about the US?: You can filter down to only US and OTC stocks using
".US".
Building a Dividend Calendar for Income Investors
For dividend investors, knowing payment dates is crucial. Let's create a comprehensive dividend calendar covering all available global markets on SheetsFinance (that's 80,000+ companies 😱):
=SF_CALENDAR("", "dividends", TODAY(), TODAY()+90, "all")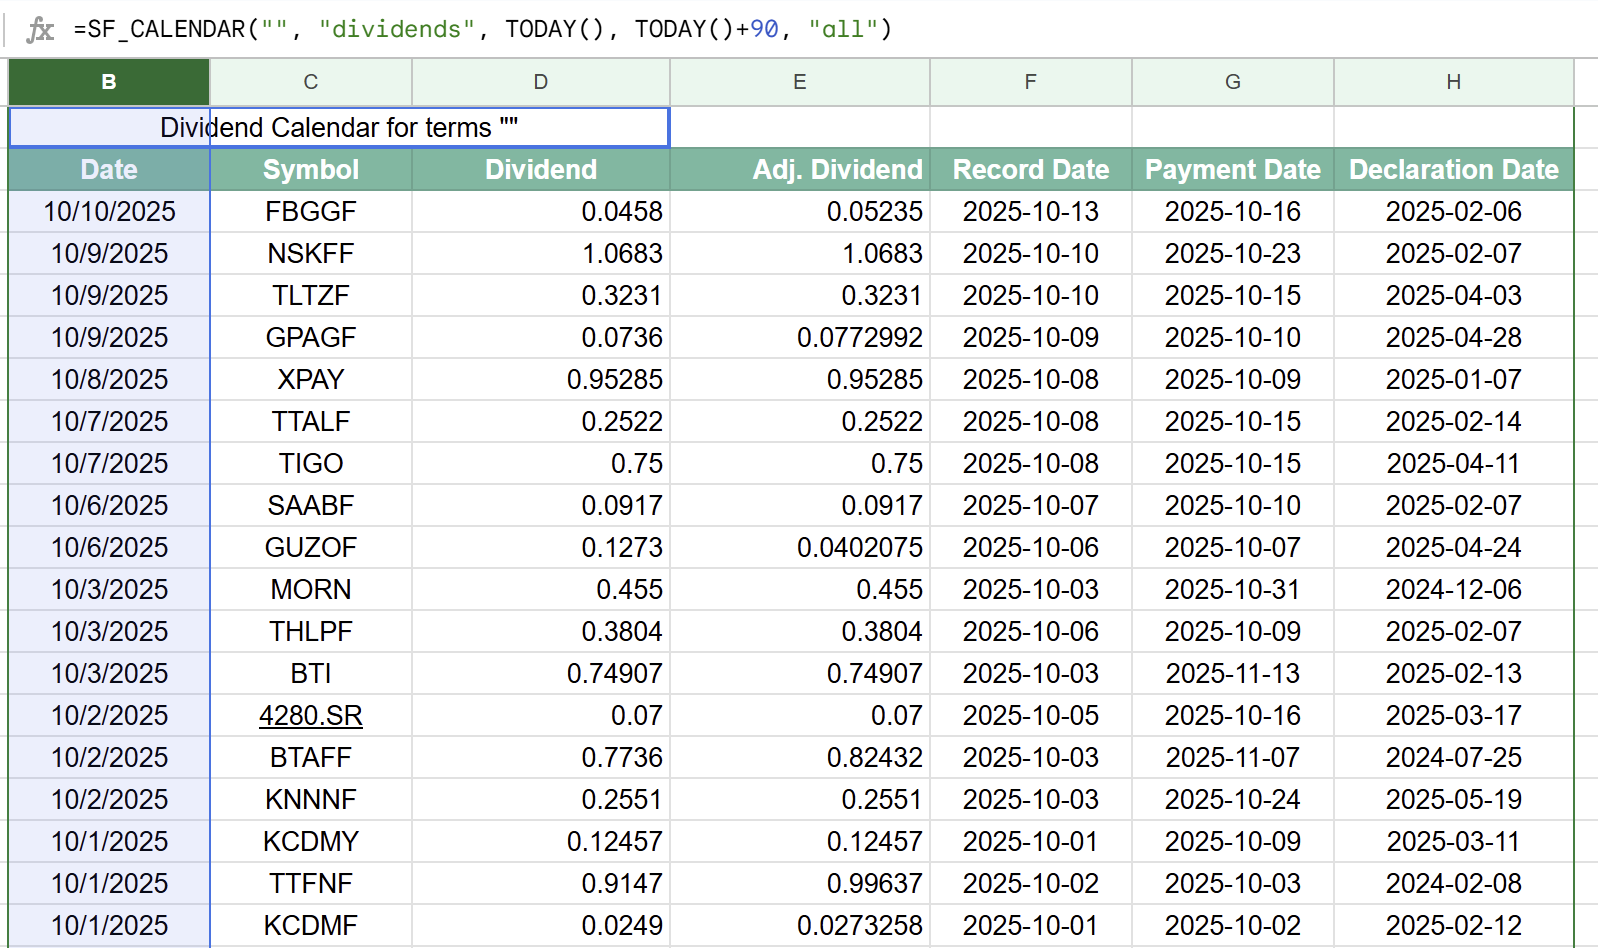
This gives you everything you need:
- Date - Ex-dividend date
- Symbol - The paying company
- Dividend - Payment amount per share
- Adjusted Dividend - Split-adjusted amount
- Record Date - Date you must own shares
- Payment Date - When you'll receive the payment
- Declaration Date - When it was announced
💡 Pro Tip: Use the adjusted dividend for accurate historical comparisons, as it accounts for stock splits and other corporate actions.
Building an Advanced Dividend Calendar - Selecting Specific Stocks
Now let's enhance our calendar to focus on our specific portfolio of stocks. Rather than just searching entire markets using the suffix notation (e.g. .DE), we can use the SF_CALENDAR function to filter by stock symbols directly but just entering the symbols we're after as the first parameter.
The only catch here is we include the 'exact match' operator ($) to ensure we're only getting dividends for the specified symbols. The reason is that the first argument works as a search filter, if we were to just enter AAPL then all variants of AAPL would be returned, e.g. AAPL.MX, AAPL.DE, etc. Instead, to ensure we only get the NASDAQ listed symbol AAPL we prefix it with a $ like so: $AAPL.
=SF_CALENDAR("$AAPL&$MSFT&$VZ", "dividends", TODAY(), TODAY()+90, "all")Now we'll only be returned the dividend calendar for Apple, Microsoft, and Verizon over the next 90 days.
If you want to see this in action you can download our ENTIRELY FREE Historical Dividend Calculator Template here.
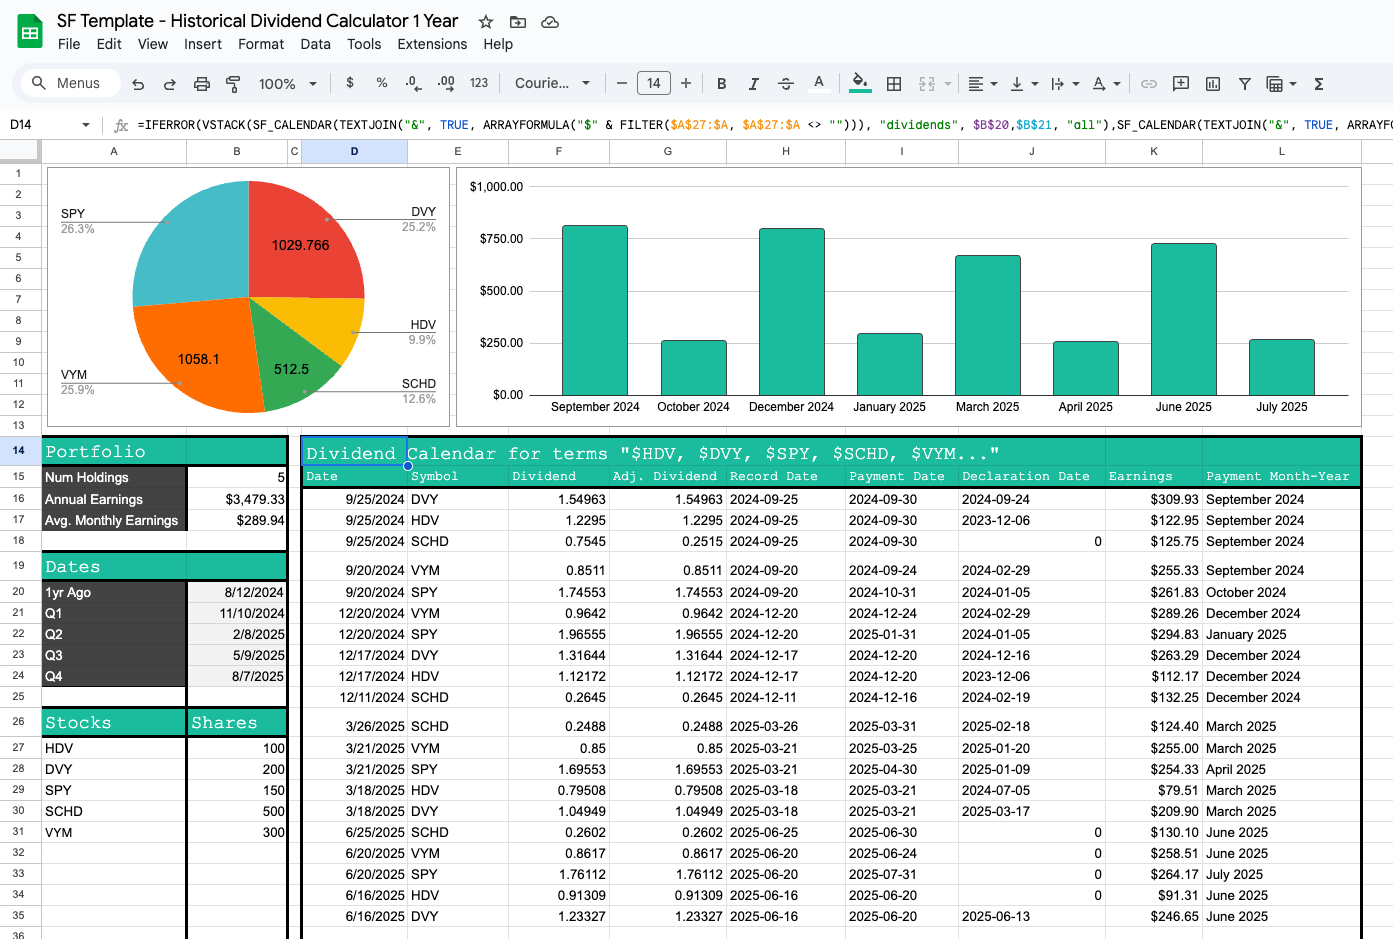
The template uses the dividend calendar function in a dynamic way to fetch the last year of dividends for your portfolio and chart the monthly dividend income. It's a fully interactive dashboard to visualize your annual dividend income.
Monitoring Stock Splits
Stock splits can significantly impact your holdings. Here's how to stay informed:
=SF_CALENDAR("", "splits", TODAY()-30, TODAY()+60, "all")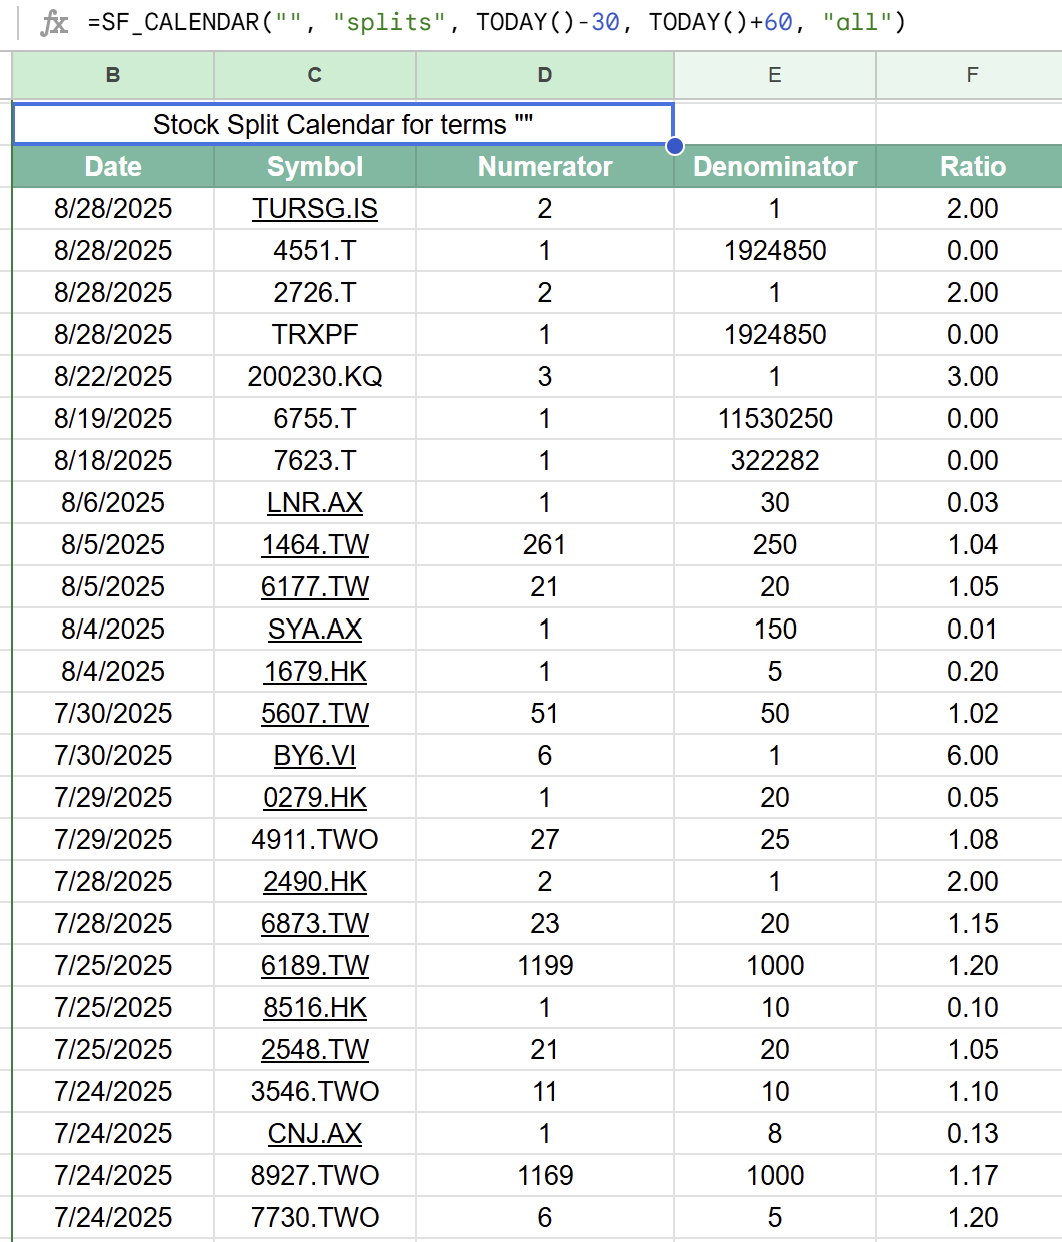
The splits calendar provides:
- Date - Effective split date
- Symbol - Company executing the split
- Numerator/Denominator - The split ratio components
- Ratio - Simplified split ratio (e.g., "2:1")
Economic Calendar: Track Market-Moving Events
For macro-focused traders, economic events are crucial. Let's build an economic calendar:
=SF_CALENDAR("US&UK&EU", "economic", TODAY(), TODAY()+7, "date&country&event&impact")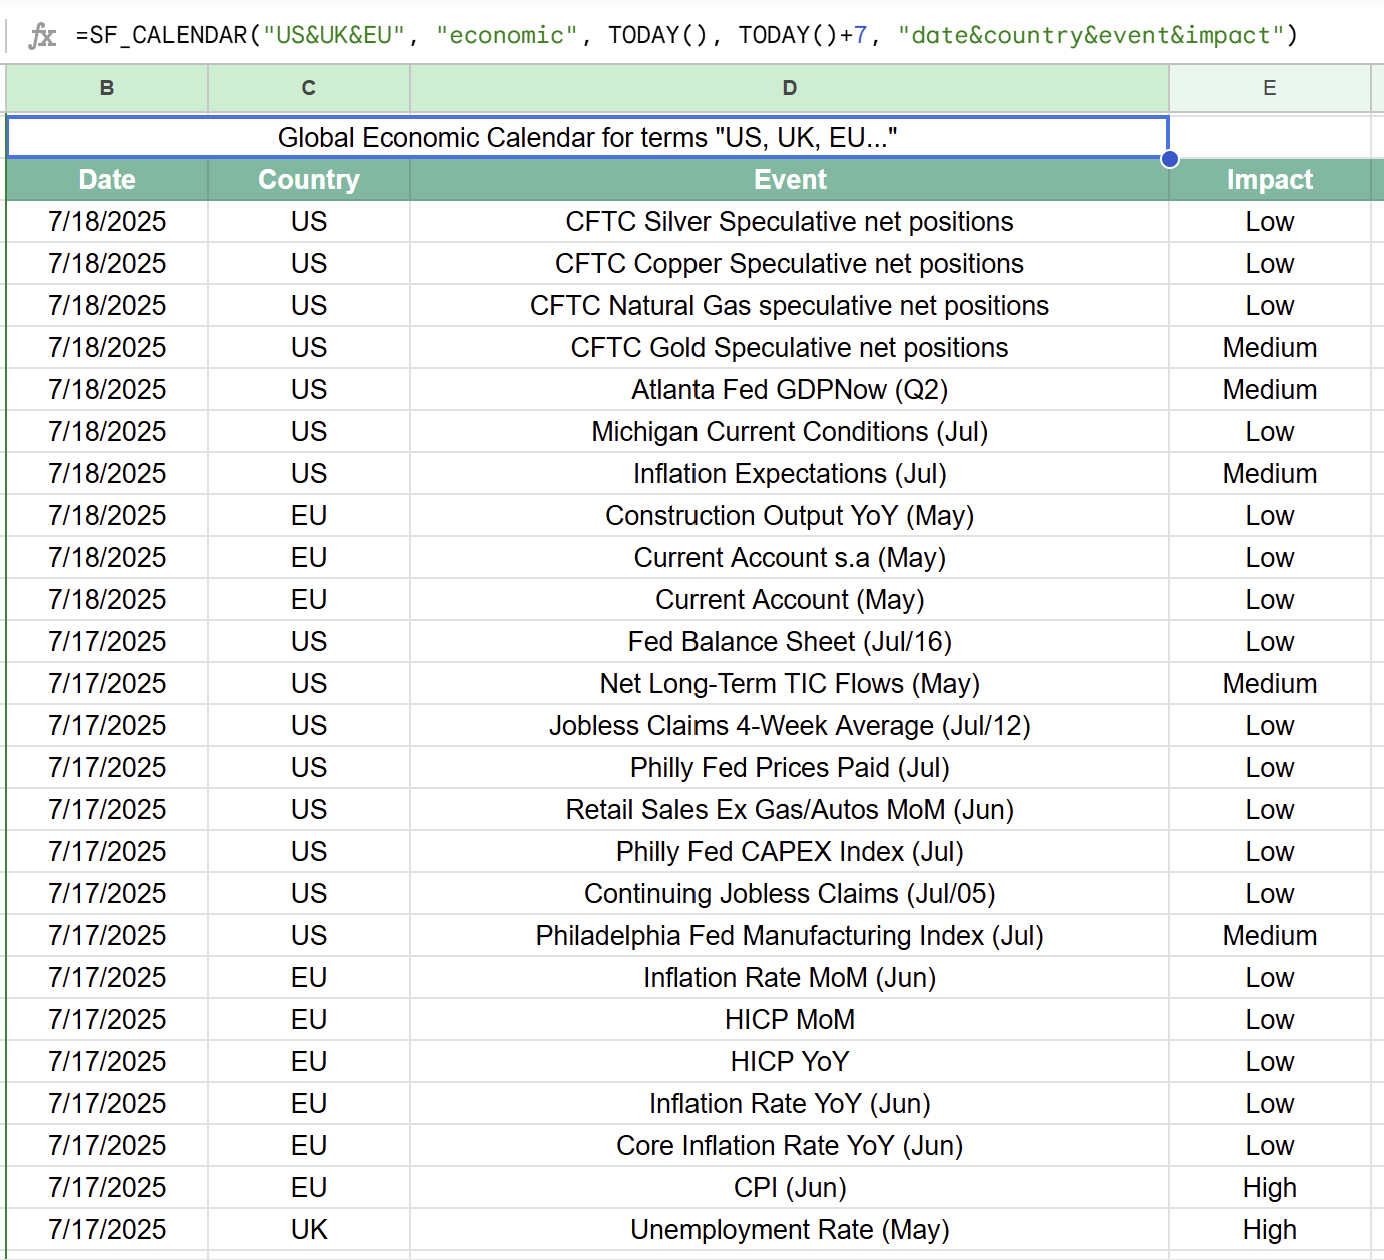
This tracks major economic releases across the US, UK, and EU, showing:
- Event - GDP, CPI, unemployment data, etc.
- Impact - How significantly it might move markets
- Previous/Estimate/Actual - For comparing expectations vs. reality
Treasury Rates: Building Yield Curves
The SF_CALENDAR function also provides access to US Treasury rates. Here's how to pull the current yield curve:
=SF_CALENDAR("", "treasury", TODAY()-30, TODAY(), "date&month3&year2&year10&year30")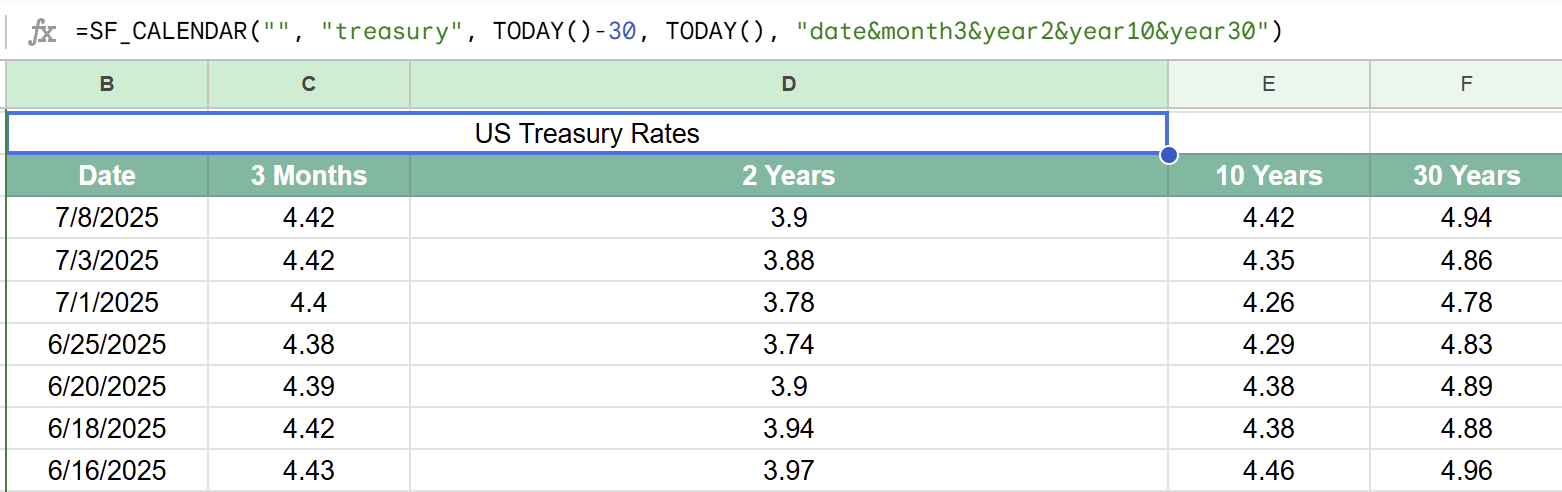
⚠️ Important: Notice the empty first parameter
""when pulling treasury data, this is required!
Analyzing Yield Curve Inversions
Track the 2-10 year spread to spot potential inversions:
=SF_CALENDAR("", "treasury", TODAY()-90, TODAY(), "date&year2&year10", "-")Then add a calculated column: =D2-C2 to see the spread over time.
Advanced Techniques: Combining Multiple Calendars
The Ultimate Weekly Planner
Create a comprehensive weekly market overview by combining different calendar types. Set up your sheet with:
Cell B1: Start date (e.g., =TODAY())
Cell B2: End date (e.g., =B1+7)
Then create sections for each calendar type:
Earnings This Week:
=SF_CALENDAR("", "earnings", B1, B2, "date&symbol&time&epsEstimated")Dividends This Week:
=SF_CALENDAR("", "dividends", B1, B2, "date&symbol÷nd&paymentDate")Economic Events This Week:
=SF_CALENDAR("US", "economic", B1, B2, "date&event&impact")Handling the 90-Day Limitation
The calendar function has a maximum 90-day range per call. For longer periods, use Google Sheets' VSTACK() function to dynamically and cleanly stack the output of each 90 day calendar.
First set a cell as today's date, say cell B1 has the function =TODAY() in it, then use the following:
=VSTACK(
SF_CALENDAR("", "dividends", B1, B1+90, "all"),
SF_CALENDAR("", "dividends", B1+91, B1+180, "all", "NH")
)
Note the "NH" (no header) option on the second call to avoid duplicate headers!
Mastering Search Techniques
The first argument of the SF_CALENDAR function is used for your search terms. Here's what you need to know:
- Leaving it blank (
"") will return all results for the specified calendar type. - Using the chaining operator (
&) allows you to combine multiple search terms. - Using the exact match operator (
$) lets you find specific symbols. - Search entire markets/exchanges using the suffix notation (e.g.,
".NS"for NSE,".DE"for XETRA).
Pro Tips for Maximum Efficiency
1. Use Dynamic Date References
Instead of hard-coding dates, use cell references:
=SF_CALENDAR("", "earnings", $B$1, $B$2, "all")2. Create Custom Views
Save different metric combinations for different use cases:
- Quick View:
"date&symbol&time" - Detailed Analysis:
"date&symbol&eps&epsEstimated&revenue&revenueEstimated" - Calendar Sync:
"date&symbol&time&fiscalDateEnding"
3. Leverage Conditional Formatting
Highlight important events:
- Earnings today: Red background
- High-impact economic events: Bold text
- Dividend payment dates: Green highlight
Real-World Applications
Portfolio Earnings Dashboard
Create a dynamic earnings tracker for your holdings:
- List your symbols in column A
- Use this formula to find upcoming earnings:
=FILTER(
SF_CALENDAR("", "earnings", TODAY(), TODAY()+10, "all"),
LEN(SF_CALENDAR("", "earnings", TODAY(), TODAY()+10, "symbol"))>0
)
Function Generator: Build Complex Formulas Easily
Don't want to memorize all the parameters? SheetsFinance includes a Function Generator that builds formulas automatically.
Simply select:
- Function type: Calendar
- Calendar type: Earnings/Dividends/Splits/Economic/Treasury
- Date range and metrics
- Click "Generate" for a perfect formula!
Common Patterns and Solutions
Market-Specific Calendars
Track events for specific exchanges using their suffixes:
- NYSE:
".US" - NASDAQ:
".US" - NSE (India):
".NS" - XETRA (Germany):
".DE" - ASX (Australia):
".AX"
Combining with Other SheetsFinance Functions
Enhance your calendars with real-time data:
=ARRAYFORMULA(IF(B2:B<>"",
VLOOKUP(B2:B, {SF(B2:B, "realTime", "symbol"), SF(B2:B, "realTime", "price")}, 2, FALSE),
""
))
This adds current prices next to your calendar symbols!
Conclusion
The SF_CALENDAR function transforms Google Sheets into a powerful financial event tracking system. From earnings releases that move individual stocks to economic indicators that shift entire markets, you now have the tools to stay informed and prepared.
Whether you're an active trader needing minute-by-minute awareness or a long-term investor tracking dividend payments, these calendars adapt to your investment style. The ability to filter across 75+ global markets, combine multiple calendar types, and integrate with other SheetsFinance functions creates endless possibilities for financial analysis.
Start with a simple earnings calendar for your portfolio, then expand to track dividends, economic events, and treasury rates. Before long, you'll have built a comprehensive financial dashboard that rivals professional platforms, all within the familiar Google Sheets environment.
Ready to never miss another market-moving event? Install SheetsFinance today and start building your personalized financial calendar system.
For detailed documentation and more examples, visit the SF_CALENDAR documentation page. Have questions? Join our Discord community or contact our support team.
Happy tracking!