Accessing Real-time Insider Trading Data in Google Sheets
Insider Trading in the US has been a hot topic for quite some time now, with the SEC (Securities and Exchange Commission) keeping a close eye on any suspicious activity. That being said, it is perfectly legal for key company stakeholders ("insider") to trade their own shareholding as long as each transaction is disclosed. Having access to this information can prove to be a crucial item in your investment research, and help you understand how the these important company figures are behaving. Let's have a look at how you get leverage this in Google Sheets with SheetFinance's insiders data type, which returns the insider trading transaction for the specified company.
Getting Started with SheetsFinance
- Make sure SheetsFinance is properly installed and linked to your google account, if not, you can find how to do so here.
- Check out the following documentation page for reference.
- Check out our recent Insider Data Youtube Video for even more!
Displaying the latest Insider Information
Let's dive straight into it, here's a super simple formula to get the latest insider trading transactions for Apple Inc. (AAPL):
=SF("AAPL", "insiders","all")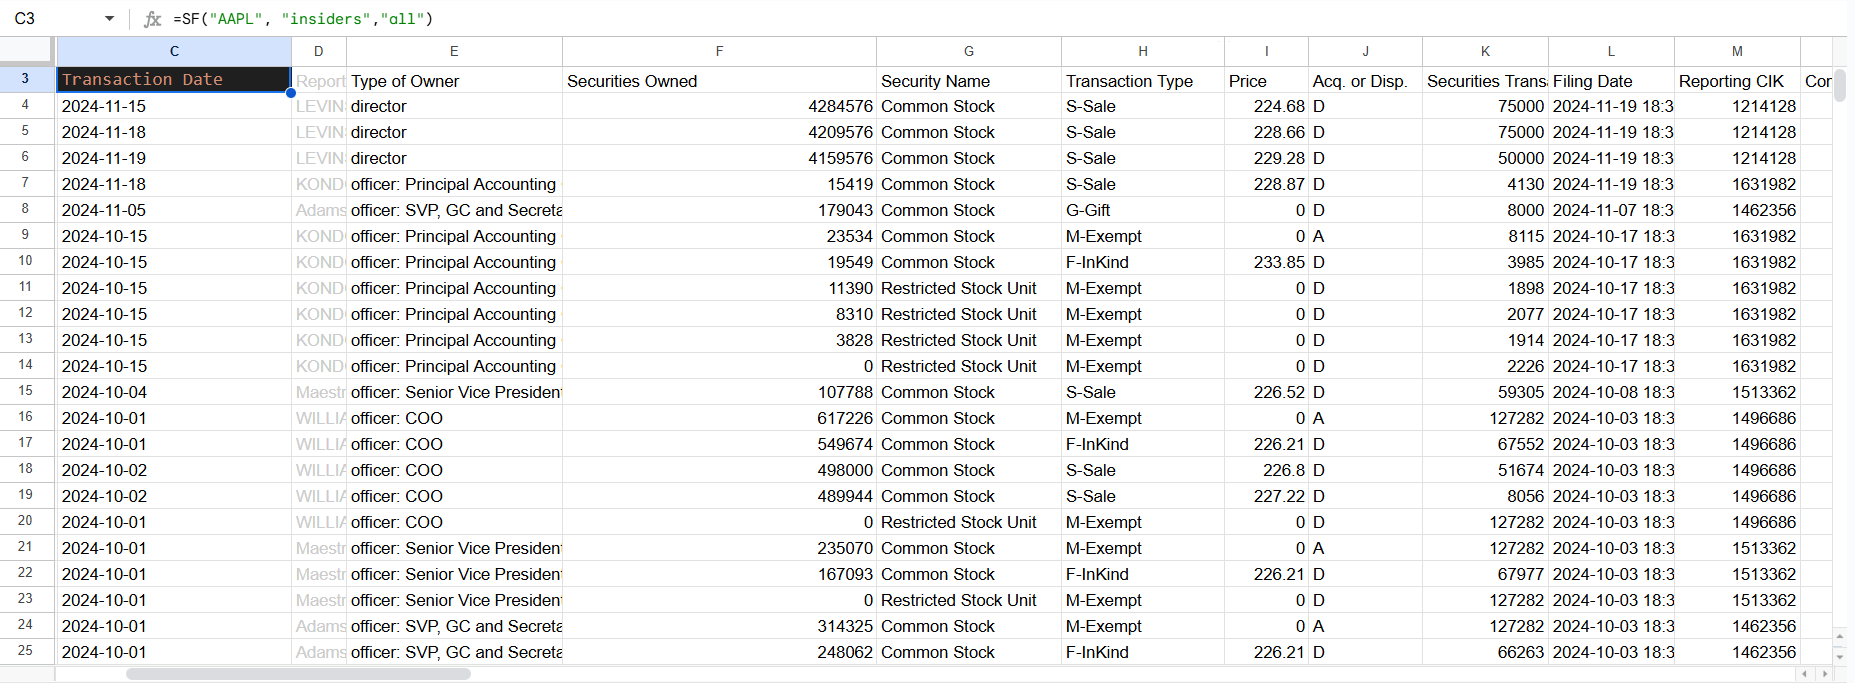
Wow! In seconds, we've been able to load up all the insider trading transactions for Apple Inc. (AAPL) for the last year. From left to right, we find well organized columns of data with:
- Date - The date of the transaction
- Reporting Name - The name of the insider who made the transaction
- Type of Owner - The relationship and/or position the insider holds within the company
- Securities Owned - The number of shares currently owned by the insider
- Security Name - The name/type of the security being traded (e.g. common, preferred or restricted stock)
- Transaction Type - The SEC classification of the transaction type (e.g. A-Award, S-Sale, P-Purchase)
- Price - The price at which the transaction was made
- Acq. or Disp. - Whether the insider acquired or disposed of the security
- Securities Transacted - The number of securities transacted
- Filing Date - The date the transaction was filed with the SEC
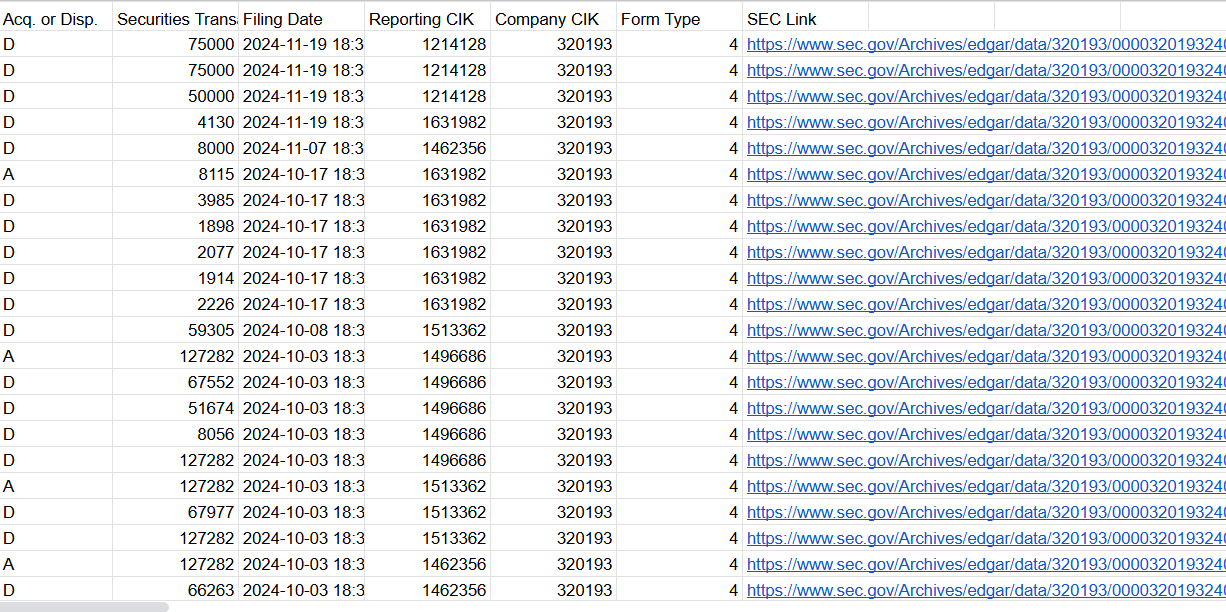
- Reporting CIK - The CIK code of the insider
- Company CIK - The CIK code of the company
- Form Type - The type of form filed with the SEC
- SEC Link - A direct link to the SEC's filing on the EDGAR database
Regarding the type of transaction, SheetsFinance breaks down this information into the 6 main categories:
Afor a stockaward, i.e. a grant of shares of stock from the company,Mforexempttransactions, i.e. transactions that are not required to be reported to the SEC,Sforsale, where the insider offloads shares,FforinKindtransactions, i.e. transactions that are not for cash, andGforgifttransactions, i.e. transactions that are gifts of shares.Pforpurchase, where the insider buys shares.
📝 The More You Know: SF's Insider data comes as reported by the SEC and includes all the detail required to understand how insiders are trading the stock. This data is currently only available for US companies, as of late 2024!
The column on the right of the transaction type highlighting the price at which the transaction was made reflects a value of 0 for transactions such as gifts, exempt or awards, but will show the actual price for transactions sales, purchases and in-kind transactions.
The data includes all the necessary information to understand the transaction, such as the number of securities transacted, the price at which the transaction was made, and whether the insider acquired or disposed of the security.
Further to data that covers the specifics of the transaction itself, there's more general data such as two CIK codes, one for the insider and one for the company, which can be used to cross-reference the data with the SEC's database. SheetsFinance also includes the form type, and the direct link to the SEC's filing on the EDGAR database, to enable you to dig deeper into the transaction.
Like with all our functions at SheetsFinance you can modify what data you want displayed by changing the metrics parameter. In the above example we're displaying "all", or "all metrics". This can often be too much. If you're only interested in the Date, Reporting Name, Transaction Type, Price, and Securities Transacted, you can modify the function to look like this:
=SF("AAPL", "insiders", "date&reportingName&transactionType&price&securitiesTransacted")Use the year argument to filter down the data to a specific year or range of years. It's important to note that as of late 2024 the insiders function is limited to the last 400 transactions. Entering a range of years is simple, check this out:
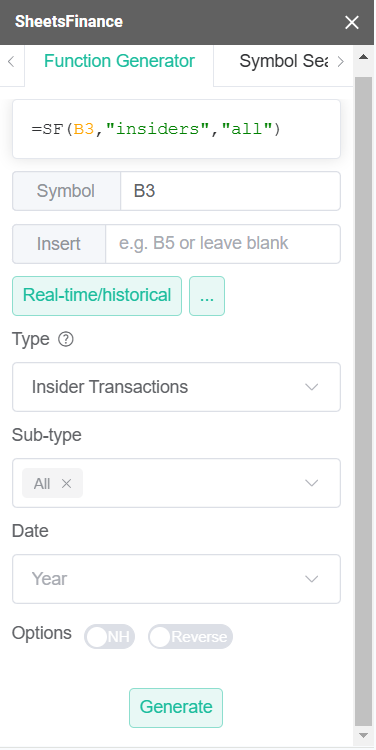
=SF("AAPL", "insiders", "all", "2023-2024")This is a great moment to remind you about our handy Function Generator which is entirely free to use and builds all your SheetsFinance functions for you automatically. Use the Function Generator to explore all our available functions and to help you understand the different parameters available for each. You can open the Function Generator from the dropdown menu in Google Sheets (Extensions > Sheets Finance > Function Generator).
To created the insiders function using the Function Generator select Real-time / Historical to bring up the main =SF() function and then select the Insider Transaction metric type. Now you can freely input the parameters of interest to build the function and filter-down the data to your liking.
💡 Quick Tip: You can directly reference multiple cells with the
=SF()function, rather than hard-coding the ticker symbol (e.g. enterA1rather than"AAPL"). This can give you greater flexibility when changing the company to be analyzed.
Fetching the latest Insider Statistics
Often 100s of transactions can be overwhelming, and you might just want to get a quick overview of the insider trading activity for a specific company. That is why we also provide a summarising function, namely insiderStatistics, which provides a summary of the insider trading activity for a specific company on a quarterly basis, here's an example:
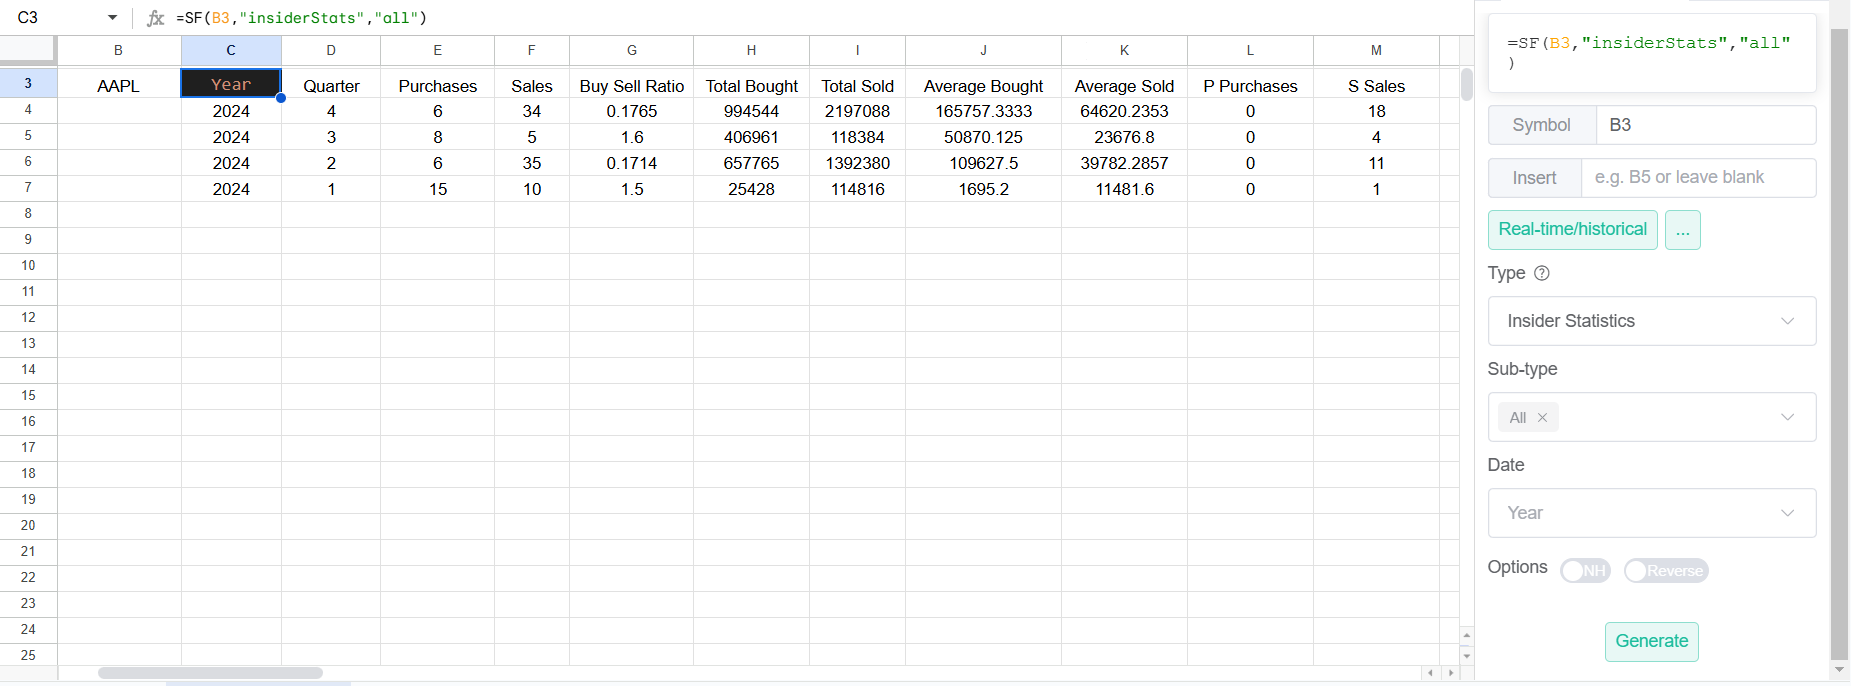
=SF("AAPL", "insiderStats","all")Feel free to generate the same line using the Function Generator, and input the required parameters to filter down the data to your liking. Simple change the Type from Insider Transaction to Insider Statistics and you're good to go!
The Insider Statistics function enables you to gain insight on the direction of insider trading, e.g. have insiders for AAPL in the last quarter of 2024 been more bullish (with greater purchases) or bearish (with greater sales)? This can be an excellent way to understand the sentiment of the insiders, and can be a great addition to your investment research.
Whilst our insiders function is limited to the last 400 transactions, the insiderStatistics function covers 20+ years of quarterly data neatly summarised. You can adjust the number of quarters you're after by adjusting the year argument. For example, entering "2023-2024" will return 8 quarters covering the years 2023 and 2024, the function would be as follows:
=SF("AAPL", "insiderStats","all", "2023-2024")Let's take a closer look at the recent 4 quarters for AAPL. In the case of Q4 2024, we find the following:

We can see from this data that there was significantly more trading activity in Q4 2024 (shown by 40 total transactions versus only 13 in Q3), with an explosion of selling positions from 5 to 34, or as the BUY / SELL ratio indicates, 1.6 in Q3 2024 versus 0.1765 in Q4 2024. What does this mean? Well perhaps insiders were more bearish on the stock in Q4 2024, or perhaps they were just taking profits after a strong run in the stock price. This is where your own analysis comes in!
Symbol Search
If you aren’t sure what ticker to use for a certain company, either use the Symbol Search tool within Google Sheets (Extensions > Sheets Finance > Symbol Search), or visit the SF Symbol Search page.
You can also use the SF_MAP function to translate any ISIN, CUSIP or CIK code into the correct ticker used at SheetsFinance, for more information, kindly look through this documentation page.
Conclusion
Insider trading data can be a powerful tool in your investment research, and with SheetsFinance you can easily access this data in Google Sheets. By using the insiders function you can get a detailed view of the insider trading transactions for a specific US company, and by using the insiderStatistics function you can get a summarised view of the insider trading activity for a specific US company on a quarterly basis stretching back over 20 years. Both functions are outlined in detail with examples on their respective documentation pages, check out the insiders documentation page and the insider statistics documentation page for more information.
As always, if you have any questions, you can reach out to us directly on Discord or from our contact page.
Happy spreadsheeting!