How to Get Options Data in Google Sheets and Excel: Full Chains, Greeks, IV Rank, Volatility Surfaces, and 20+ Years of History
If you trade options, research volatility, or build systematic strategies, you already know the problem: good options data is hard to work with outside of expensive terminals, fragmented APIs, or clunky downloads.
With the SheetsFinance Options, you can pull full options chains, Greeks, implied volatility analytics, volatility surfaces, earnings-derived options metrics, and 20+ years of historical options data directly into Google Sheets and Microsoft Excel using a single function: SF_OPTIONS_PRO().
That means you can go from idea to live spreadsheet workflow in minutes, whether you are screening for elevated IV, analysing a specific contract, backtesting historical chains, or comparing earnings moves to the options market's implied expectations.
Start a 15-day free trial of the SheetsFinance Options (no payment details required) to follow along with the examples in this post and explore the full dataset in your spreadsheet.
What We'll Cover
In this guide, you'll learn how to:
- Pull full options chains with Greeks and IV into Google Sheets and Excel
- Access historical options chains and expired contracts for backtesting
- Track a single contract or strike over time
- Analyse IV rank and batch IV rank across a watchlist
- Work with volatility term structure and surface data
- Compare historical earnings moves to options-implied moves
- Use one consistent spreadsheet function across multiple advanced options workflows
By the end of this post, you'll see how to turn Google Sheets or Excel into a serious options research environment without relying on manual exports or custom code.
Why Options Analysis in Spreadsheets Usually Breaks Down
Most spreadsheet-based options workflows fail for one of three reasons:
- The data isn't dynamic, you're stuck with static downloads or manual exports, copying and pasting from a terminal
- The data is too shallow and only covers current chains
- Historical options data is incomplete or missing expired contracts
- Advanced analytics like IV rank, volatility surfaces, and earnings effect require separate tools
That is exactly what the SheetsFinance Options is built to solve. SheetsFinance Options gives you:
Note: Current OPRA chain data is provided on a 15-minute delay.
Meet SF_OPTIONS_PRO(): Your All-in-One Options Data Function
At the center of the SheetsFinance Options is one function:
=SF_OPTIONS_PRO(symbol, dataType, expirationDate, strike, tradeDate, endDate, metrics, options)This single function can return:
- Full calls, puts, or combined chains
- Expiration dates
- Historical chain snapshots
- Contract and strike time-series
- IV periods and term structure metrics
- IV rank snapshots and watchlist batches
- Volatility surfaces and surface forecasts
- Earnings-related options analytics
If you are used to jumping between multiple tools for each of those jobs, this is a much cleaner workflow.
And don't forget you can use our in-built Function Generator in both Google Sheets and Excel to build these formulas without needing to remember all the arguments or syntax. Just select the function, fill in the fields, select the data you want back and we'll generate the formula for you.
1. Pull Full Options Chains with Greeks
Let's start with the core use case: loading a full chain for an underlying directly into your spreadsheet for the next available expiration.
=SF_OPTIONS_PRO("AAPL", "calls&puts")Here we're entering only the first two arguments: symbol and dataType. By leaving expirationDate blank we're asking for the next available expiration.
We haven't specificed the data we want back (using the metrics argument), so the function will return all available fields for the chain, which includes:
- Contract symbol
- Strike
- Bid and ask
- Mid price
- Volume
- Open interest
- Implied volatility
- Delta, gamma, theta, vega, rho
- And a lot more...
If we now want to specify a particular expiration we might first want a list of the available expirations for the symbol. We can get that with the dataType argument:
=SF_OPTIONS_PRO("AAPL", "expirationsDates")This will return all currently available expirations dates for AAPL which we can use to explore the chain.
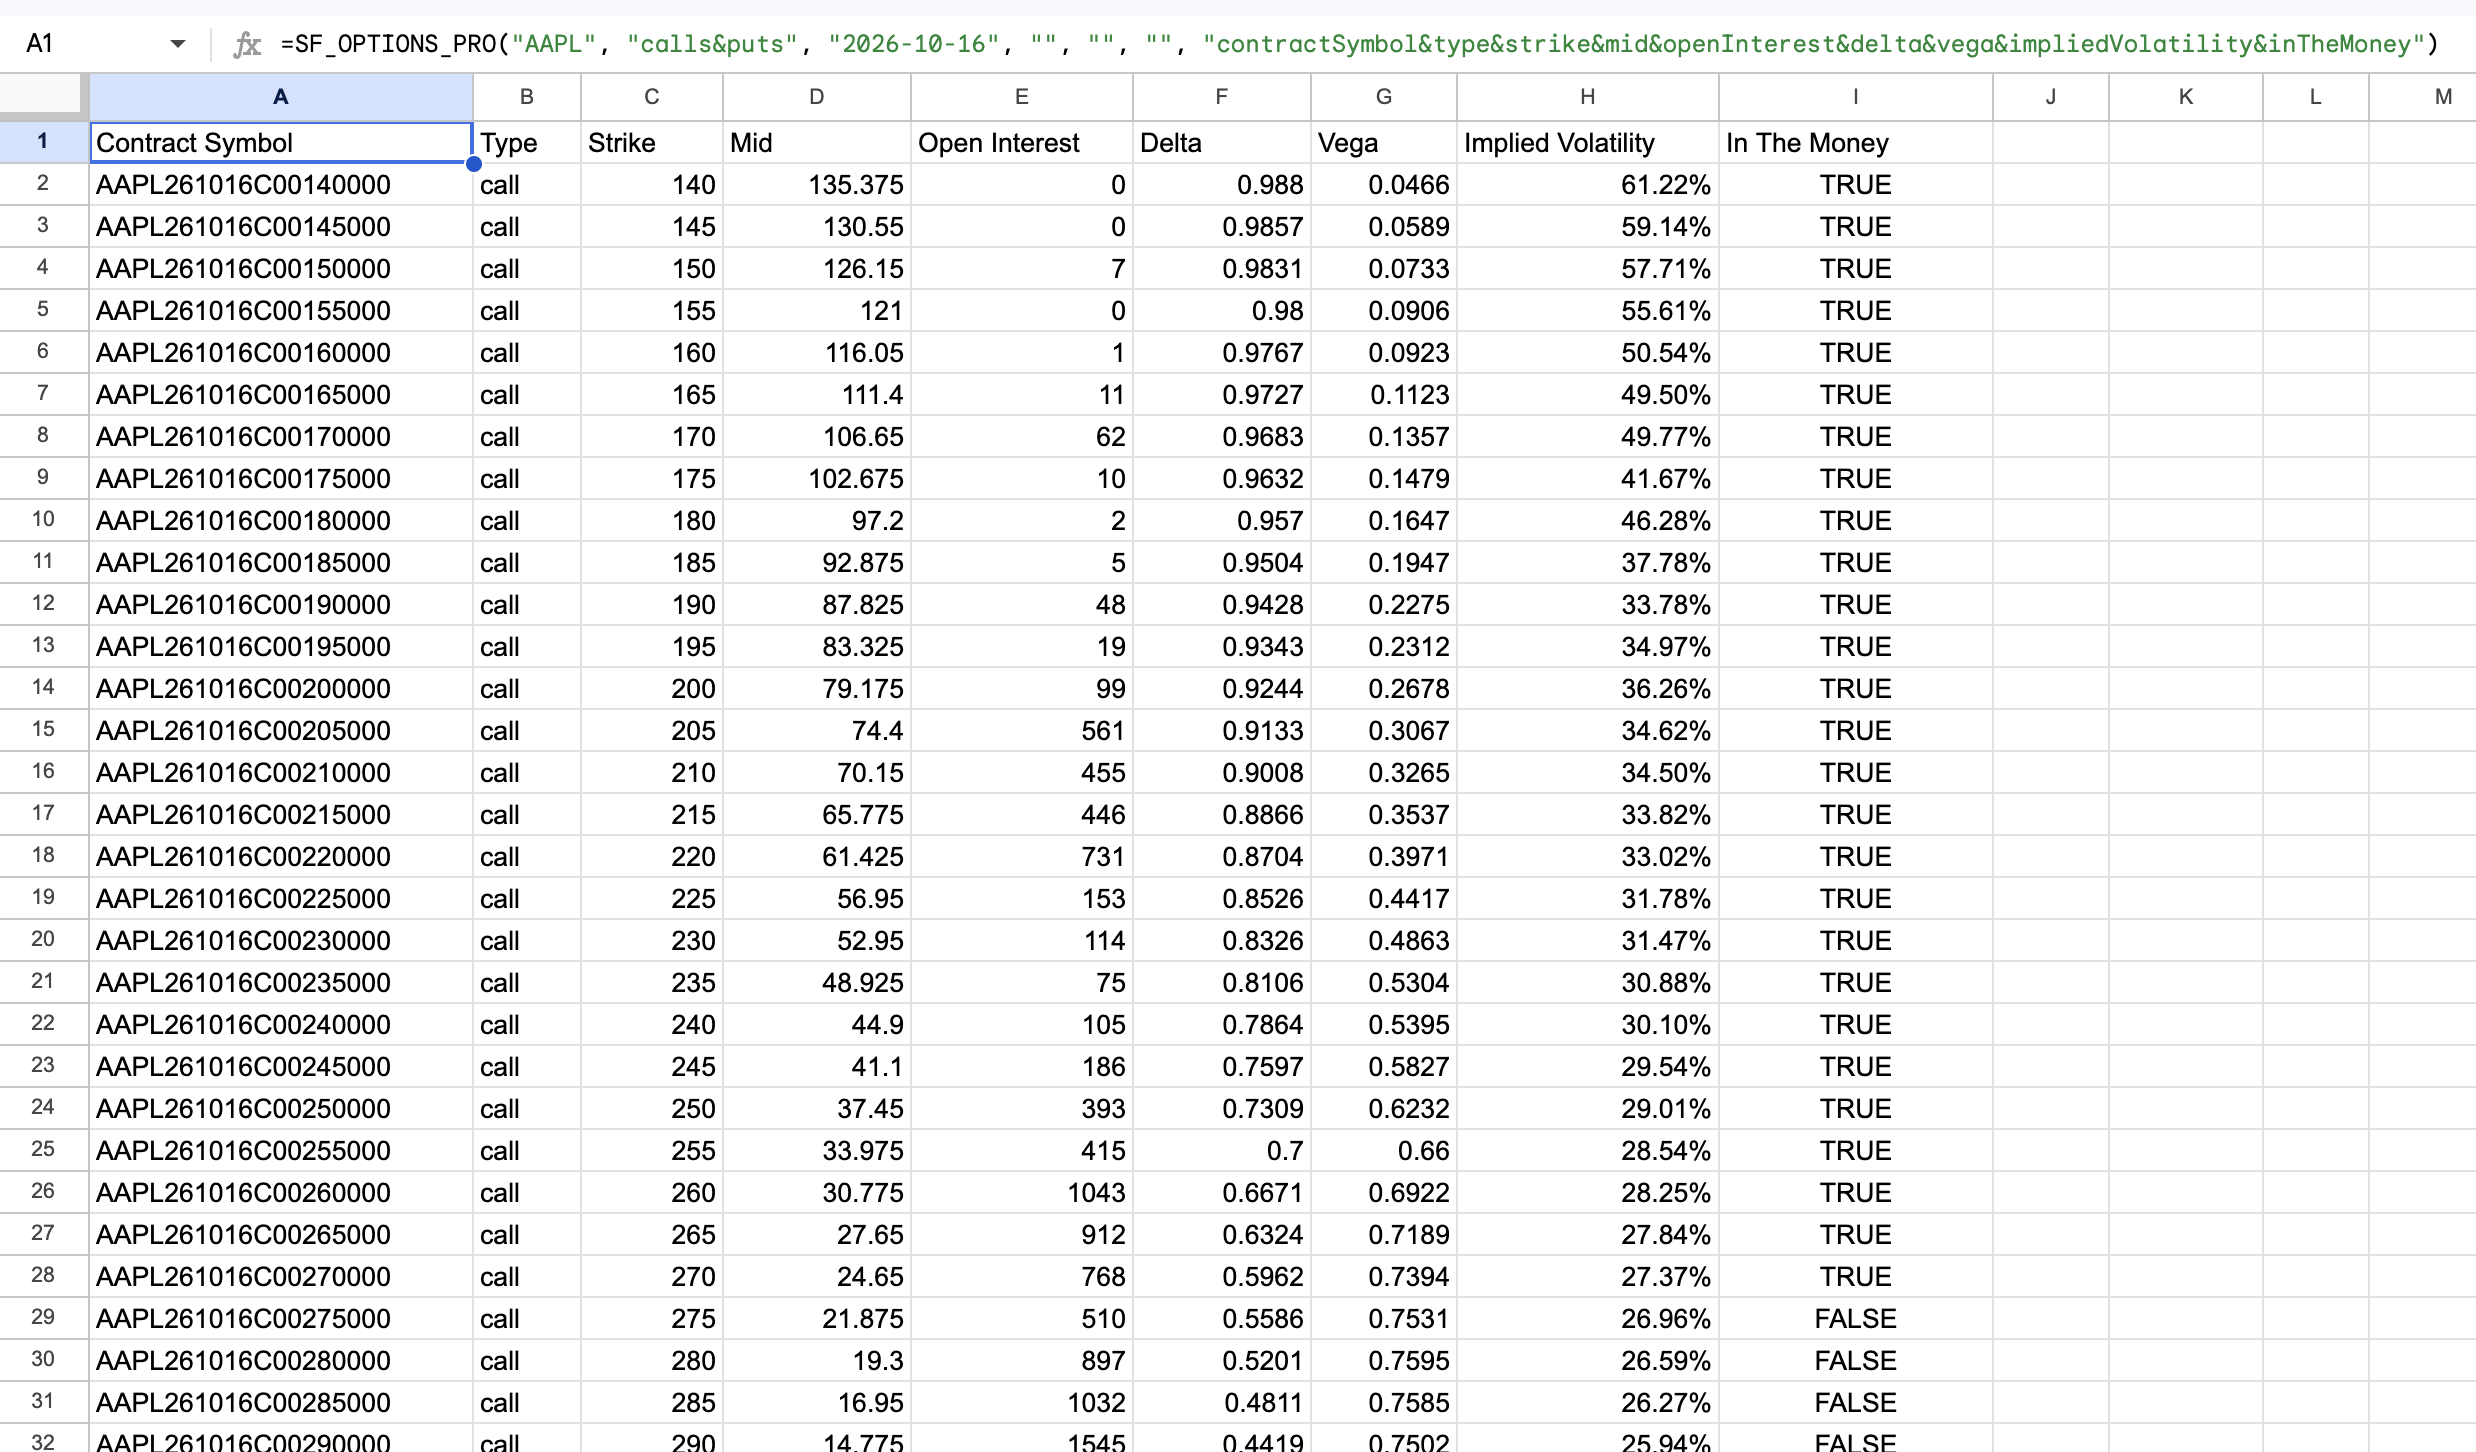
Let's now use the third argument, expirationDate, to specify an expiration, and while we're at it let's trim down the fields to just the essentials (using the seventh argument metrics) for a quick chain overview:
=SF_OPTIONS_PRO("AAPL", "calls&puts", "2026-10-16", "", "", "", "contractSymbol&type&strike&mid&openInterest&delta&vega&impliedVolatility&inTheMoney")💡 Pro tip: Don't worry about getting
expirationDateexact, the function will automatically return the next expiration date after any date entered. This lets you explore a particular future period without hitting errors.
This is ideal for traders building:
- Options chain dashboards
- Strike-by-strike valuation views
- Delta and vega comparison tables
- Near-the-money scanning workflows
If you know know the exact contract you're after then you can just replace the first argument with the contract symbol to pull that contract's data directly:
=SF_OPTIONS_PRO("AAPL260618C00260000")This is exactly the same as specifying the first four arguments: symbol, dataType, expirationDate, and strike:
=SF_OPTIONS_PRO("AAPL", "calls", "2026-06-18", 260)Entering contract symbols directly is particularly handy if you're working directly off a contract list or you're managing real positions and you want to pull specific strikes without loading the full chain.
So to summarise this first section, we've covered everything needed to pull current chain and contract data, which happen to be the first four arguments of the function:
symbol- the underlying symbol or a specific contract symbol.dataType- the type of data you want (calls, puts, calls&puts, expirations, ivRank, ivPeriods, surface, earnings, etc) - we'll cover more data types in the next sections.expirationDate- the expiration date for chain data, or leave blank to pull the next available expiration.strike- the strike price for a specific contract, or leave blank to pull all strikes in the chain.
Read more in the docs: Chains & Contracts
2. Access Historical Options Chains for Backtesting
This is where things become especially powerful.
The SheetsFinance Options includes 20+ years of historical options data, including expired contracts, so you can inspect what a chain actually looked like on a past date instead of relying on approximations.
This is where the fifth argument, tradeDate, comes in. If you set tradeDate to a past date, you can pull a historical snapshot of the chain as it stood on that date:
=SF_OPTIONS_PRO("AAPL", "calls&puts", "2026-10-16", "", "2026-04-01")Or for a more compact historical view let's define the fields we want back with the metrics argument and include "range=ntm" as our options argument to pull only the near-the-money strikes:
=SF_OPTIONS_PRO("AAPL", "calls&puts", "2026-10-16", "", "2026-04-01", "", "contractSymbol&type&strike&mid&askPrice&bidPrice&askSize&bidSize&volume&impliedVolatility&delta&vega&tradeDate&inTheMoney&tradeDate", "range=ntm")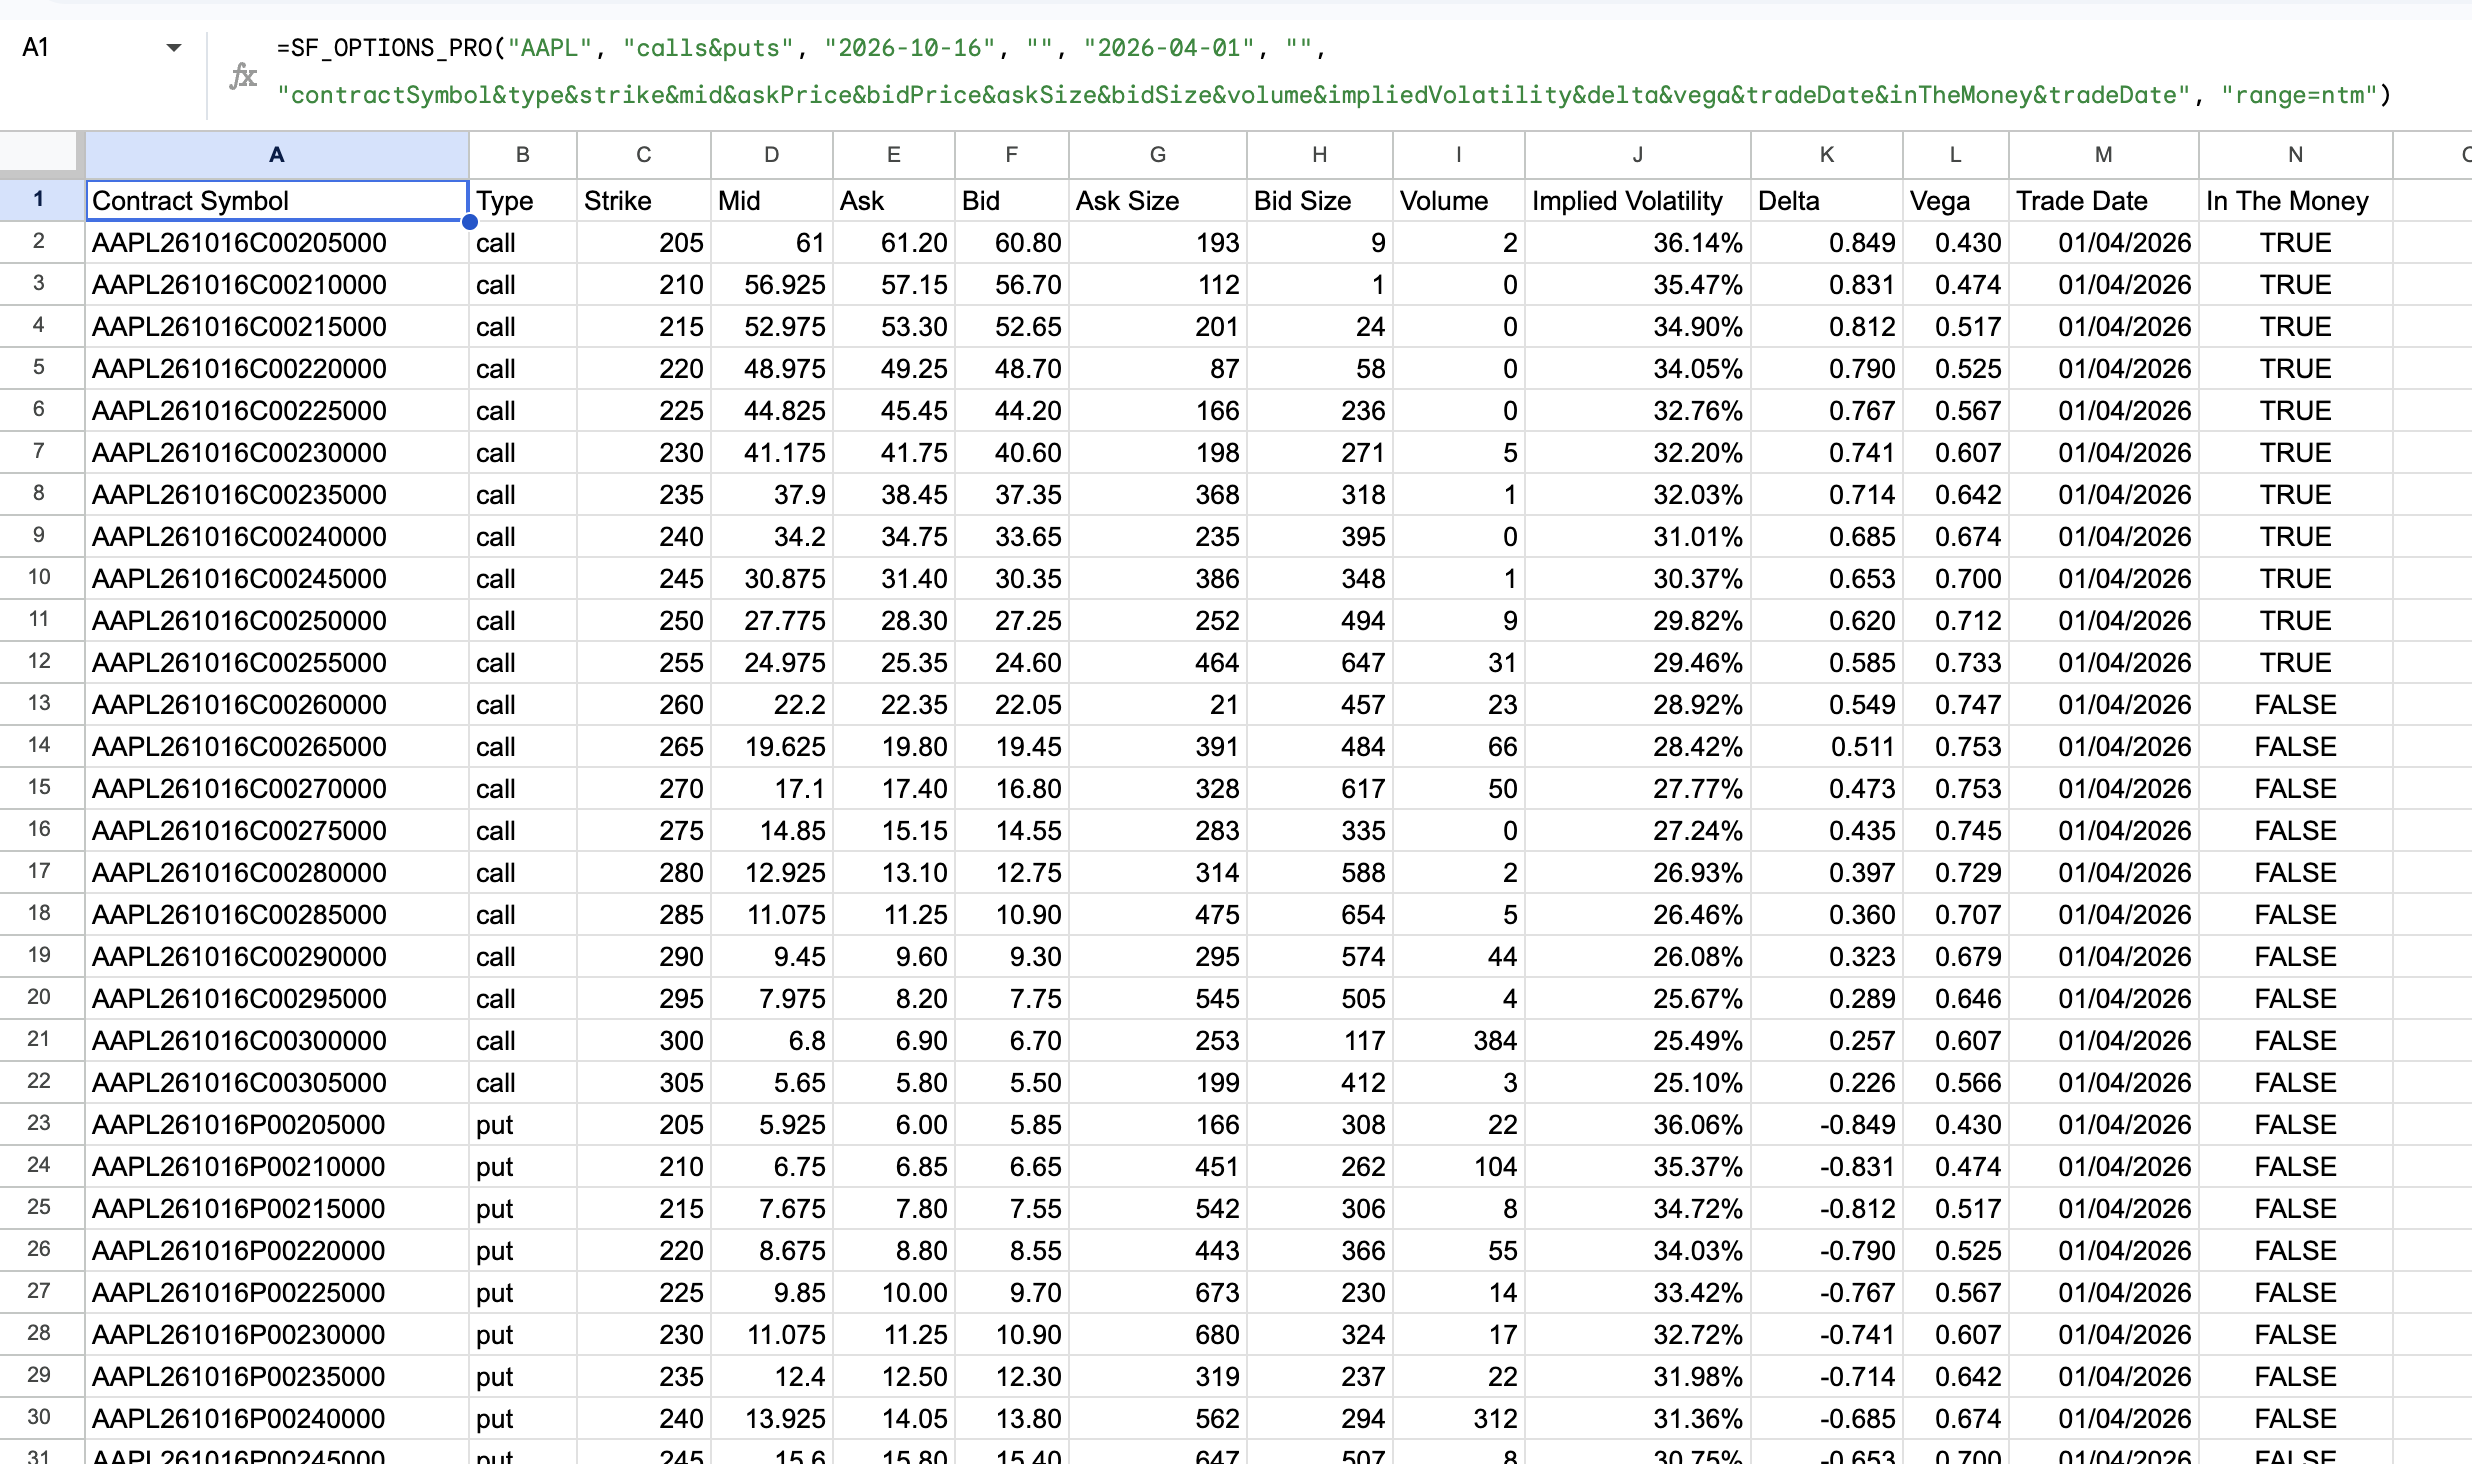
This unlocks spreadsheet workflows for:
- Historical strategy validation
- Event-driven options research
- Studying old skew and term structure conditions
- Reviewing pre-earnings or post-earnings chain behavior
Read more in the docs: Historical Chains
3. Track a Contract or Strike Over Time
Sometimes you don't want a snapshot. You want a time-series so you can see how a specific contract or strike changed over time.
SheetsFinance Options lets you follow a specific contract or both sides of a strike over a date range so you can analyse how pricing, IV, and Greeks have evolved.
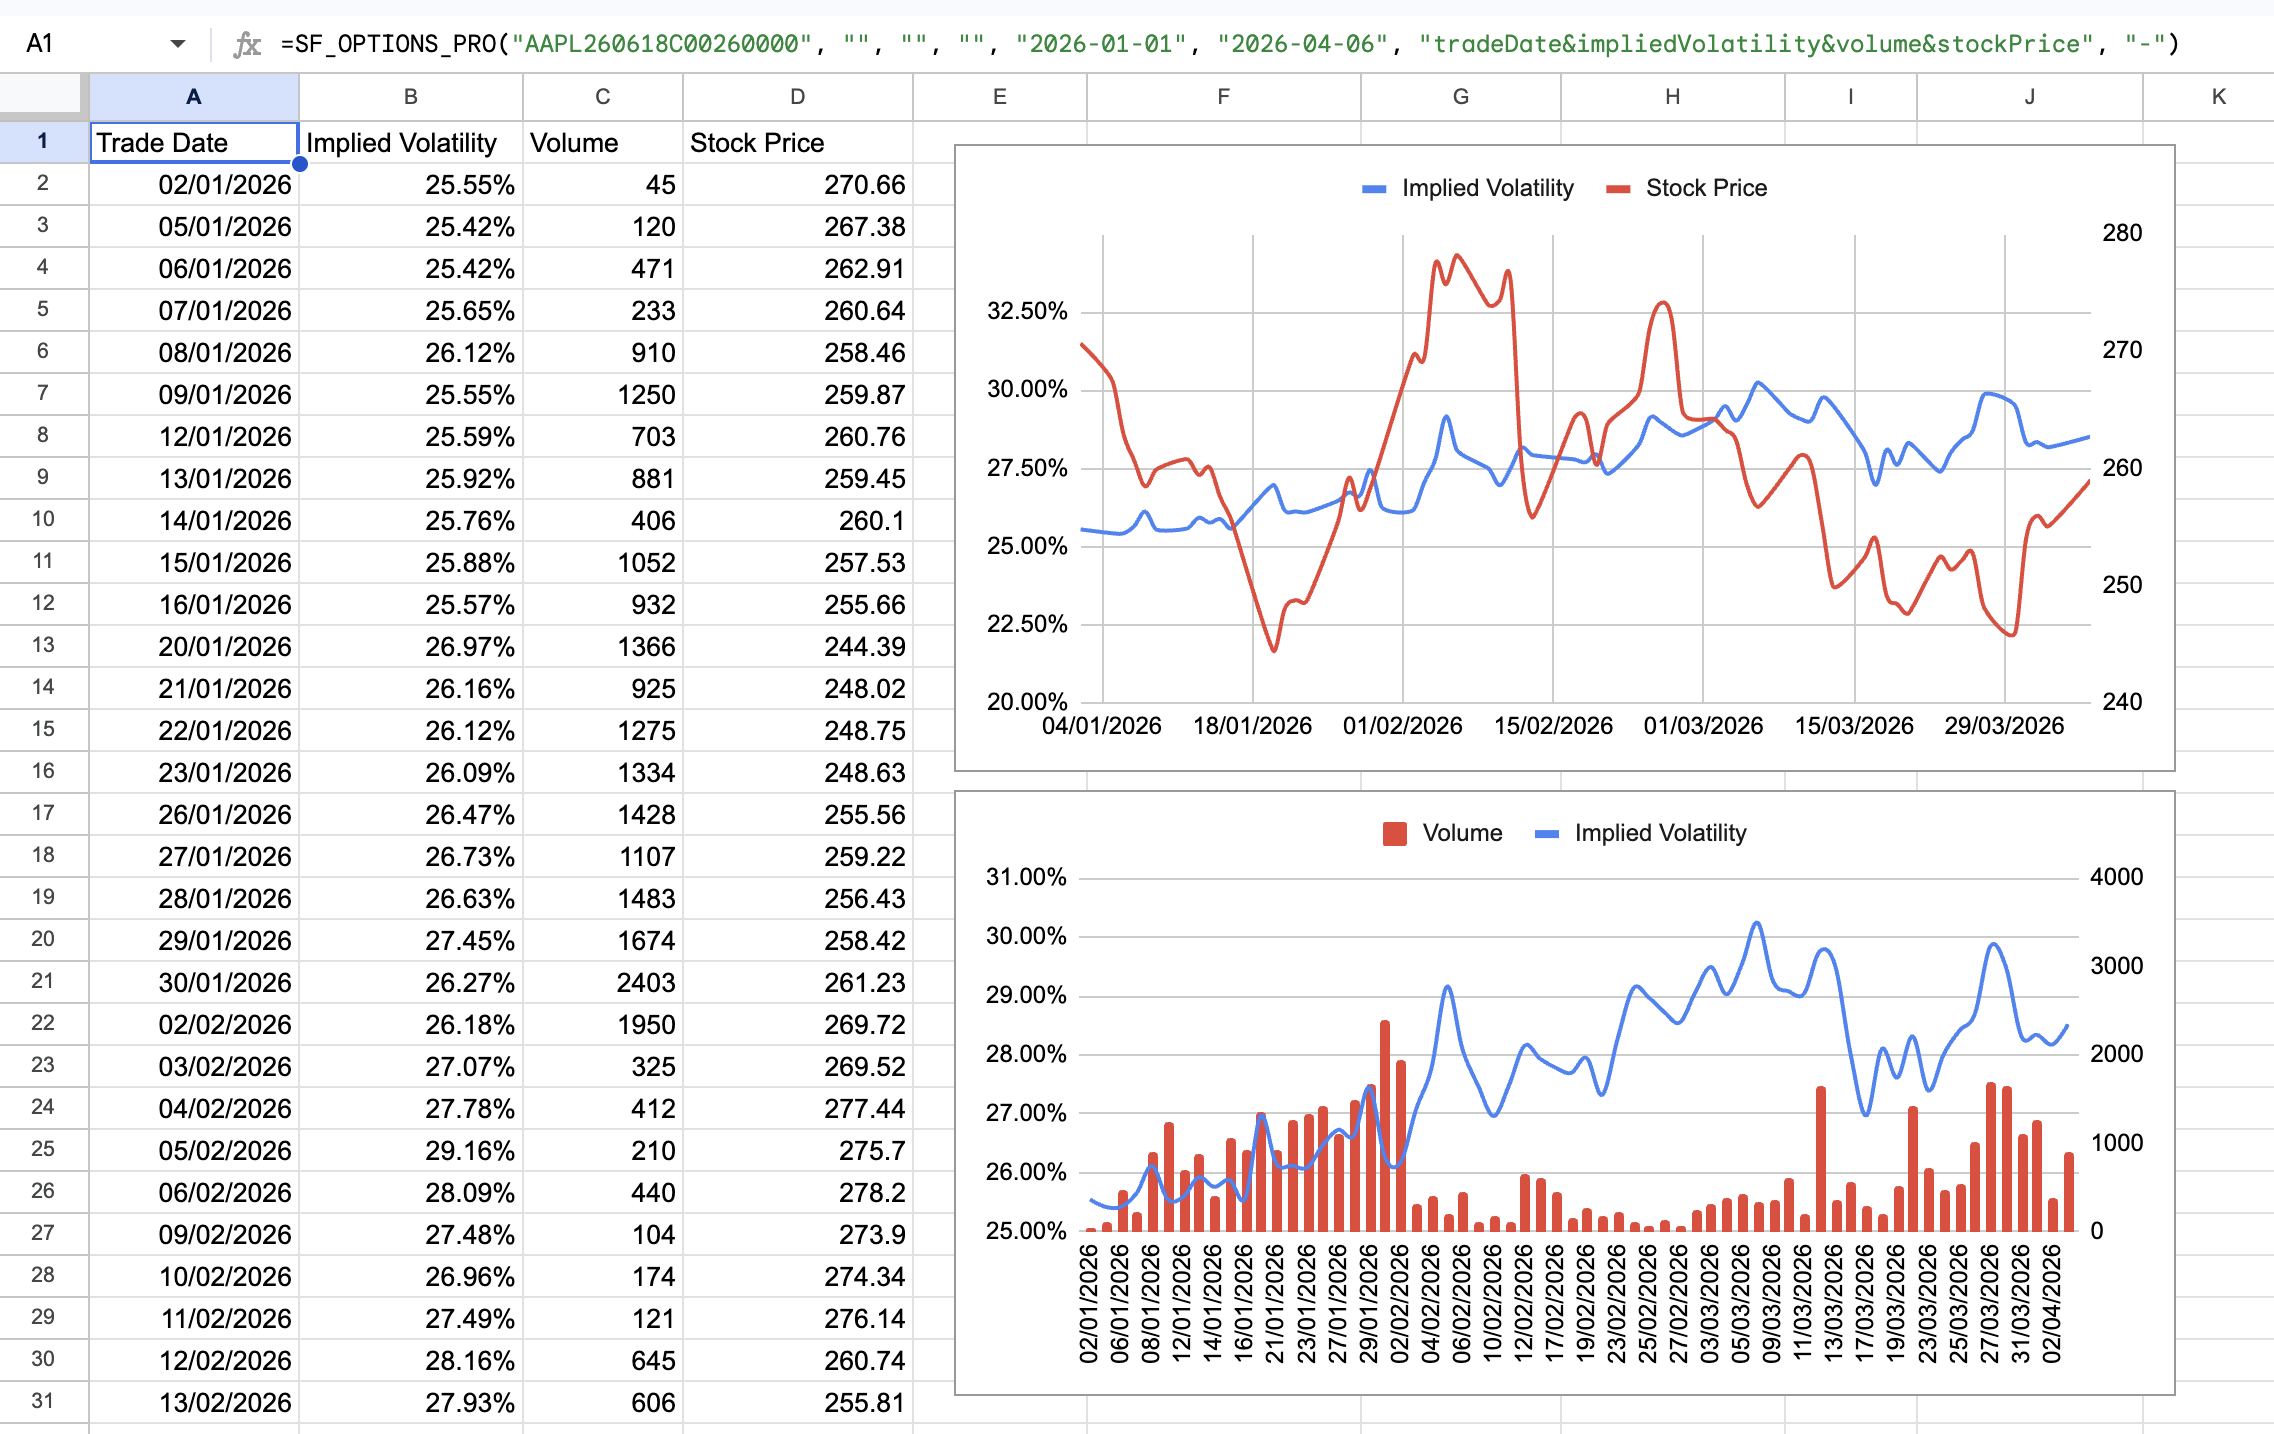
Here we introduce the sixth argument: endDate. If you set both tradeDate and endDate, you can pull a time-series for a specific contract or strike between those dates.
=SF_OPTIONS_PRO("AAPL260618C00260000", "", "", "", "2026-01-01", "2026-04-06", "tradeDate&impliedVolatility&volume&stockPrice", "-")💡 Pro Tip: Adding the formatting option
"-"puts data in descending chronological order which lets you chart simply.
Or lets say you want both sides of the 260 strike for the same date range:
=SF_OPTIONS_PRO("AAPL", "calls&puts", "2026-06-18", 260, "2026-03-01", "2026-04-06", "tradeDate&contractSymbol&type&value&volume&impliedVolatility&delta&stockPrice")This is particularly useful for:
- Monitoring how an option reprices into an event
- Comparing call and put behavior at the same strike
- Studying theta decay and IV changes over time
- Building repeatable backtesting sheets
So now we've touched on all seven arguments of the function, and you can see how they work together to let you pull everything from current chains to historical time-series for specific contracts or strikes.
For all the detail jump into Contract & Strike Time-series in the docs.
4. Screen for IV Rank Across a Watchlist
Implied volatility rank is one of the most practical options research metrics, especially when you want to quickly identify names with relatively rich or cheap volatility. IV Rank is available using the ivRank data type in the second argument, and you can pull it for a single symbol or batch it across a watchlist.
Here's the current IV rank snapshot for a single symbol:
=SF_OPTIONS_PRO("AAPL", "ivRank")Here it is batched across a watchlist of 11 symbols:
=SF_OPTIONS_PRO(A2:A12, "ivRank")That's right you can batch thousands of symbols in one formula and pull IV rank, IV rank percentile, and current IV for both 1-month and 1-year lookback periods. You can also set tradeDate to pull historical IV rank batches to see how the watchlist has evolved over time (more on that below).
That makes it easy to build:
- IV rank watchlists
- Volatility scanners
- Relative value comparison sheets
- Pre-trade research dashboards
Read more in the docs: IV Rank and IV Rank Batch
If you're interested in how things have changed with time, SheetsFinance Options also supports a historical IV rank snapshot by setting tradeDate to a past date, which is useful for point-in-time research.
=SF_OPTIONS_PRO("AAPL", "ivRank", "", "", "2026-02-01")Or you could even turn that into a time-series by adding endDate to see how IV rank has evolved over time, which is useful for studying volatility regimes and how IV rank changes into events.
=SF_OPTIONS_PRO("AAPL", "ivRank", "", "", "2026-01-01", "2026-04-06", "tradeDate&iv&ivRank1m&ivPct1m&ivRank1y&ivPct1y")Note that a time-series only works for a single symbol, so you can't batch a watchlist in time-series mode, but you can still pull historical snapshots for as many symbols as you want using the batch formula above.
All the detail is in the docs under IV Rank Time-series
5. analyse Volatility Term Structure
If you want something more compact than a full chain, the SheetsFinance options package also provides ivPeriods data type for term structure style analysis.
For example:
=SF_OPTIONS_PRO("AAPL", "ivPeriods")
Or an earnings-aware volatility summary:
=SF_OPTIONS_PRO("AAPL", "ivPeriods", "", "", "", "", "tradeDate&iv30d&exErnIv30d&lastErn&impErnMv&absAvgErnMv&ernMvStdv")You can also use tradeDate to pull a historical IV term structure snapshot for a specific point in time, which is useful when you want to compare today's curve to how volatility was priced ahead of a prior event or during a different market regime.
ivPeriods also supports a true time-series mode when you provide both tradeDate and endDate, letting you track how IV metrics evolve over time in one spreadsheet call.
For example:
=SF_OPTIONS_PRO("AAPL", "ivPeriods", "", "", "2026-03-01", "2026-04-02", "tradeDate&iv30d&iv60d&iv90d&contango")This is useful for traders and researchers who want to quickly assess:
- Near-term vs longer-dated implied volatility
- Contango and term structure shape
- The size of the earnings effect
- How current IV compares to longer-run norms
- How the term structure changes through time, not just at a single snapshot
Read more in the docs: IV Periods and IV Periods Time-series
6. Pull Full Volatility Surfaces and Surface Forecasts
For deeper volatility research, you can also retrieve the full implied volatility surface by delta grid. This is accessed using the surface data type as the second argument.
By specifying gridOnly as the metrics argument we'll get a compact grid of deltas and expirations with the corresponding implied volatilities, which is ideal for quickly inspecting the surface shape and charting:
=SF_OPTIONS_PRO("AAPL", "surface", "", "", "", "", "gridOnly")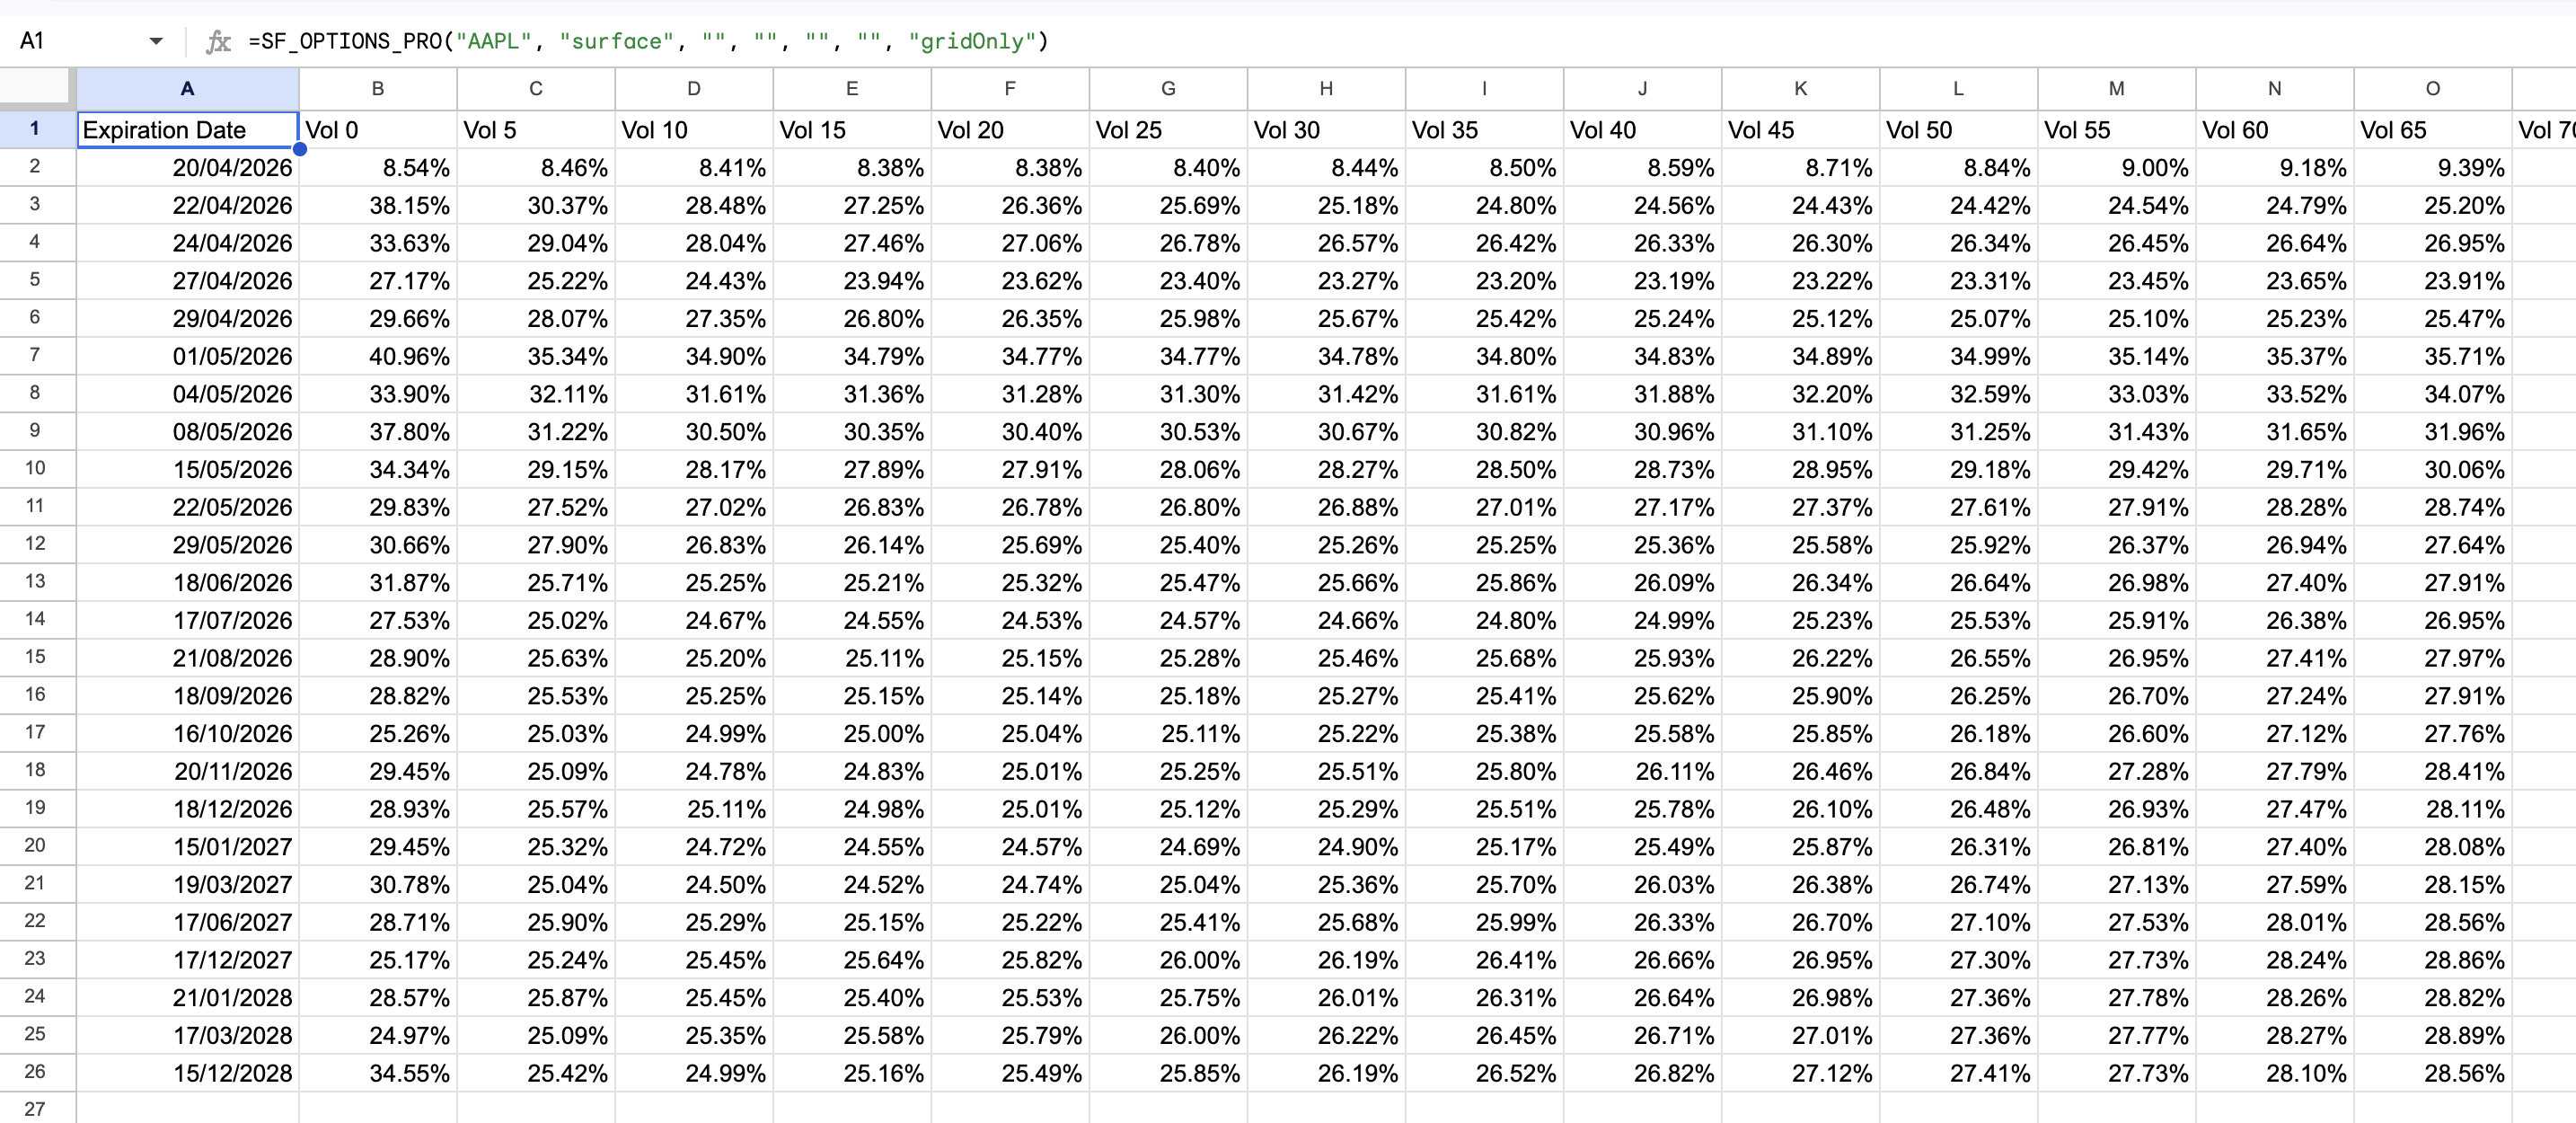
Of course, there are a lot more fields available if you want to do a deeper dive into the surface data. Just replace the "gridOnly" with the metrics you're after or leave it blank (or set it to "all") to get everything.
If you want to only analyse the smile and skew of a single expiration, you can set expirationDate to pull the smile for that specific expiration date.
=SF_OPTIONS_PRO("AAPL", "surface", "2026-10-16", "", "", "", "gridOnly")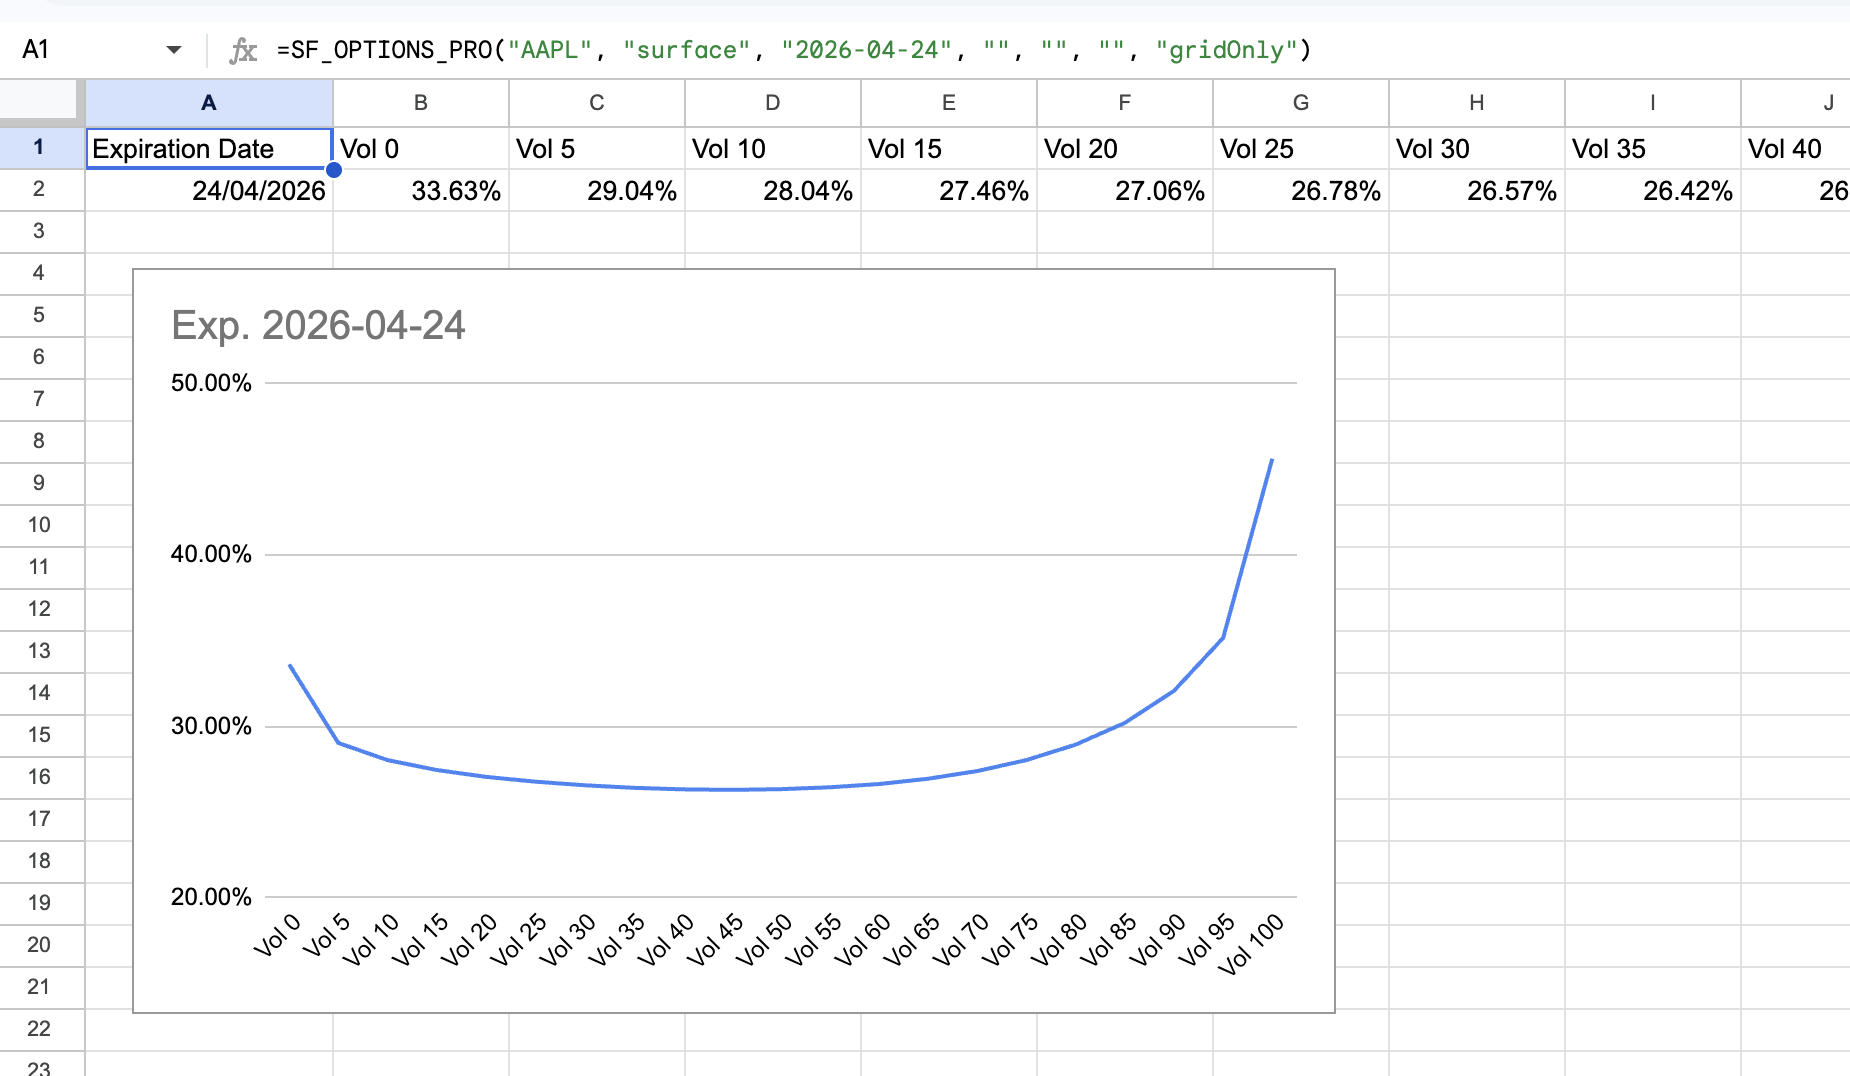
Surfaces also support a historical snapshot mode by setting tradeDate to a past date, which is useful for comparing how the surface has changed over time or how it looked ahead of a prior event:
=SF_OPTIONS_PRO("AAPL", "surface", "", "", "2025-10-01")You can also compare the current market surface with a forecasted surface using surfaceForecast, which is useful for advanced volatility modelling workflows.
This gives you a spreadsheet-native way to inspect:
- Vol smile and skew by expiration
- ATM IV across the curve
- Earnings effect embedded in the surface
- Volatility surface changes through time
Read more in the docs: Surface and Surface Forecast
7. Compare Earnings Moves to the Options Market's Expectations
Last but not least, the earnings data type gives you access to a unique dataset that compares the stock's actual earnings move to what the options market was implying ahead of the event. The function returns a list of the last 3 years of quarterly earnings events, the stock's move on the day of the event, and the options-implied move derived from the straddle price.
=SF_OPTIONS_PRO("AAPL", "earnings")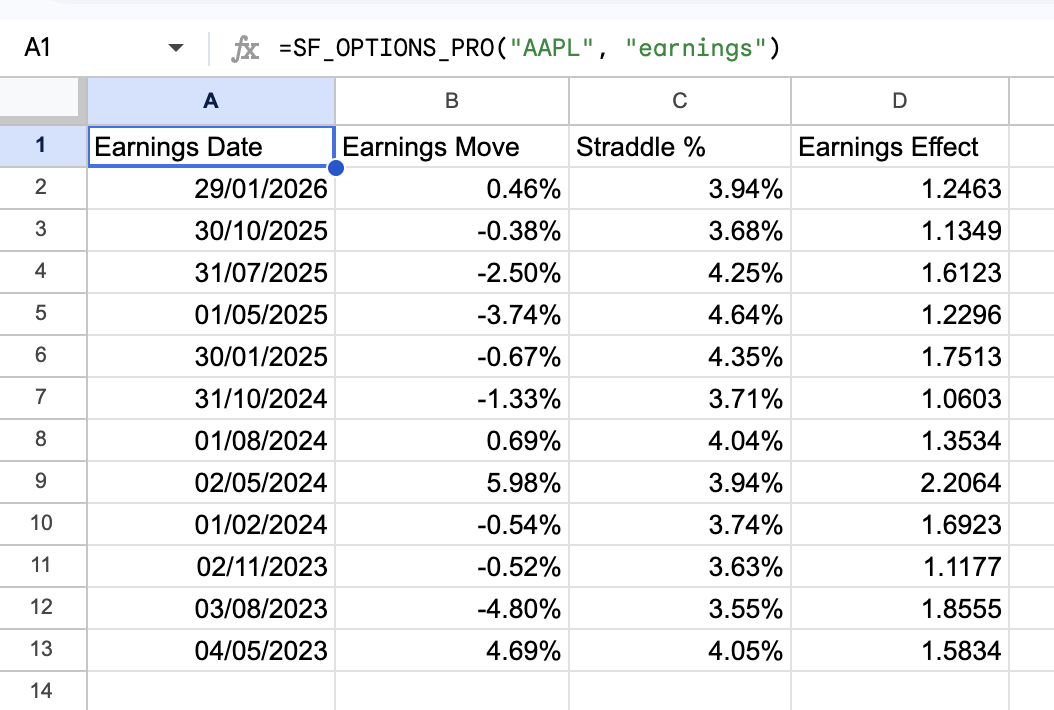
You can also set tradeDate to view the earnings dataset as it stood on a previous date, making it easier to do point-in-time event research. Like surfaces, this historical mode is snapshot-based rather than a full tradeDate to endDate time-series.
This helps answer questions like:
- How large were the stock's actual earnings moves?
- What was the options market implying ahead of the event?
- Was the implied move typically too high or too low?
- How much earnings effect was embedded in the volatility surface?
For event-driven options traders, this is one of the most useful datasets in the package.
Read more in the docs: Earnings
Who is Options Built for
The SheetsFinance Options is especially valuable if you are:
- An options trader building spreadsheet-based workflows
- A volatility researcher studying skew, IV rank, and term structure
- A systematic trader backtesting historical contract behavior
- An analyst comparing earnings expectations to realized moves
- A Google Sheets or Excel power user who wants serious options data without building an API pipeline
Why This Matters
The real advantage here is not just that the data is deep. It is that the workflow is simple.
Instead of managing separate vendors, exports, scripts, and custom integrations, you can keep your options analysis inside the spreadsheet environment you already use every day.
That means faster iteration, easier experimentation, and more transparent models.
With the SheetsFinance Options, you can move from:
- Idea to formula
- Formula to dataset
- Dataset to chart, dashboard, or research workflow
All inside Google Sheets or Microsoft Excel.
Get Started with SheetsFinance Options
Get started for free with a 15-day trial of the SheetsFinance Options to explore the full dataset and start building your own options research workflows in Google Sheets or Excel. No payment details are required, so you can jump in and start experimenting right away.
If you want professional-grade options data in your spreadsheet, SheetsFinance Options gives you a flexible way to access:
- Full options chains
- Greeks and IV
- Historical options data and expired contracts
- Contract and strike time-series
- IV rank and IV period analytics
- Volatility surfaces and forecasts
- Earnings-derived options metrics
To learn more, visit the full documentation for SF_OPTIONS_PRO() and explore the dataset-specific guides for chains, historical chains, IV rank, surfaces, and earnings workflows.
Useful Links:
Enjoy building with the data, and as always, if you have any questions or want to share what you're building, feel free to reach out!