Track Market Valuations Like a Pro: Industry & Sector PE Ratios For Global Markets in Google Sheets
Picture this: You're evaluating a tech stock trading at 25x earnings. Is that expensive or cheap? Without context, it's impossible to know. You may just need to compare it to its industry peers, understand sector-wide trends, and see how valuations differ across global markets. Manually gathering this data could take hours of research across multiple sources.
Let's explore SheetsFinance's industry and sector PE functions, where you can instantly pull average PE ratios for over 200 industries and 11 major sectors across global exchanges. Whether you're hunting for undervalued sectors, timing sector rotations, or comparing valuations across markets, these powerful functions transform Google Sheets into a professional-grade valuation analysis platform.
What We'll Cover
In this comprehensive guide, you'll learn how to:
- Pull real-time sector PE ratios across major global exchanges
- Access granular industry-level PE data for 200+ industries
- Compare sector and/or industry PE ratios over time for 65+ global markets
- Combine PE data with other metrics for comprehensive analysis
By the end of this post, you'll have the tools to make informed investment decisions based on relative valuations across sectors, industries, and global markets.
Prerequisites & Getting Started
Before we dive into valuation analysis, let's ensure you're set up for success:
What You'll Need
- SheetsFinance Add-on: Make sure SheetsFinance is properly installed and linked to your Google account. If you haven't installed it yet, follow our step-by-step installation guide.
- Basic Google Sheets Knowledge: Familiarity with entering formulas and basic spreadsheet navigation will help you get the most out of this tutorial.
- Exchange Symbols: Know the exchange codes you'll be analyzing (e.g., "NASDAQ", "NSE", "XETRA"). We'll show you where to find these.
Quick Setup Check
Let's verify everything is working with a simple test. In any empty cell, try entering:
=SF("AAPL")Essential Resources
Keep these handy as we work through the examples:
- Available Markets - List of available global exchanges on SheetsFinance
- Function Generator - Automatic formula builder
- Symbol Search - Find ticker symbols easily
Now let's explore sector valuations!
Your First Sector PE Analysis
Let's start by pulling current sector PE ratios for the NASDAQ:
=SF("NASDAQ", "sectorPE")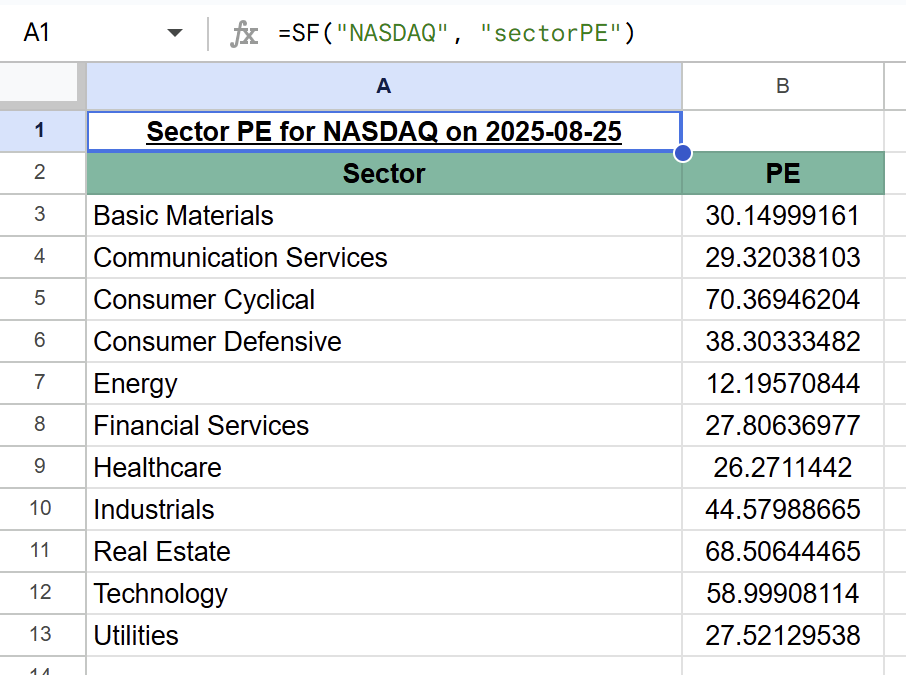
Instantly, you can see the average PE ratio for all 11 major sectors! This reveals:
- Which sectors the market is paying a premium for (high PE)
- Where value might be hiding (low PE)
- Overall market sentiment across different economic segments
The sectors included are:
- Technology - Software, hardware, semiconductors
- Healthcare - Pharma, biotech, medical devices
- Financial Services - Banks, insurance, asset management
- Consumer Cyclical - Retail, automotive, restaurants
- Consumer Defensive - Food, beverages, household products
- Industrials - Manufacturing, aerospace, logistics
- Energy - Oil & gas, renewable energy
- Basic Materials - Chemicals, metals, mining
- Real Estate - REITs, property development
- Communication Services - Telecom, media, internet
- Utilities - Electric, gas, water utilities
Comparing Sectors PE Ratios Over Time
Static PE ratios tell only part of the story. Let's see how sector valuations have changed. You can pull historical sector PE ratios by specifying a date:
=SF("NASDAQ", "sectorPE", "Technology&Healthcare&Financial Services", "2023-01-01")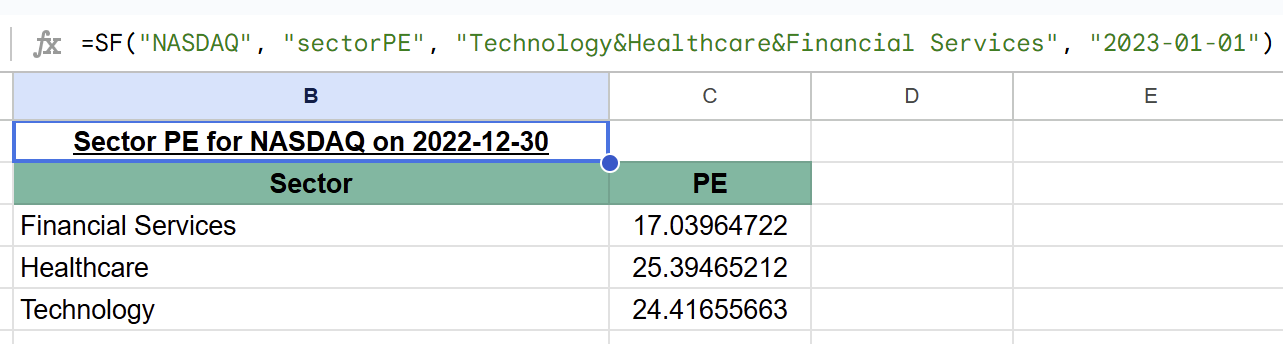
Now compare with today's values:
=SF("NASDAQ", "sectorPE", "Technology&Healthcare&Financial Services")🔥 Hot Tip: Omitting the date will always pull the latest values.
Analysing PE ratio changes over time can reveal:
- Which sectors have become more expensive
- Where valuations have compressed
- Potential sector rotation opportunities
📈 Trading Insight: When a historically expensive sector's PE drops below its average while fundamentals remain strong, it might signal a buying opportunity.
Industry-Level PE Ratio Analysis
While sectors give you the big picture, industry-level data provides surgical precision. Let's analyze specific industries:
=SF("NSE", "industryPE", "Software - Application|Software - Infrastructure|Semiconductors", TODAY())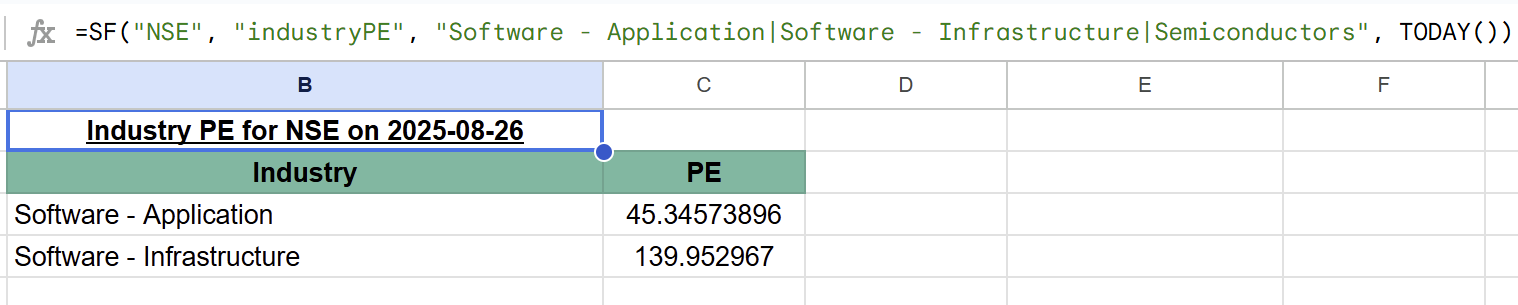
‼️ Important: We use the
|separator for industries (not&). This is critical for correct formula construction!
Of course, you can pull all industries at once as well by specifying "all" instead of individual industry names. Just be aware this will return a large dataset:
=SF("NASDAQ", "industryPE", "all")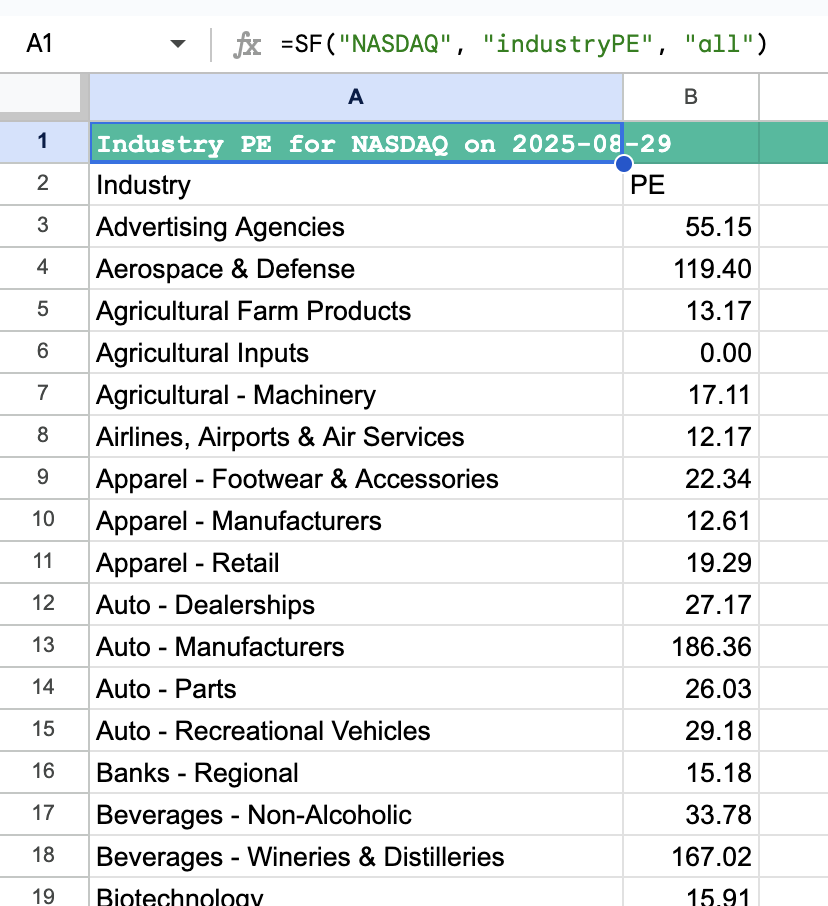
Building a Global Valuation Dashboard
One of SheetsFinance's most powerful features is comparing valuations across global markets. Let's build a dashboard comparing tech sector valuations worldwide:
Step 1: Set Up Your Markets
In column A, list the exchanges you want to compare:
- A2:
NASDAQ - A3:
NSE - A4:
XETRA - A5:
ASX - A6:
TSX
Step 2: Pull Sector PE Data
In cell B1, enter the sector name: Technology
In cell B2, enter this formula and drag down:
=INDEX(SF(A2, "sectorPE", B$1, TODAY()), 3, 2)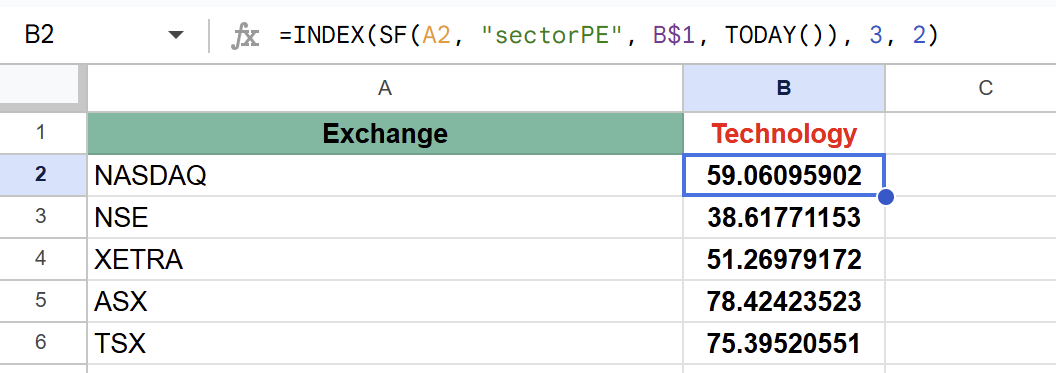
This reveals fascinating insights:
- Technology trades at different multiples globally
- Emerging markets might offer value
- Currency and growth expectations affect valuations
Tracking Industry Momentum
For more granular analysis, track specific industries over time. Here's a nice way to visualise the trend for a single industry PE Ratio over the past year using Google Sheets' built-in sparkline function:
=SPARKLINE(
{SF("NASDAQ", "industryPE", "Auto - Manufacturers", TODAY()-360,"NH&NLI");
SF("NASDAQ", "industryPE", "Auto - Manufacturers", TODAY()-270,"NH&NLI");
SF("NASDAQ", "industryPE", "Auto - Manufacturers", TODAY()-180,"NH&NLI");
SF("NASDAQ", "industryPE", "Auto - Manufacturers", TODAY()-90,"NH&NLI");
SF("NASDAQ", "industryPE", "Auto - Manufacturers", "","NH&NLI")}
)Real-World Applications
Value Screening Across Industries
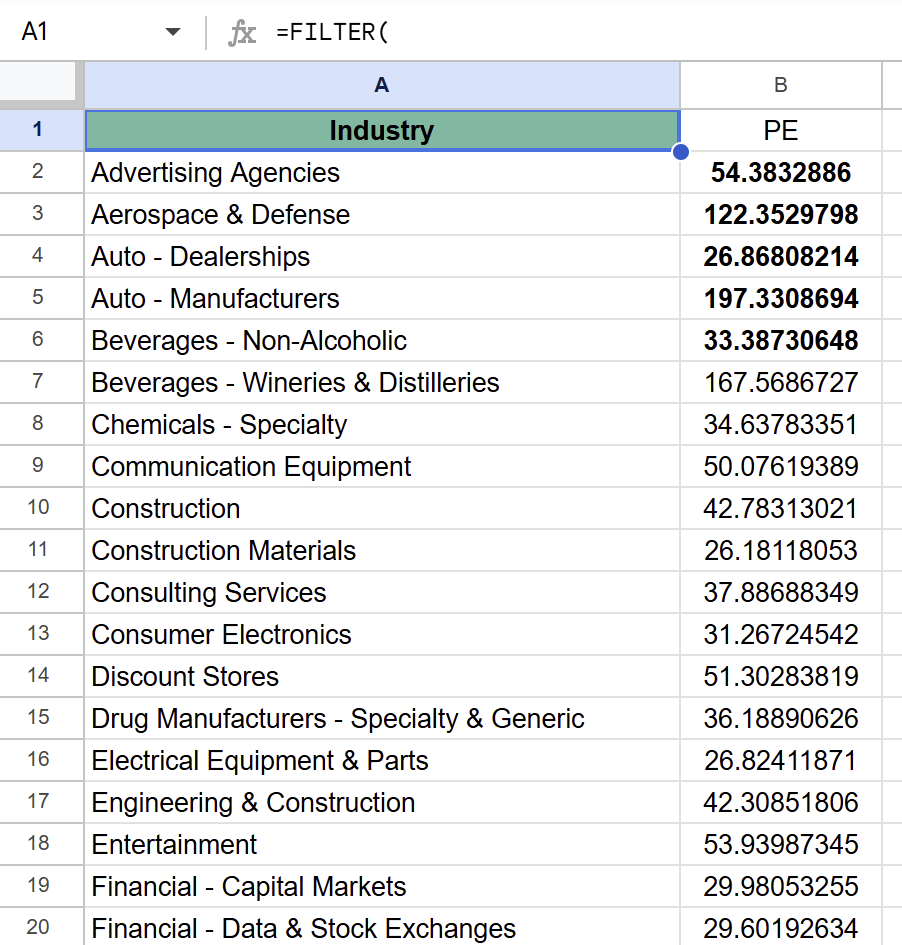
Create a value screen to find expensive industries with good fundamentals:
- Pull all industry PEs
- Filter for PE > 25
- Cross-reference with growth metrics
- Research the cheapest industries for opportunities
=FILTER(
SF("NASDAQ", "industryPE", "all", TODAY()),
INDEX(SF("NASDAQ", "industryPE", "all", TODAY()), 0, 2) > 25
)
Relative Valuation Analysis
Compare a stock's PE to its industry average. You can get a stock's current PE ratio using Real-time or for historical PE Ratios check out our Key Ratios function.
Next, you can get a stocks industry from our Company Info function.
Using the output of this with this Industry PE function you can create a dynamic formula to compare any stock's PE to its industry average. Here's a simple version where we've just hardcoded the industry name "Computer Hardware" for Apple:
=SF("AAPL", "realTime", "pe") / INDEX(SF("NASDAQ", "industryPE", "Computer Hardware", TODAY()), 3, 2)- < 1: Stock trades below industry average (potentially undervalued)
- > 1: Stock trades above industry average (potentially overvalued)
Pro Tips for Maximum Efficiency
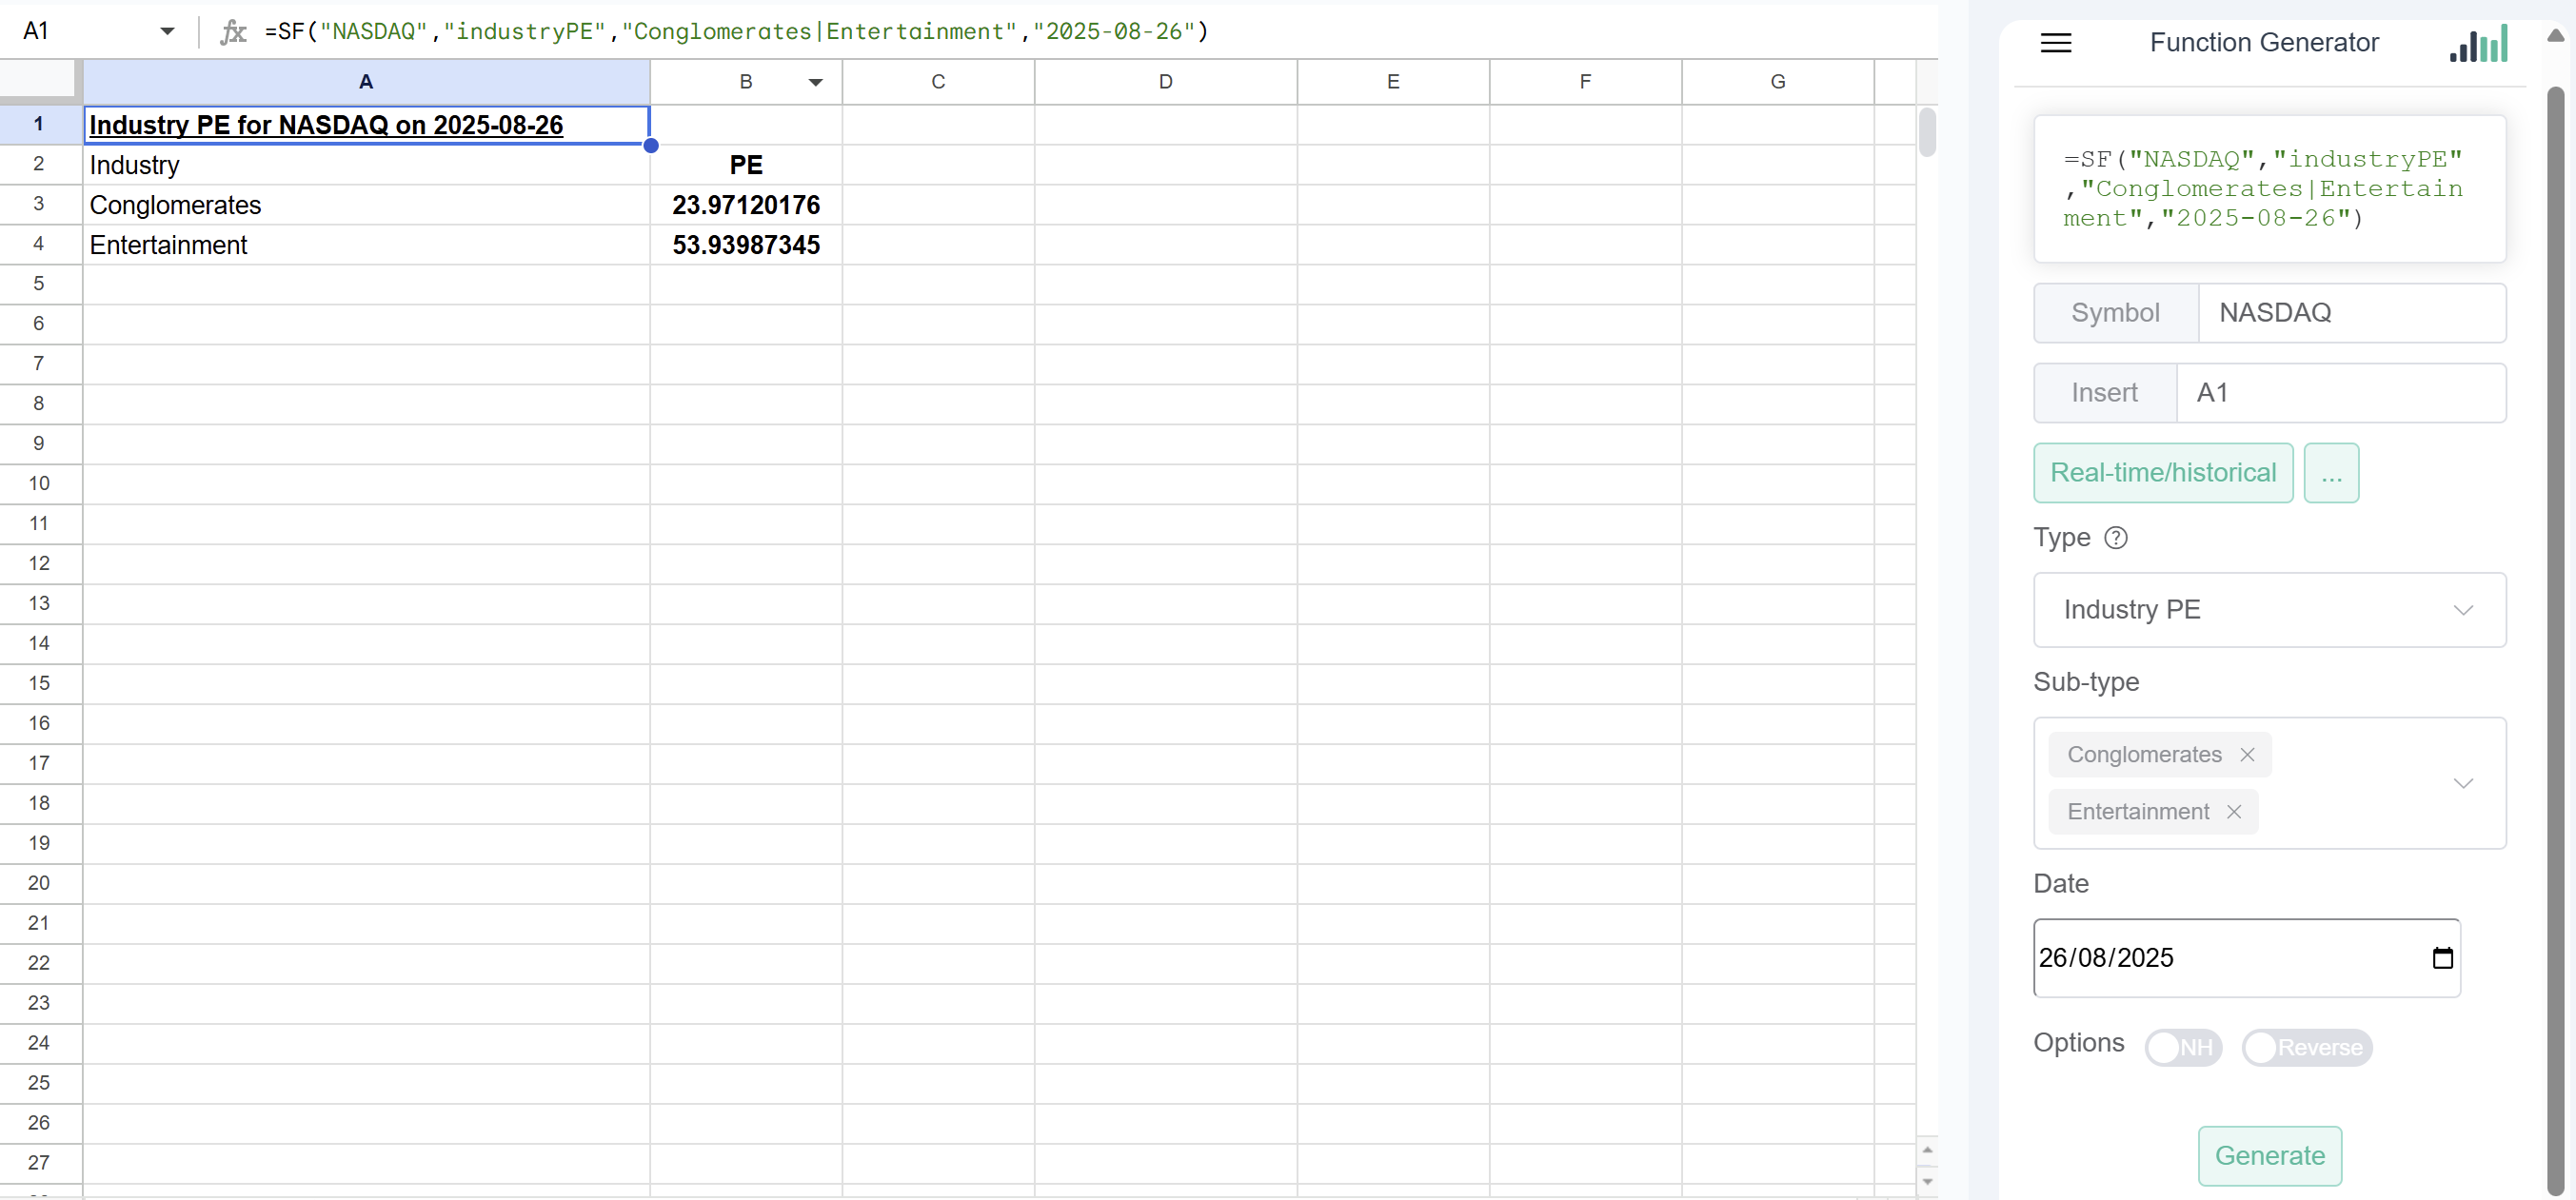
1. Use the Function Generator
With 200+ industries available, remembering exact names is challenging. The Function Generator lets you:
- Browse all available industries
- Select multiple industries visually
- Generate perfect formulas automatically
2. Create Dynamic References
Store frequently used industries in a named range:
=SF("NASDAQ", "industryPE", TechIndustries, TODAY())Where TechIndustries is a named range containing: "Software - Application|Software - Infrastructure|Semiconductors"
3. Handle Different Separators
Remember the key difference:
- Sectors: Use
&to chain multiple sectors - Industries: Use
|to chain multiple industries
Conclusion
The ability to track sector and industry PE ratios transforms how you approach market valuation. No longer do you need to guess whether a stock is expensive—you can compare it to precise industry averages across global markets. From identifying sector rotations to finding undervalued industries, these functions provide institutional-grade insights in your Google Sheets.
Whether you're a value investor hunting for bargains, a growth investor avoiding overvalued sectors, or a global investor comparing markets, PE analysis forms the foundation of informed decision-making. The granularity of 200+ industries combined with 65+ global markets creates endless opportunities for those who know where to look.
Start simple—track PE ratios for sectors you understand. As you build confidence, expand to industry-level analysis and global comparisons. Soon, you'll spot valuation anomalies and sector rotations like a seasoned portfolio manager.
Ready to revolutionize your valuation analysis? Install SheetsFinance today and start uncovering opportunities hiding in plain sight across global markets.
For complete documentation and more examples, visit the SheetsFinance documentation. Have questions? Join our Discord community or contact our support team.
Happy investing!