Track Indian Stock Markets (NSE & BSE) in Real-Time with Google Sheets 🇮🇳
The Indian stock markets are some of the most dynamic and exciting markets in the world. With a wide range of companies listed on the Bombay Stock Exchange (BSE) and the National Stock Exchange of India (NSE), there are plenty of opportunities for investors to find value and growth.
In this article, we're going to show you how to track the Indian stock markets in real-time using Google Sheets and the SheetsFinance add-on. With SheetsFinance, you can access a wide range of financial data, including stock prices, company information, and more, all directly within Google Sheets.
Both the NSE and BSE are available as second-accurate real-time data feeds within SheetsFinance. You can check which markets are available in real-time by visiting our Available Markets page in our docs. Not only that, but both the NSE and BSE are available for historical data as well, with up to 30+ years of OHLCV, dividend data, financial statements, ratios and more.
Lastly, SheetsFinance also provides access to NSE and BSE financial calendars, such as earnings calendars, dividend calendars, and more. This can be useful for tracking important events and announcements for Indian companies.
Let's jump into it.
What we'll cover today
- How to pull real-time stock prices, volume, key metrics and more for up to 5000 Indian stock symbols with only function.
- How to generate 30+ years of dividend, financial statements and OHLCV pricing data for any Indian stock symbol.
- How to track upcoming earnings and dividend announcements for Indian companies using Financial Calendars.
🧑🏽💻 Prerequisite: Before we get started, make sure you have the SheetsFinance add-on installed and linked to your Google account. If not, you can find how to do so here. If you're new to SheetsFinance you can try it out all our features for free, no payment details required, for 15 days.
How to pull real-time stock prices for Indian stocks (NSE and BSE)
Let's start with our most basic function. Open a new sheet and run the following function to load the real-time stock price for the ticker RELIANCE.NS:
=SF("RELIANCE.NS")💡 Learning Moment: When no function type is specified the
SFfunction defaults to the"realTime"function with the metric"price". Therefore=SF("RELIANCE.NS")is the same as=SF("RELIANCE.NS", "realTime", "price").
There are a bunch of other available metrics for our Real-time function. For example, let's generate the price, volume, EPS and PE ratio for the same ticker. This is done so by specifying the "realTime" function and then using the & operator to chain the metrics:
=SF("RELIANCE.NS", "realTime", "price&volume&eps&pe")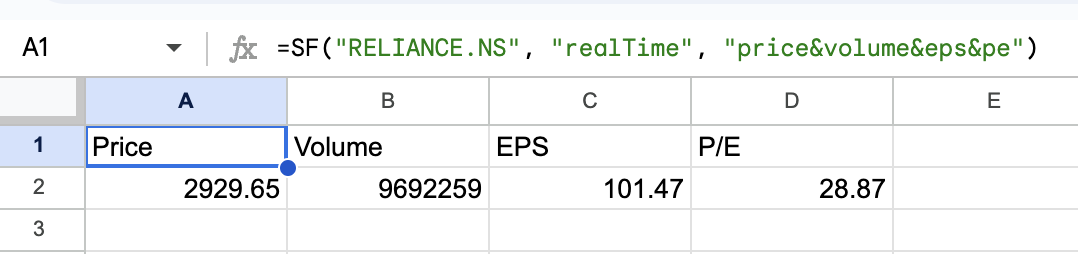
Feeling lazy? You can generate all the available metrics for the Real-time function at once by specifying all:
=SF("RELIANCE.NS", "realTime", "all")How to pull real-time stock prices for multiple Indian stocks at once
One of the most powerful features of SheetsFinance is the ability to pull data for multiple stocks at once. In fact, SheetsFinance can handle up to 5000 stock symbols at once (!!), loading real-time data in a matter of seconds. We call these functions our "batch" functions. They operate almost identically to the single stock functions, but instead of a single ticker, you provide a range of tickers. For example, let's list a range of tickers in column A and then use our Real-time Batch function to load the price, volume, P/E ratios, EPS and open price for each stock:
=SF(A2:A15, "realTime", "price&volume&pe&eps&open")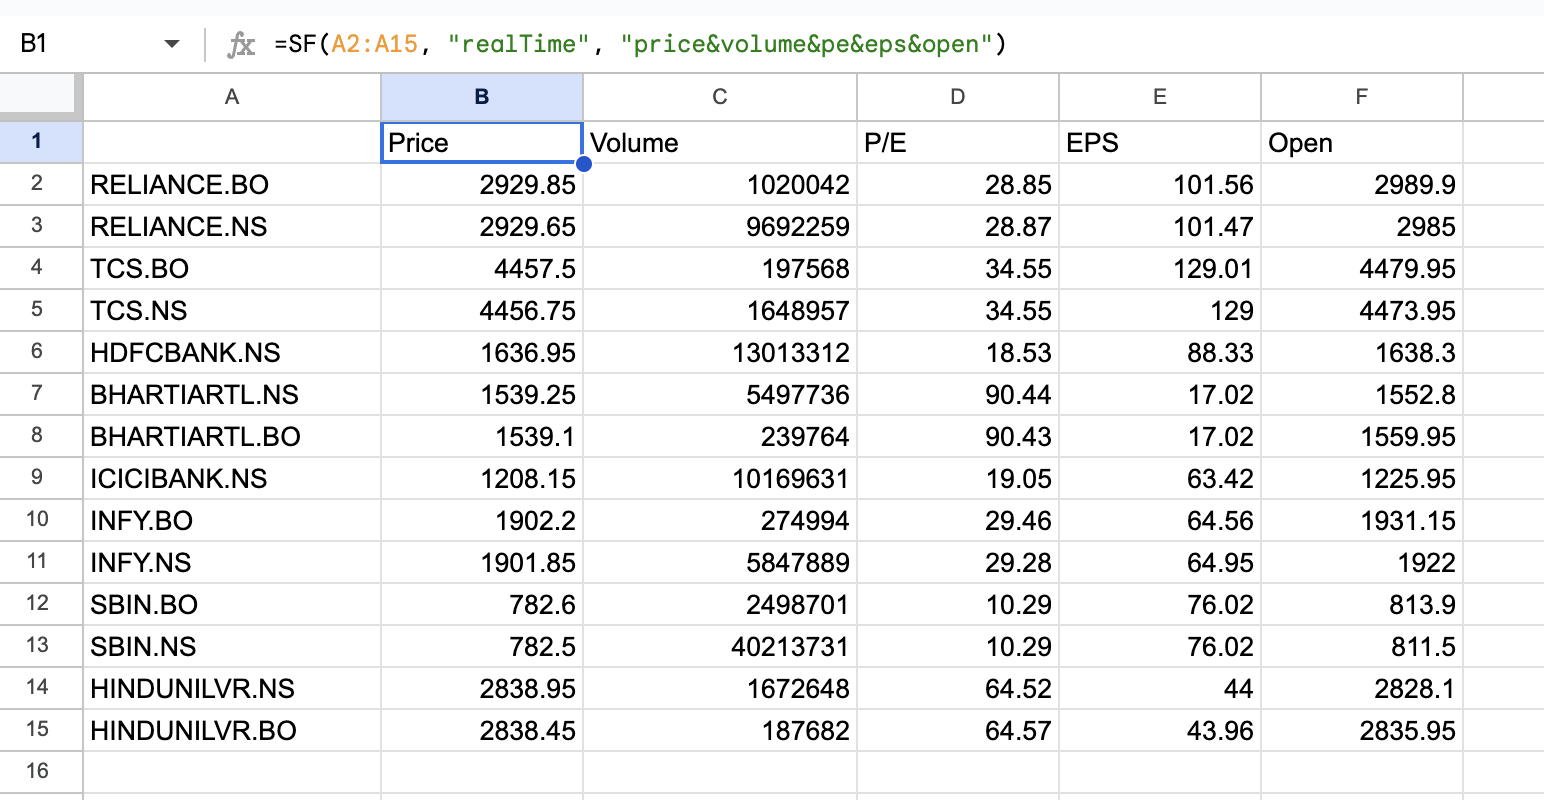
🎬 See it in action: If you want to see a great example of our batch functions in action, check out this YouTube walkthrough where we build a global watchlist.
How to generate 30+ years of dividend, financial statements and OHLCV pricing data for Indian stocks (NSE and BSE)
Now that we've covered real-time data, let's move on to historical data. SheetsFinance provides access to 30+ years of historical data for Indian stocks, including OHLCV pricing data, dividend data, financial statements, ratios and more.
How to generate OHLCV data for Indian stocks
Daily, inter-day and intra-day OHLCV data is available for both the NSE and BSE. We call these functions our Time-series functions. Let's generate the daily OHLCV data for the ticker RELIANCE.NS:
=SF_TIMESERIES("RELIANCE.NS", "2023-01-01", "2024-09-08", "daily", "date&open&high&low&close&volume")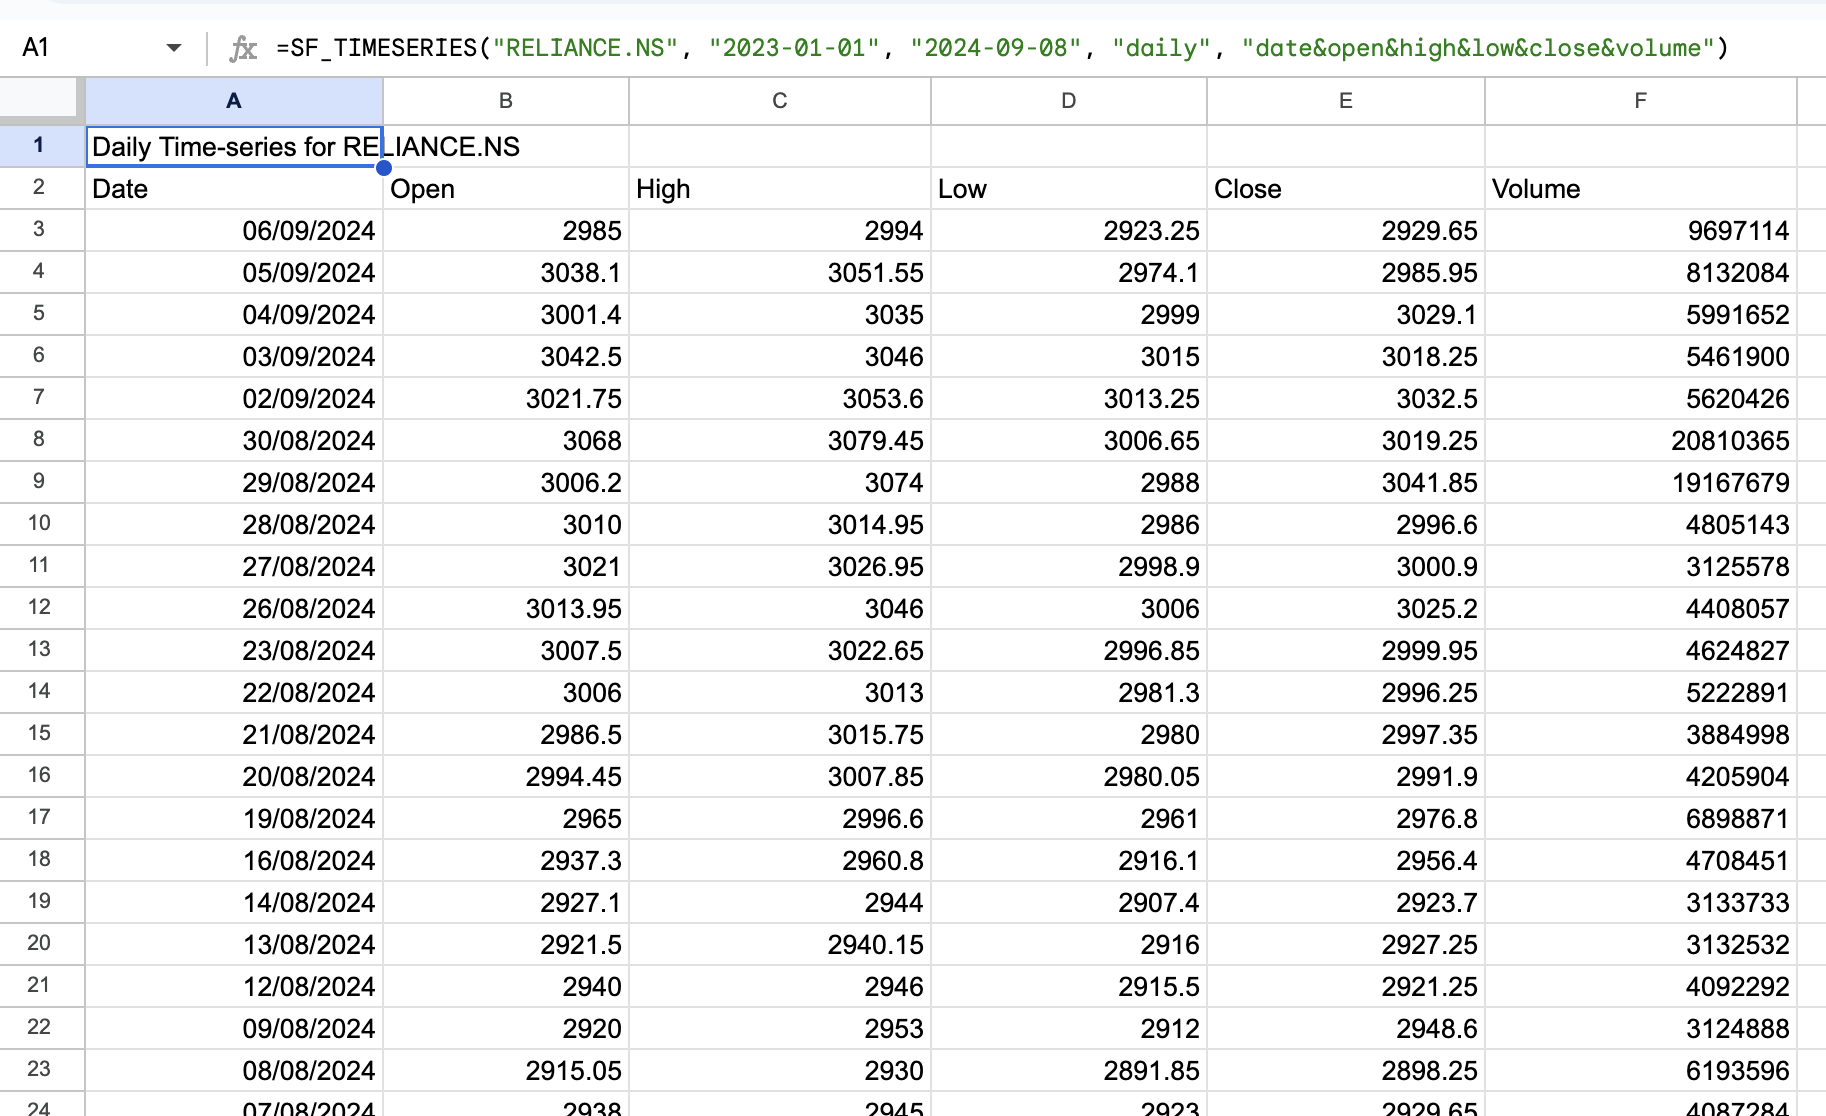
SheetsFinance has 30+ years of OHLCV data available! If you want to see all the available metrics for the Time-series function just specify all:
=SF_TIMESERIES("RELIANCE.NS", "2023-01-01", "2024-09-08", "daily", "all")Our NSE and BSE intra-day pricing data is available down to 1-minute intervals. This can be useful for building trading strategies or analyzing price movements throughout the day. Let's generate the intra-day OHLCV data for the ticker RELIANCE.NS:
=SF_TIMESERIES("RELIANCE.NS", "2023-09-01", "2023-09-01", "1min", "date&open&high&low&close&volume")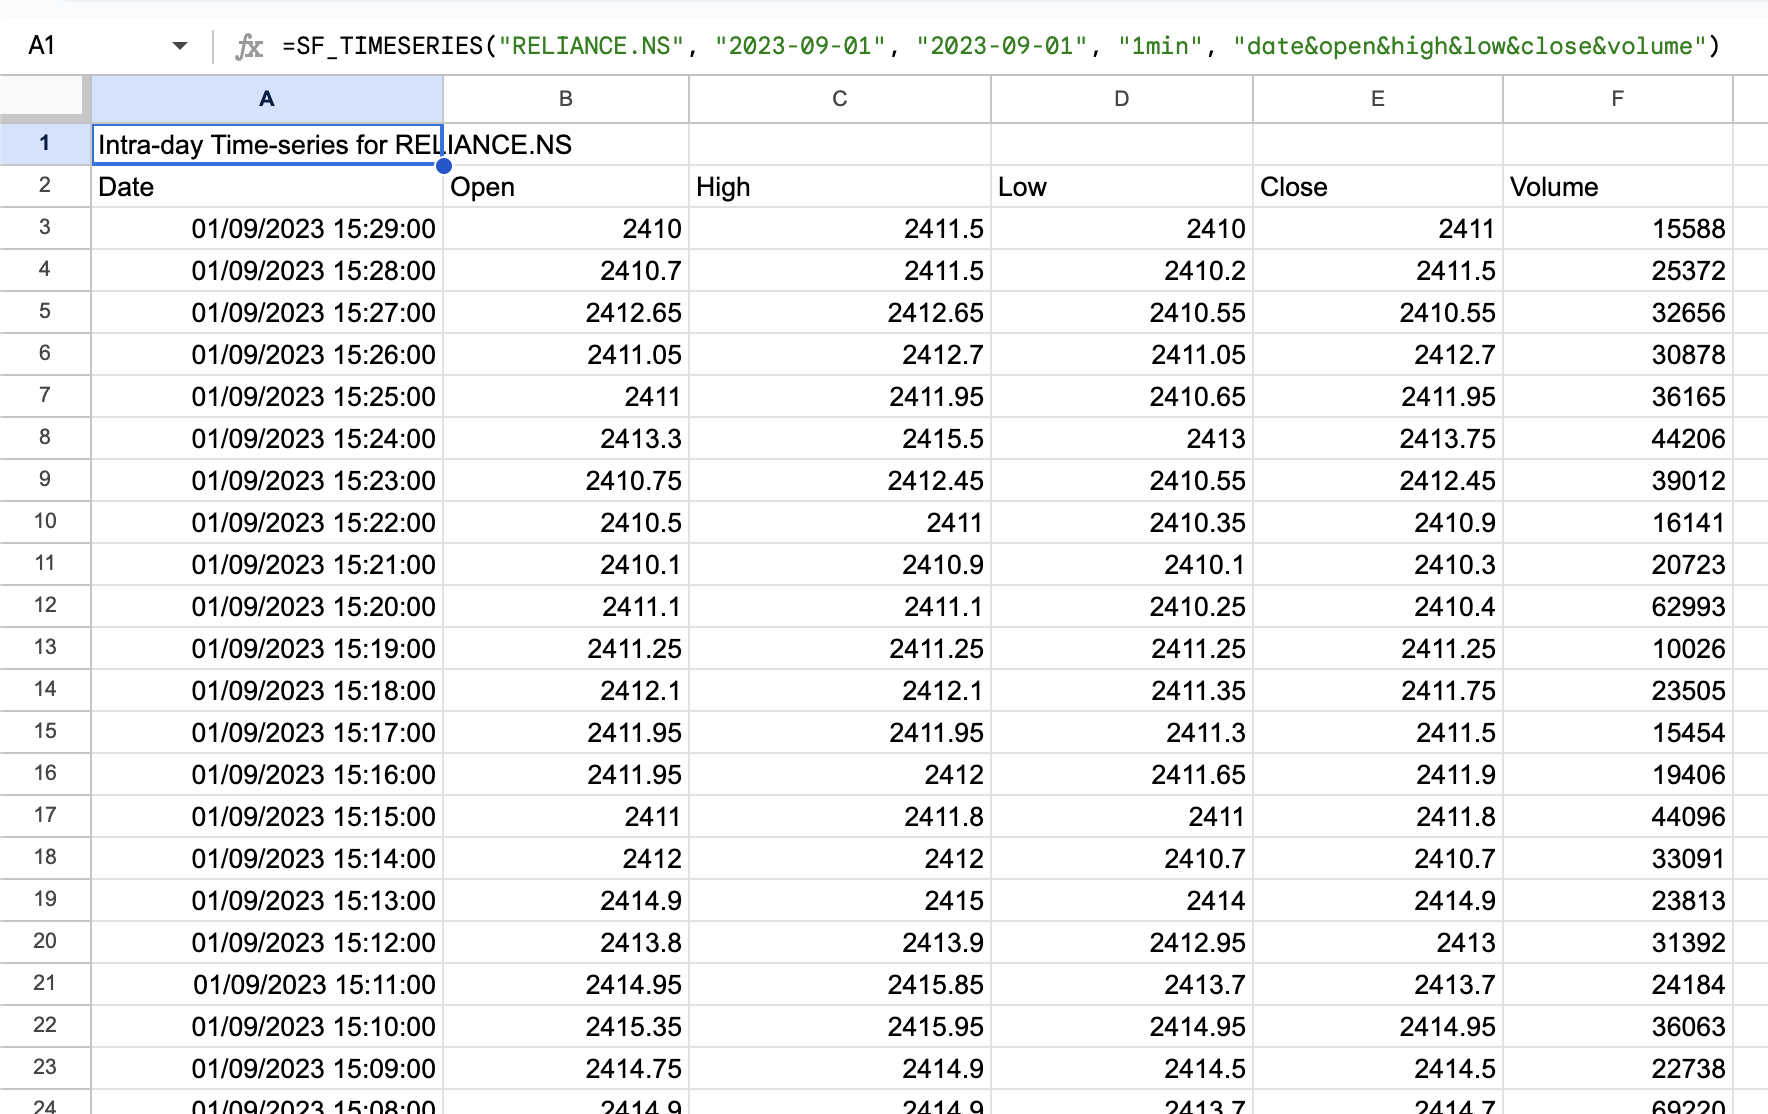
How to generate dividend data for Indian stocks
To generate 30+ years of dividend data for Indian stocks, we use the Dividend function. Let's generate the last 10 years of dividend data for the ticker RELIANCE.NS:
=SF_DIVIDEND("RELIANCE.NS", "2014-09-08", "2024-09-08", "all")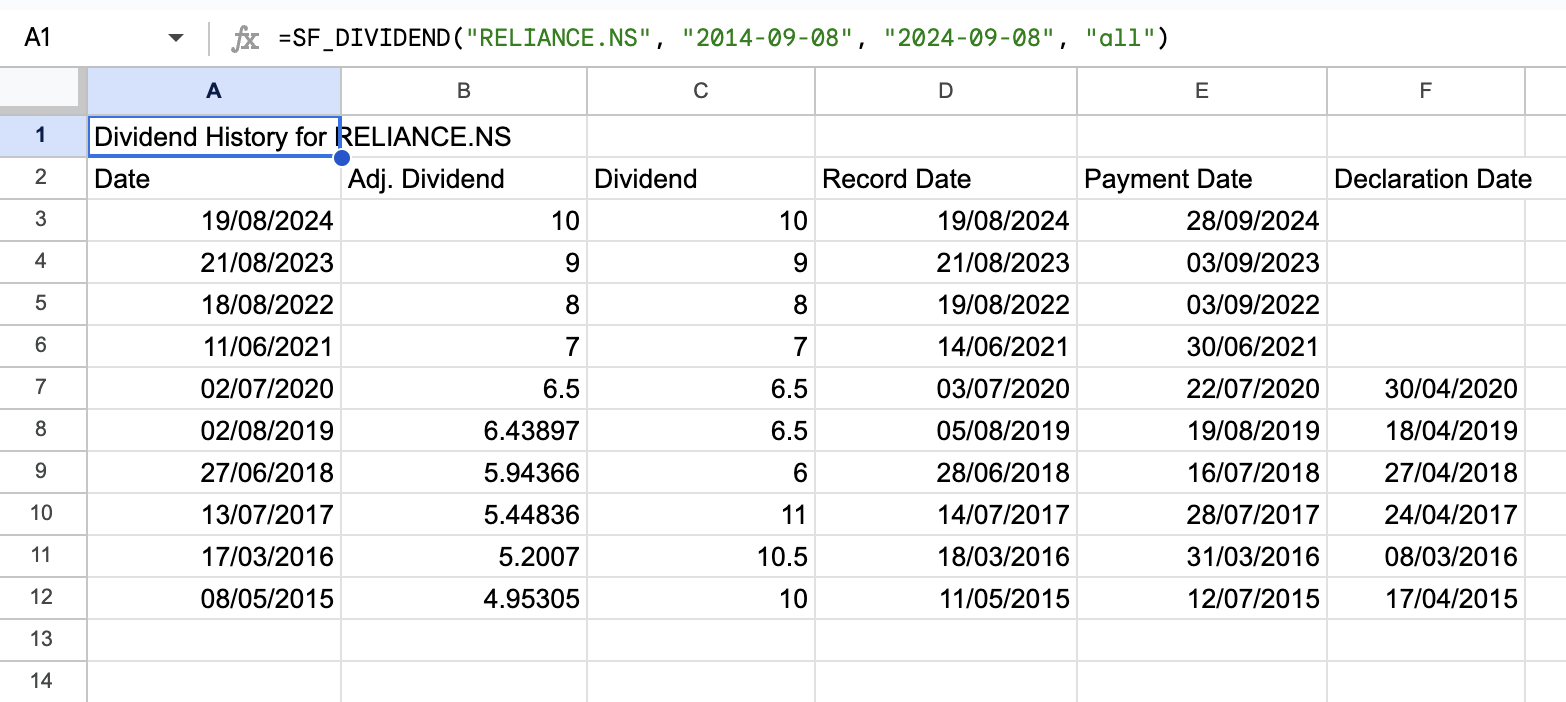
As with all our functions, if you want to see all the available metrics for the Dividend function just specify "all".
How to generate financial statements for Indian stocks
To generate financial statements for Indian stocks, we use the Financial Statements function. Let's generate the the 2023 income statement for the ticker RELIANCE.NS:
=SF("RELIANCE.NS", "income", "all", "2023")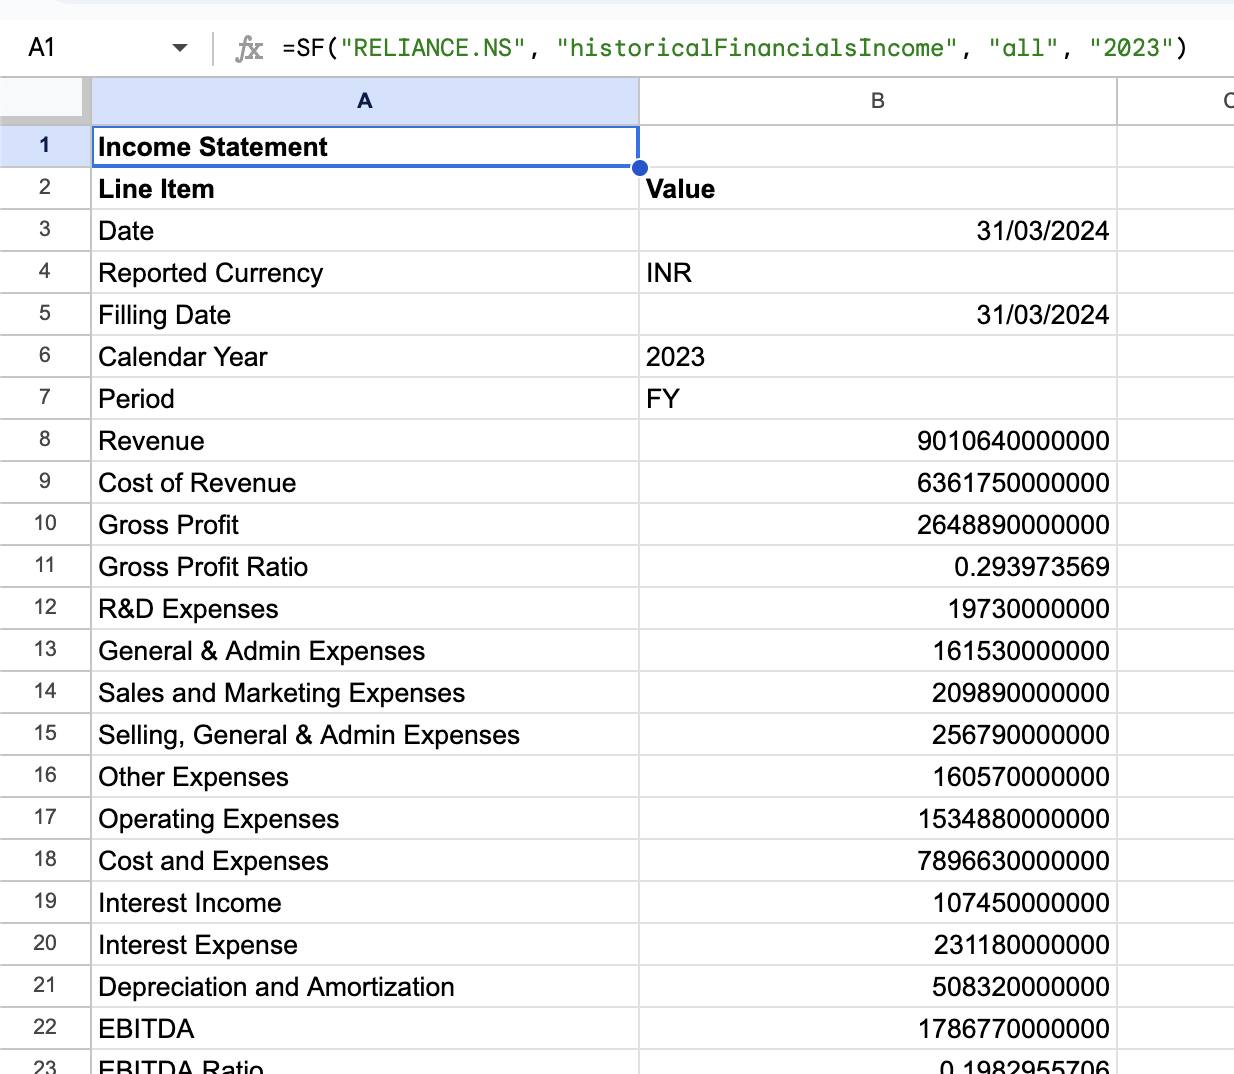
Often we want to see multiple years of statements side-by-side to analyse YoY growth. This can be done by specifying a range of years. Let's generate the last 10 years of income statements for the ticker RELIANCE.NS:
=SF("RELIANCE.NS", "income", "all", "2013-2023")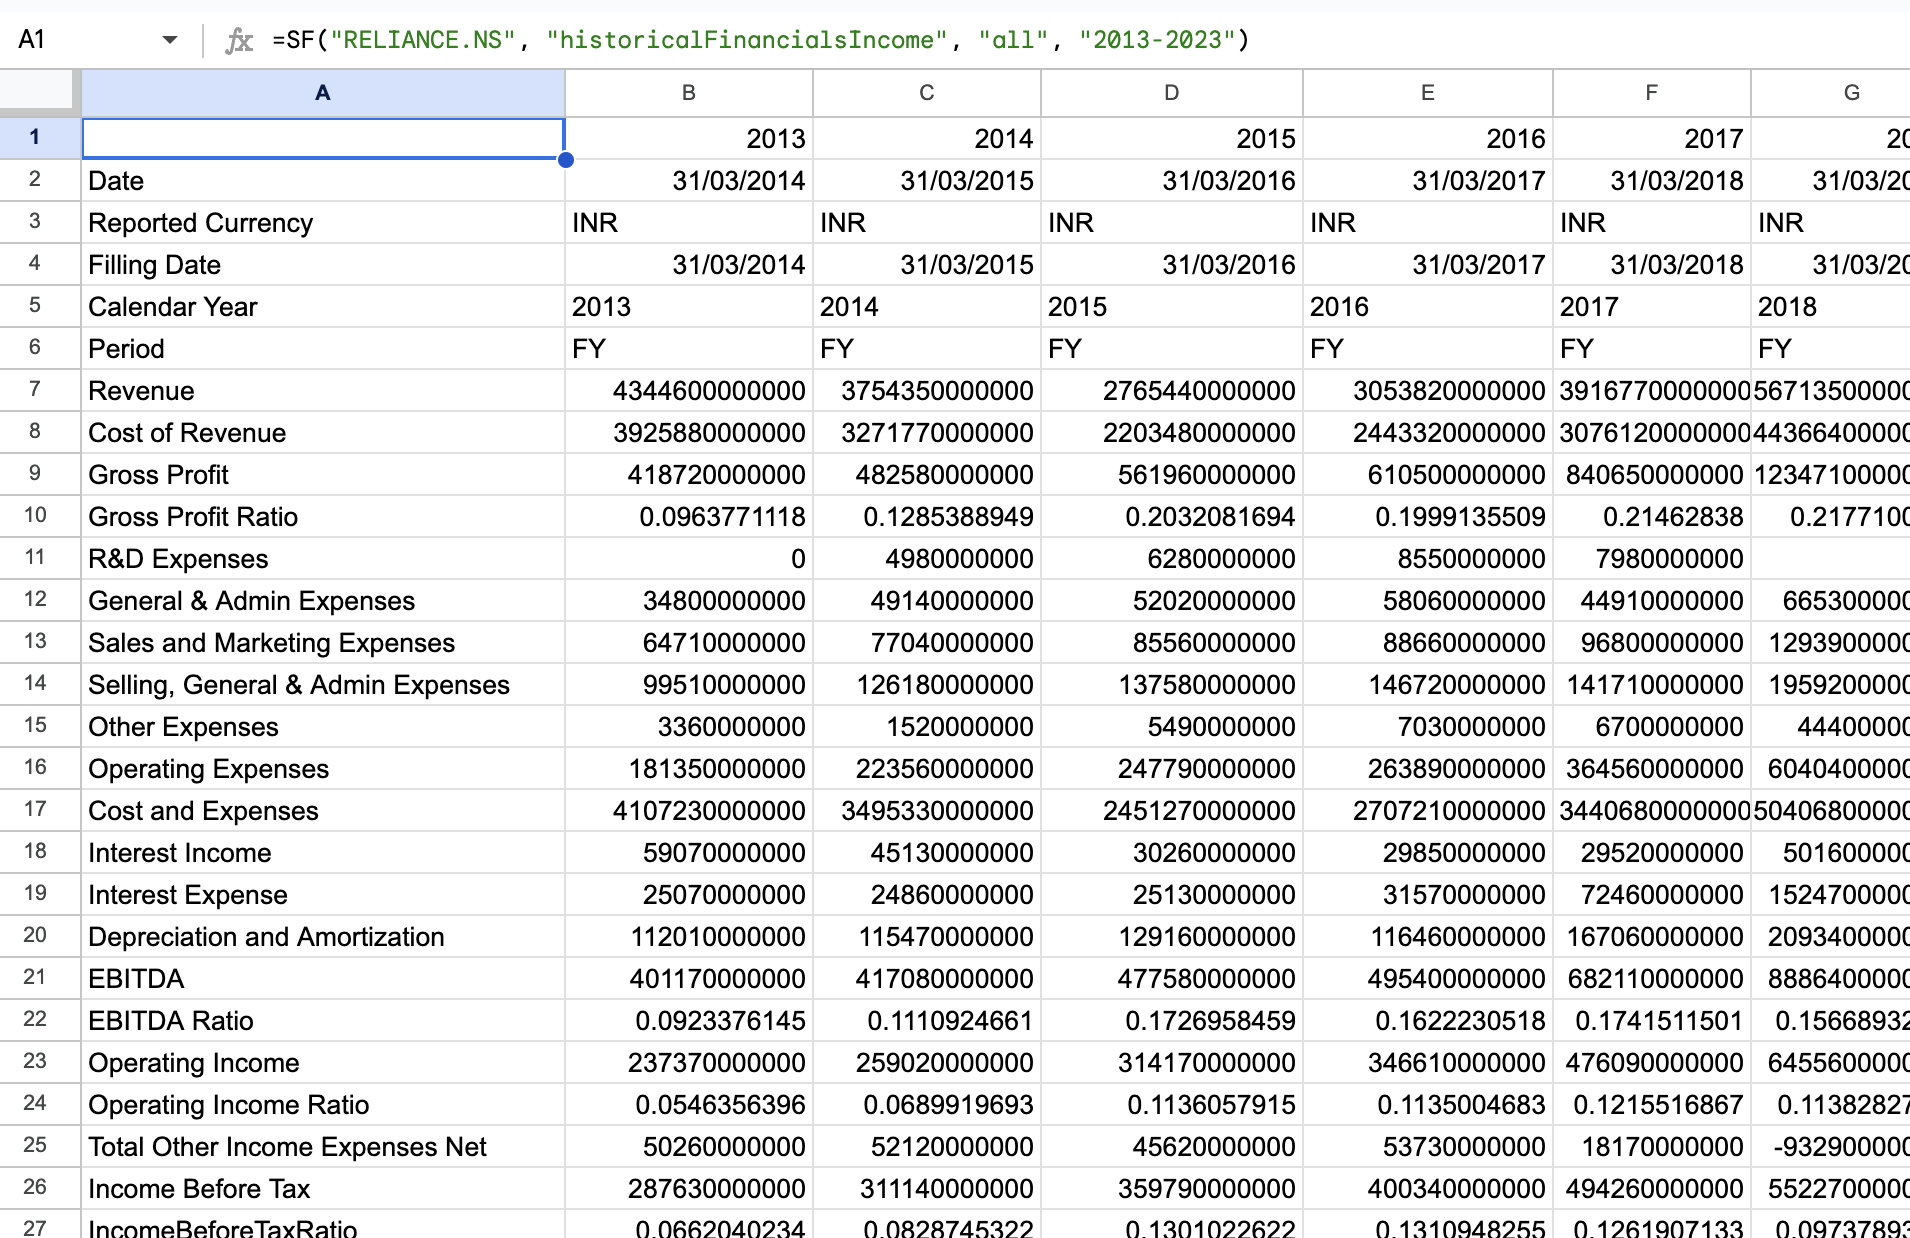
Of course, quarterly statements are available as well. Let's generate the last 2 years of quarterly cash flow statements for the ticker RELIANCE.NS:
=SF("RELIANCE.NS", "cashflowQ", "all", "2022-2023")For all the information on how to use the Financial Statements function, follow the link to our docs.
How to track upcoming earnings and dividend announcements for Indian companies
Lastly, let's cover how to track upcoming earnings and dividend announcements for Indian companies. SheetsFinance provides access to financial calendars for both the NSE and BSE, including earnings calendars, dividend calendars, and more.
To generate the earnings calendar for the NSE, we use the Financial Calendar function and specify the calendar type as "earnings". Let's generate the NSE earnings calendar for the month of September 2024:
=SF_CALENDAR(".NS", "earnings", "2024-09-01", "2024-09-30", "date&symbol")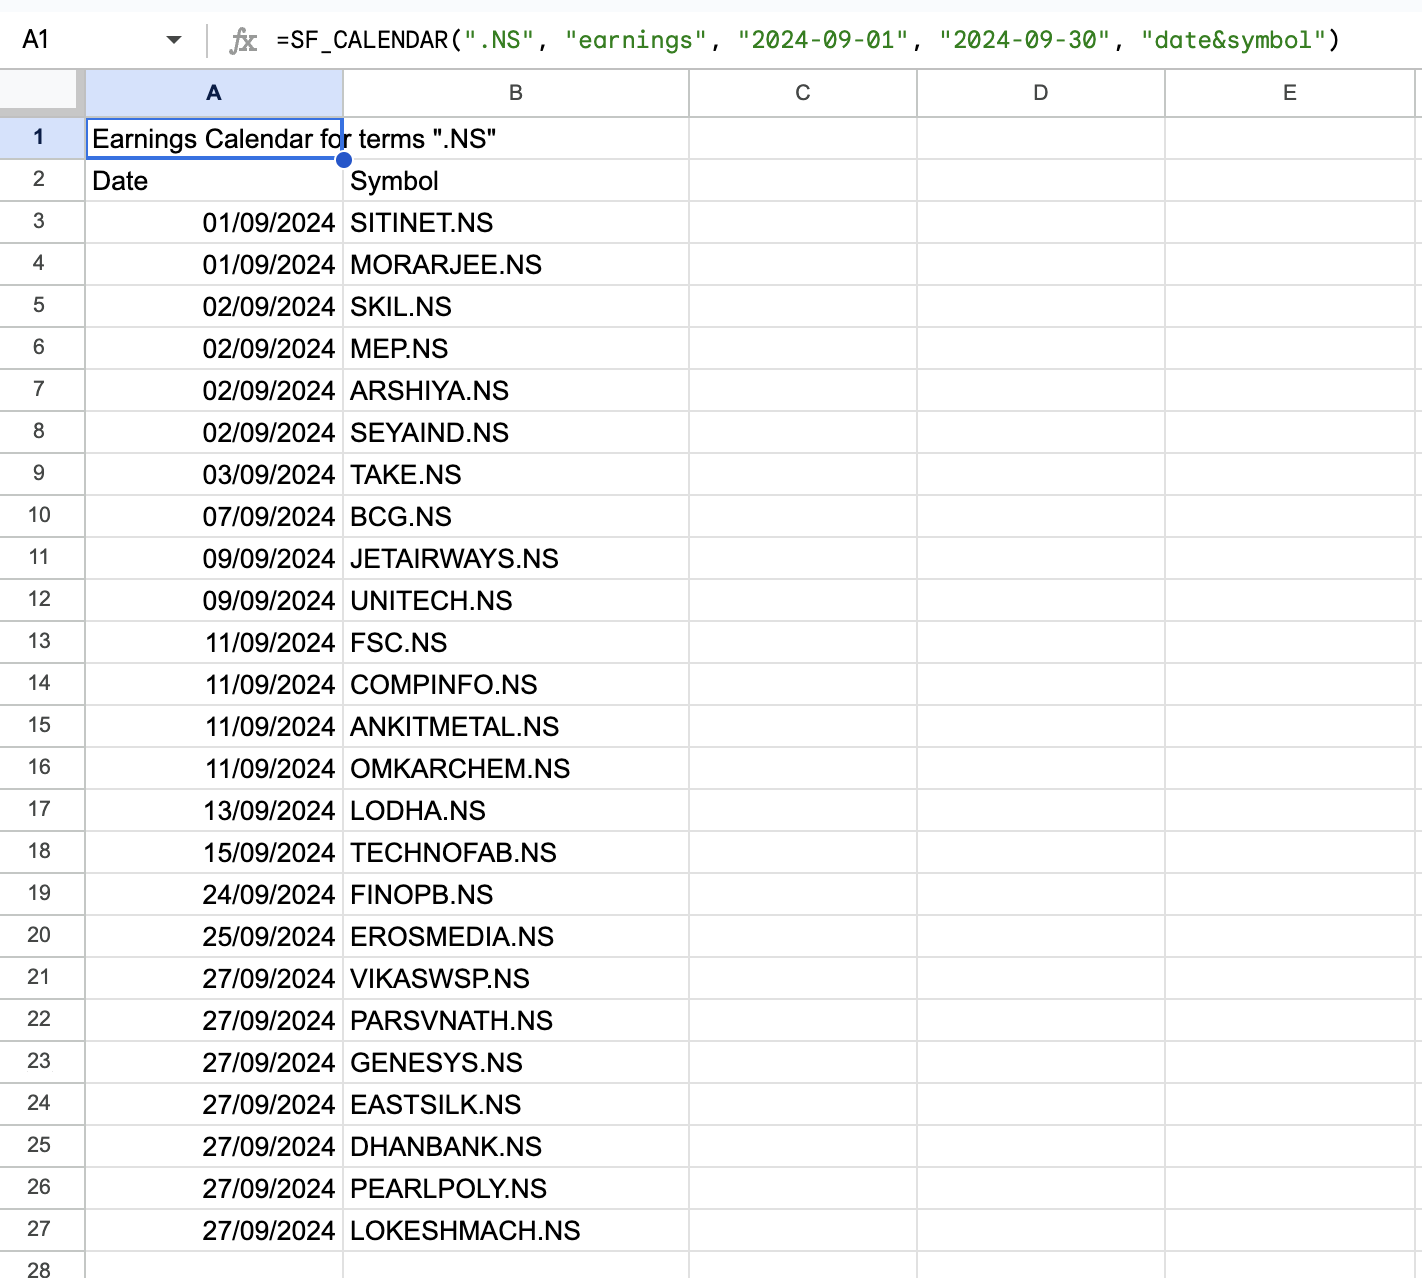
The first argument of the function expects a series of search terms to filter our database of over 80,000 stocks. In this case, we're using the .NS search term to filter for all NSE listed stocks. If we wanted to generate a calendar for both the NSE and BSE we would include both search terms: .NS, .BO using the & operator:
=SF_CALENDAR(".NS&.BO", "earnings", "2024-09-01", "2024-09-30")If you're instead after specific stock symbols (rather than entire exchanges) you can enter them directly and use the $ operator to ensure you get an exact match. For example, to generate the earnings calendar for only SEYAIND.NS, HGS.BO and NXST.BO:
=SF_CALENDAR("SEYAIND.NS&$HGS.BO&$NXST.BO", "earnings", "2024-09-01", "2024-09-30")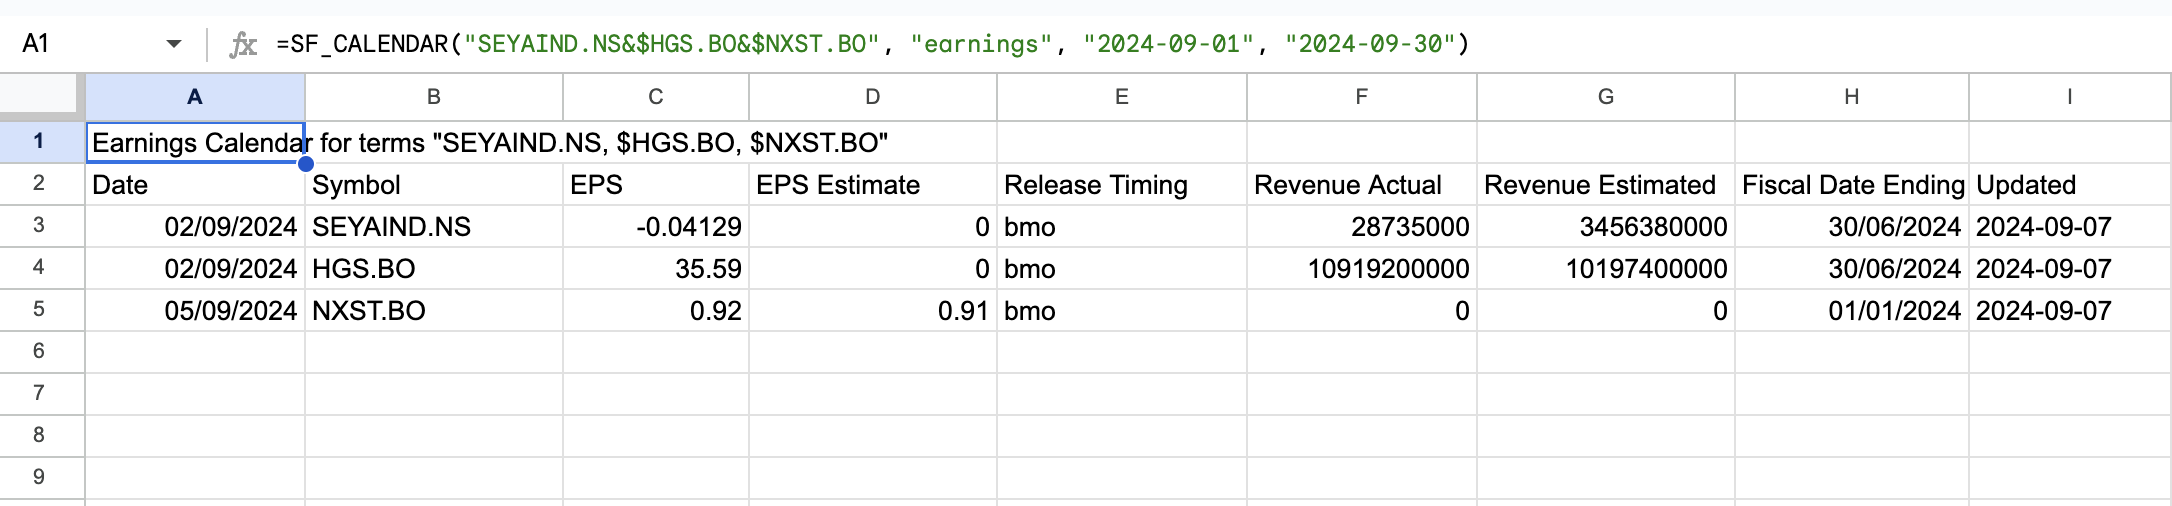
Dividend calendars can be generated in the same way, but by specifying the calendar type as "dividends":
=SF_CALENDAR(".NS&.BO", "dividends", "2024-09-01", "2024-09-30","date&symbol÷nd")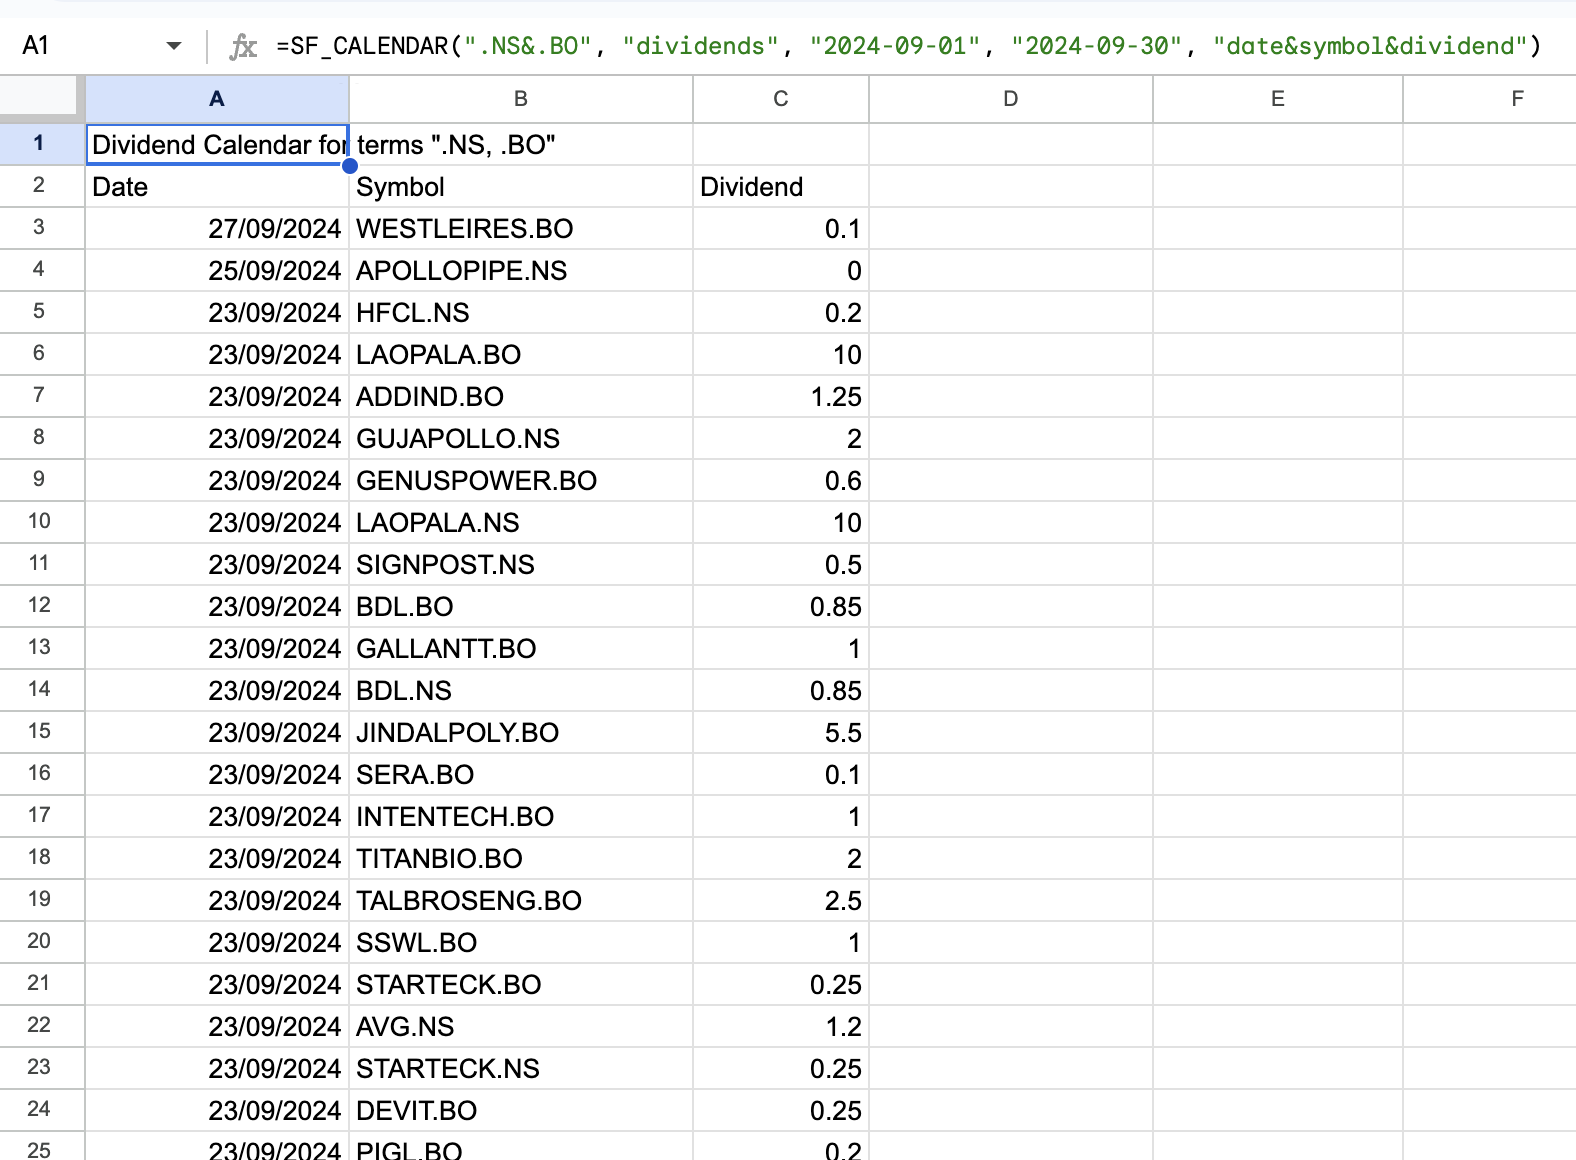
Using the Function Generator to build these functions for you
Feeling a bit overwhelmed by all the functions? Don't worry, we've got you covered 😁
Our Function Generator is a tool that builds these functions for you. Just select the function you want to use, input the required parameters, and the Function Generator will generate the function for you and automatically insert it into your Google Sheet. You can find the Function Generator in the Google Sheets under Extensions > SheetsFinance > Function Generator.
Finding the correct ticker symbol
If you aren't sure what ticker to use for a certain company, either use the Symbol Search tool within Google Sheets (Extensions > SheetsFinance > Symbol Search), or online at Symbol Search.
That's where we'll leave it for this guide on tracking the Indian stock markets in real-time with Google Sheets. We have a tonne more data available for Indian stocks, so if you're interested in learning more, check out our documentation for a full list of available functions and metrics.