Track US Stock Markets (NYSE & NASDAQ) in Real-Time with Google Sheets 🇺🇸
The US stock markets are some of the largest and most liquid markets in the world. With companies listed on the New York Stock Exchange (NYSE) and the NASDAQ, there are abundant opportunities for investors to tap into a wide range of industries and growth stories.
In this article, we're going to show you how to track the US stock markets in real-time using Google Sheets and the SheetsFinance add-on. With SheetsFinance, you can access a variety of financial data, including stock prices, company information, and more, all directly within Google Sheets.
Both the NYSE and NASDAQ are available as second-accurate real-time data feeds within SheetsFinance. You can check which markets are available in real-time by visiting our Available Markets page. Additionally, you have access to 30+ years of historical OHLCV data, dividends, financial statements, ratios, and more for US stocks.
SheetsFinance also provides access to US financial calendars, such as earnings and dividend calendars, allowing you to track important events and announcements for US companies.
Let's dive in.
What we'll cover today:
- How to pull real-time stock prices, volume, key metrics, and more for up to 5000 US stock symbols in one function.
- How to generate 30+ years of dividend, financial statements, and OHLCV pricing data for any US stock symbol.
- How to track upcoming earnings and dividend announcements for US companies using Financial Calendars.
- Analysing insider trading activity using our Insiders function.
🧑🏽💻 Prerequisite: Before we get started, make sure you have the SheetsFinance add-on installed and linked to your Google account. If not, follow this guide. You can try SheetsFinance for free with no payment details required for 15 days.
How to pull real-time stock prices for US stocks (NYSE and NASDAQ)
Let's start with the basic function. Open a new sheet and run the following function to load the real-time stock price for the ticker AAPL:
=SF("AAPL")💡 Learning Moment: The
SFfunction defaults to the"realTime"function with the metric"price". Therefore=SF("AAPL")is the same as=SF("AAPL", "realTime", "price").
To retrieve additional metrics, such as price, volume, EPS, and P/E ratio for AAPL, specify them in the "realTime" function using the & operator:
=SF("AAPL", "realTime", "price&volume&eps&pe")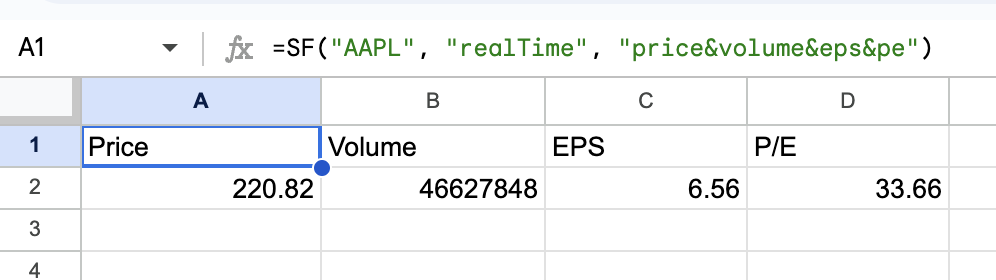
Want to see all available metrics? Use all:
=SF("AAPL", "realTime", "all")How to pull real-time stock prices for multiple US stocks at once
SheetsFinance supports pulling data for up to 5000 stock symbols simultaneously! These are our "batch" functions. For example, list a range of tickers in column A and use the batch function to load the price, volume, P/E ratios, and EPS for each stock:
=SF(A2:A15, "realTime", "price&volume&pe&eps&open")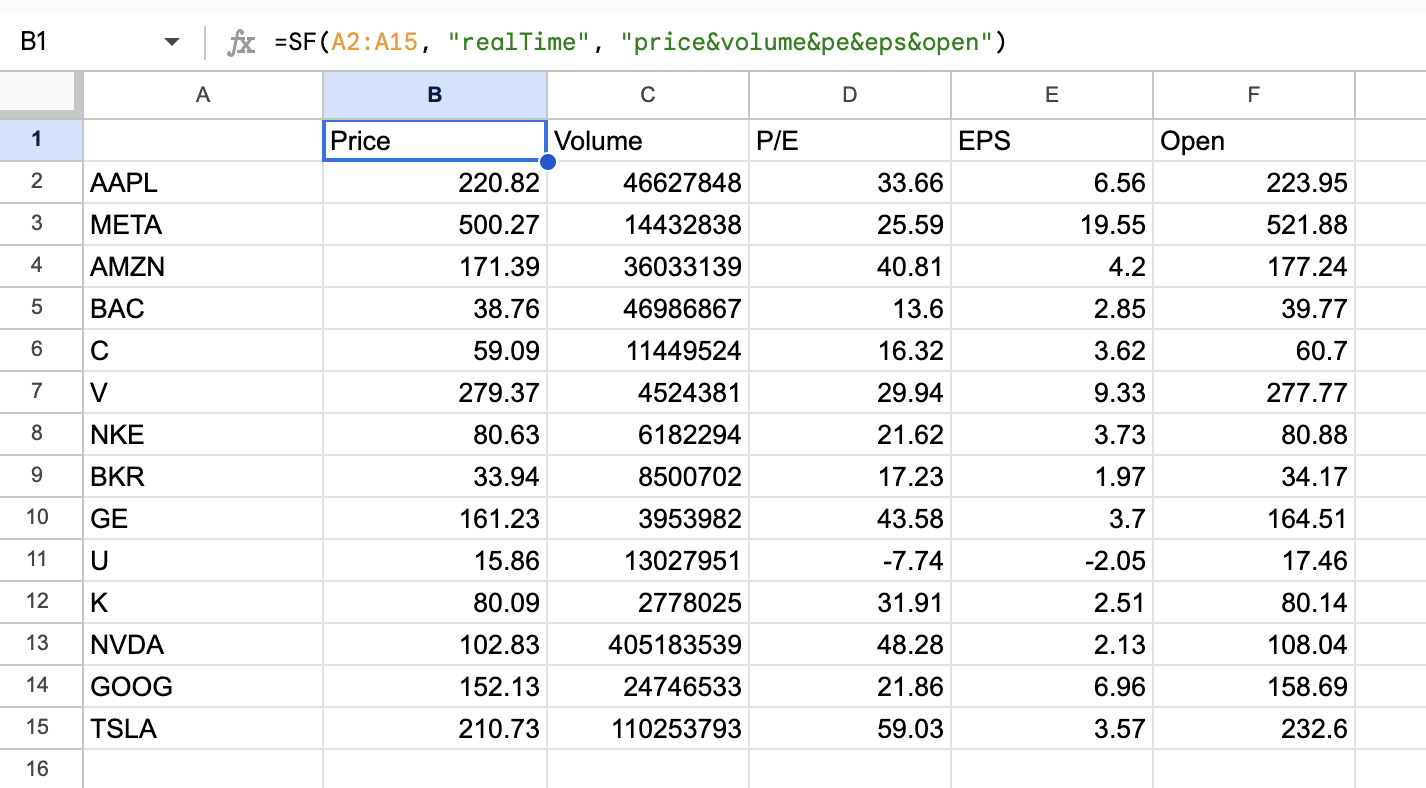
🎬 See it in action: Check out this YouTube walkthrough for an example of our batch functions in action.
How to generate 30+ years of dividend, financial statements, and OHLCV pricing data for US stocks
SheetsFinance offers 30+ years of historical data for US stocks, including OHLCV, dividend data, financial statements, and more.
How to generate OHLCV data for US stocks
SheetsFinance's Time-series functions allow you to retrieve daily, inter-day, and intra-day OHLCV data. Here's an example to generate daily OHLCV data for AAPL:
=SF_TIMESERIES("AAPL", "2023-01-01", "2024-09-08", "daily", "date&open&high&low&close&volume")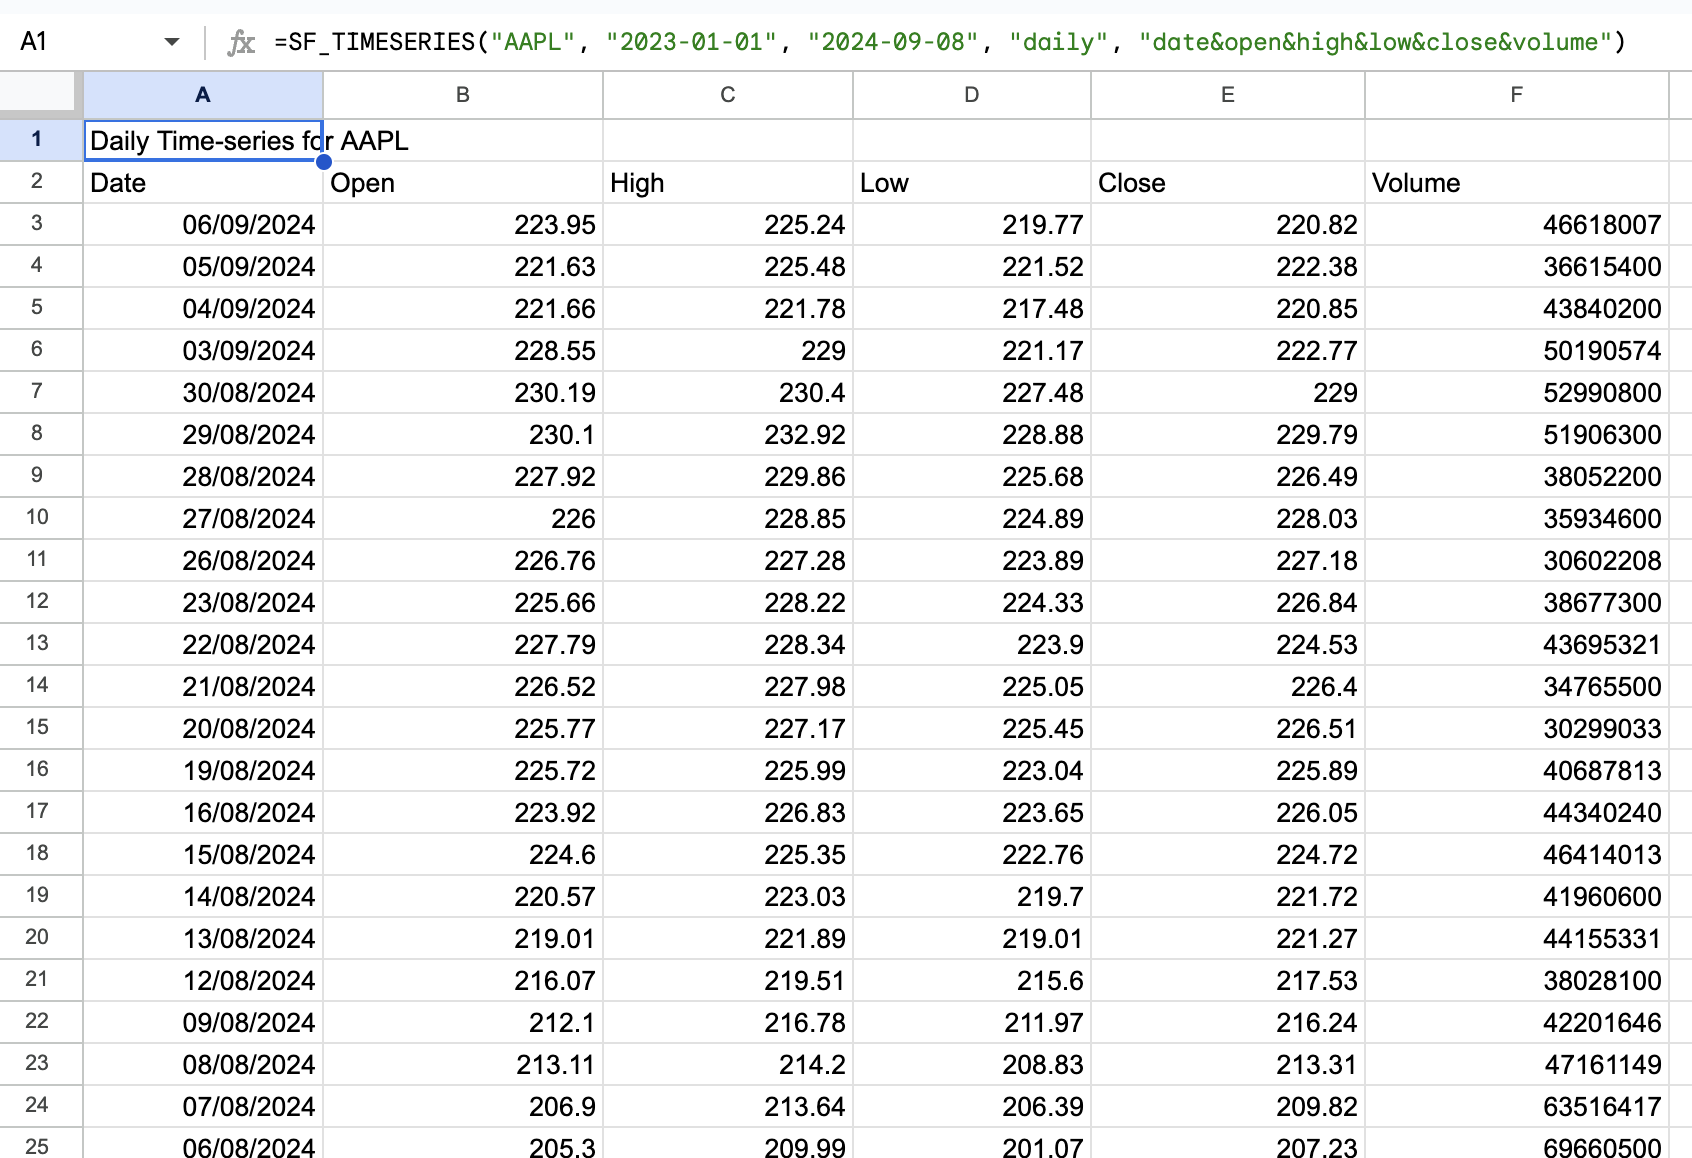
You can also generate inter-day and intra-day data by specifying the period, for example "1min", "5min" or "1hour". Let's generate 5-minute data for AAPL:
=SF_TIMESERIES("AAPL", "2024-09-01", "2024-09-08", "5min", "date&open&high&low&close&volume")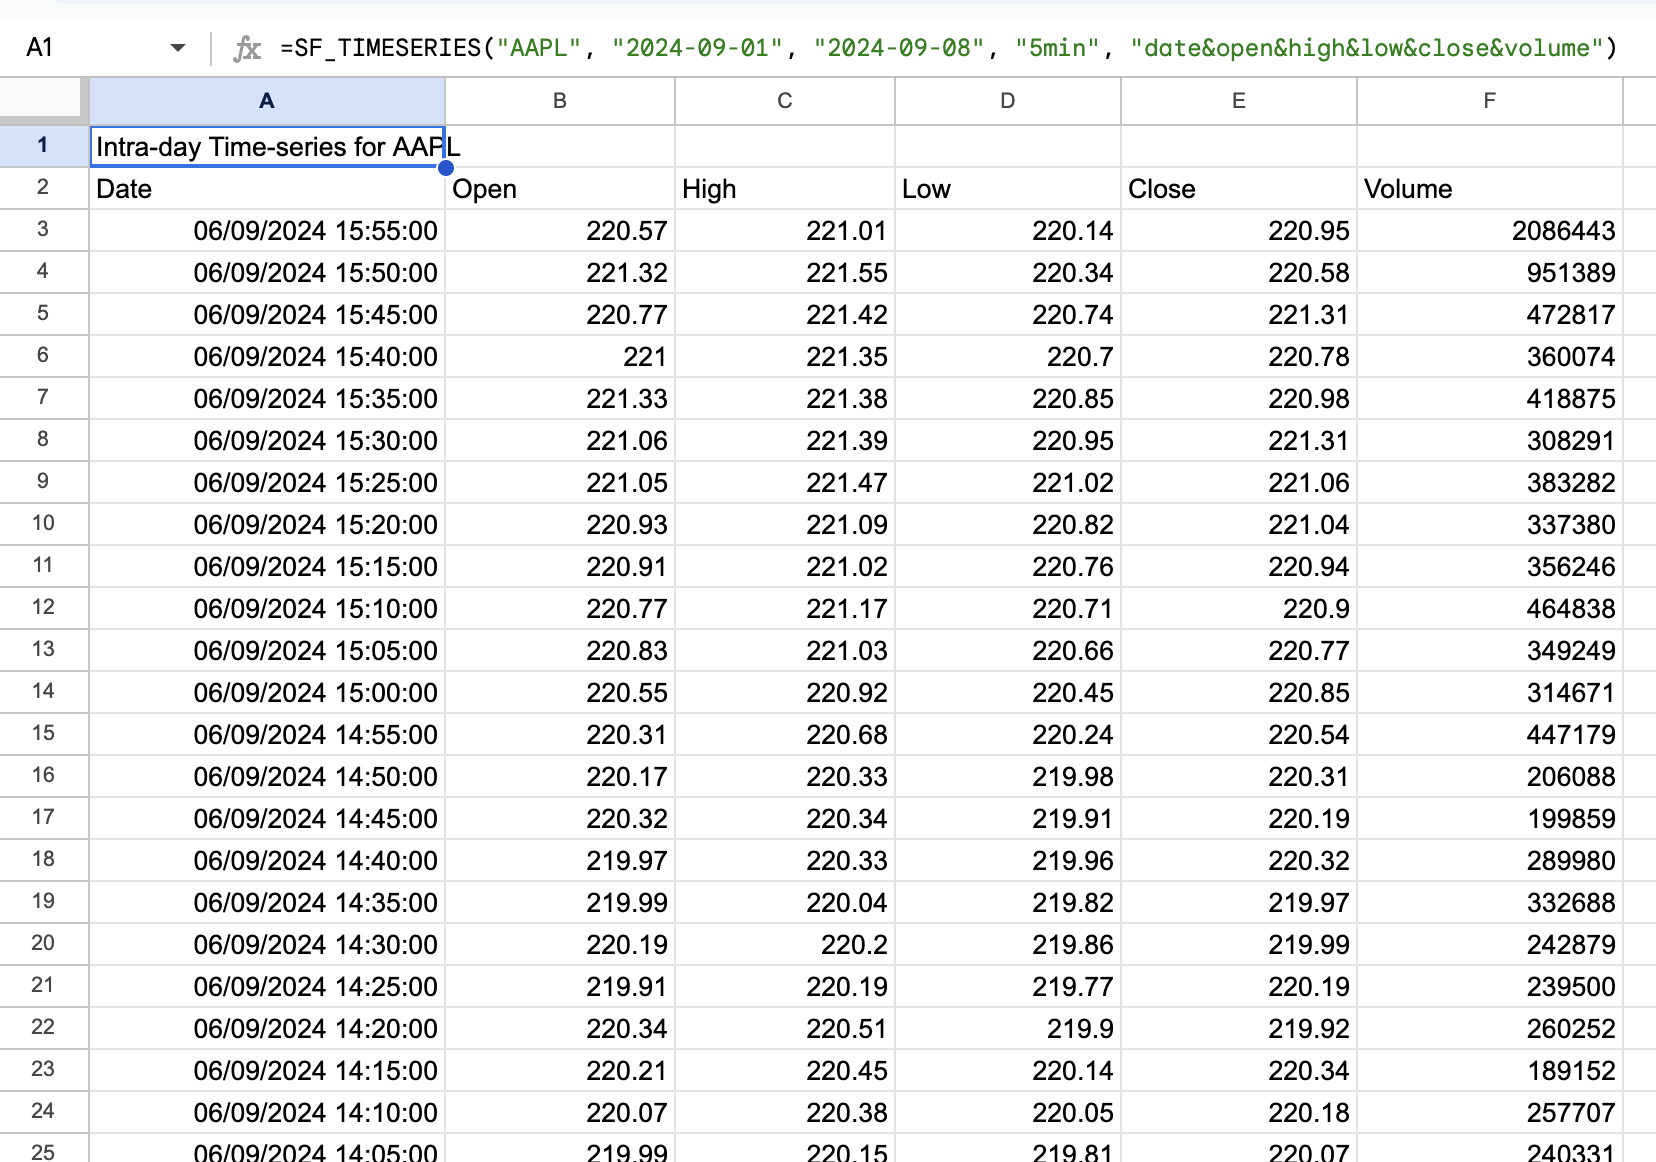
How to generate dividend data for US stocks
SheetsFinance provides access to 30+ years of dividend data for US stocks through the use of our Dividend function.
You can load the last 10 years of dividend data for AAPL like so:
=SF_DIVIDEND("AAPL", "2014-09-08", "2024-09-08", "all")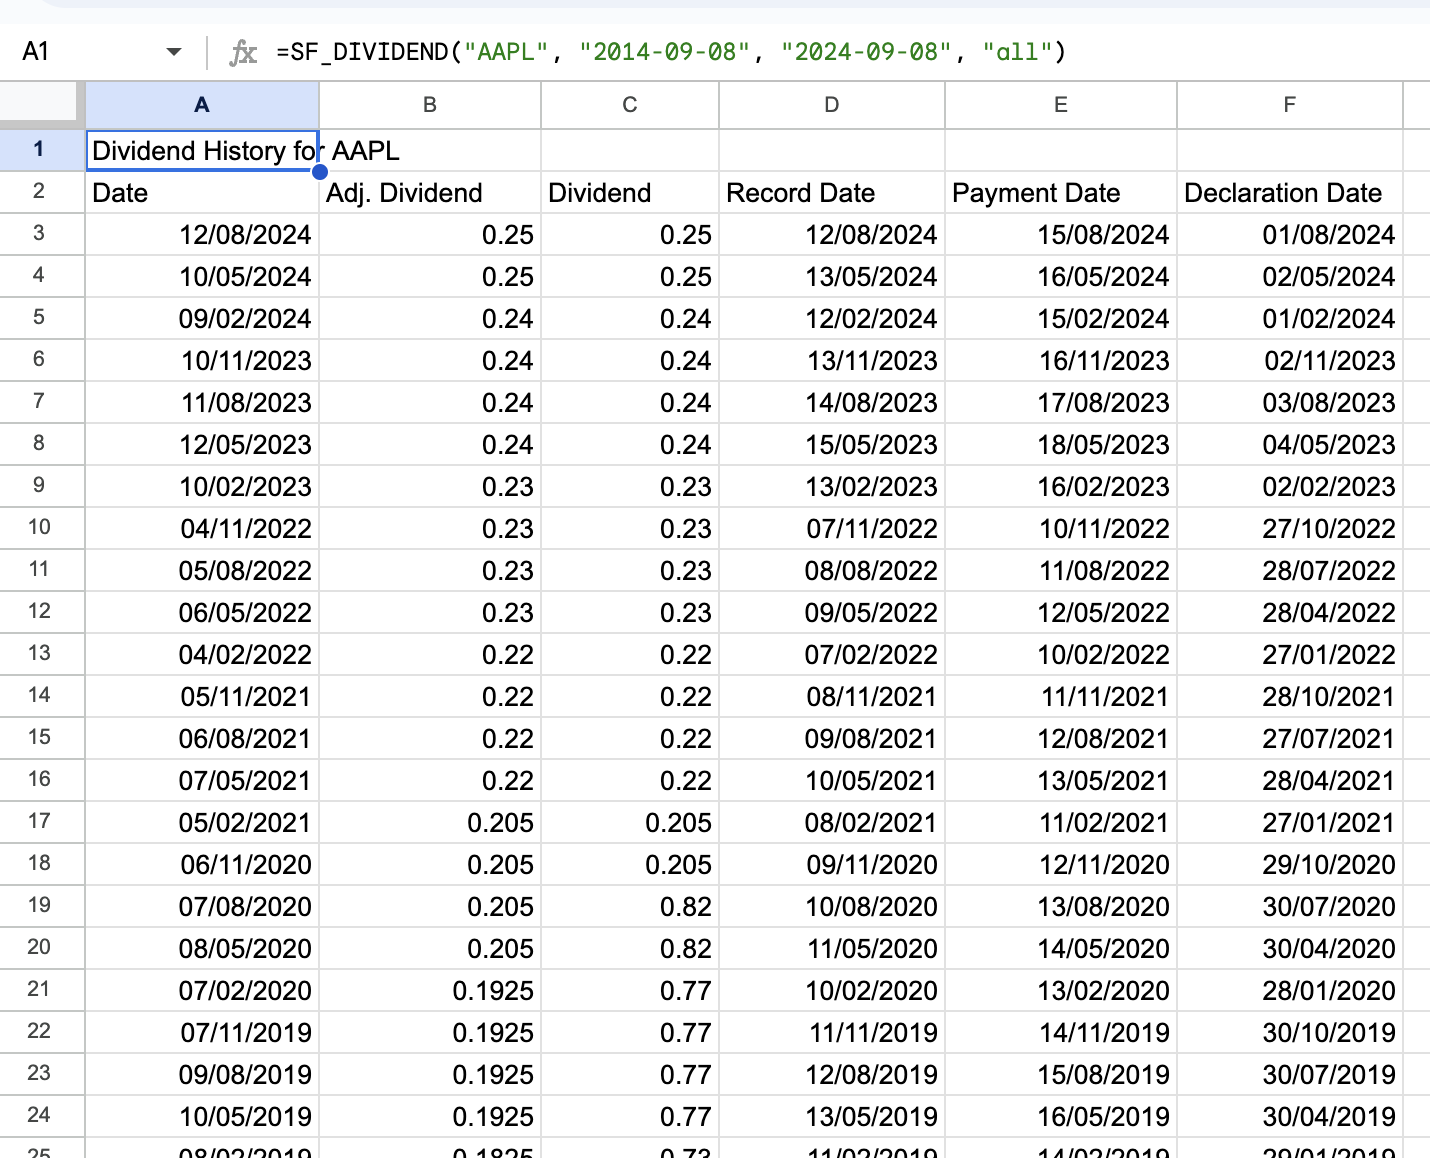
How to generate financial statements for US stocks
Retrieve financial statements using the Financial Statements function. This function gives you access to 30+ years of consolidated annual and quarterly statements sourced from SEC filings.
Let's generate the 2023 income statement for AAPL:
=SF("AAPL", "income", "all", "2023")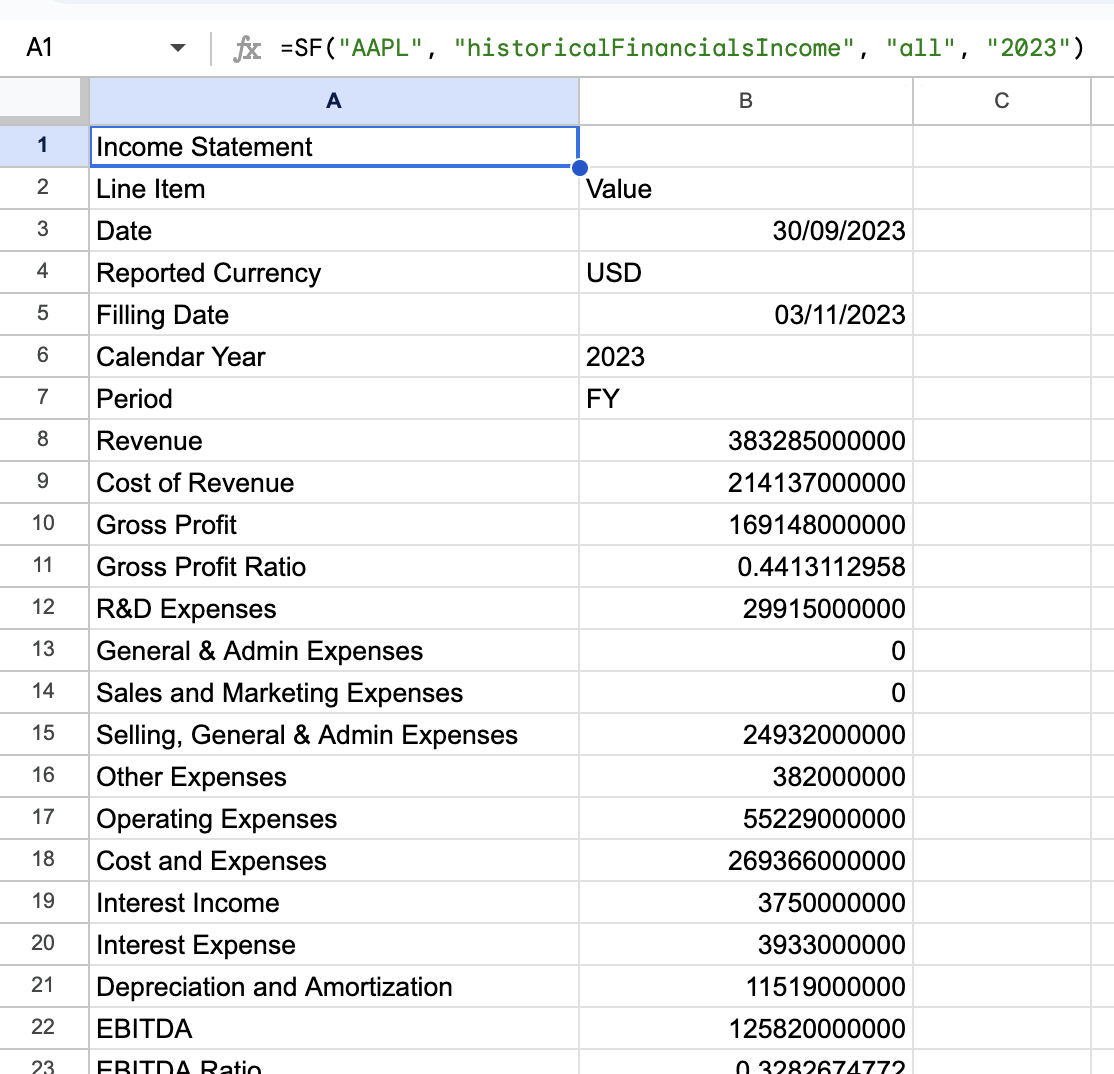
Often you may want to generate financial statements for multiple years to analyse the company's performance over time. Generating multiple years of consolidated financials is as easy as inputting a range of years. For example let's generate 10 years of balance sheets for AAPL:
=SF("AAPL", "balancesheet", "all", "2013-2023")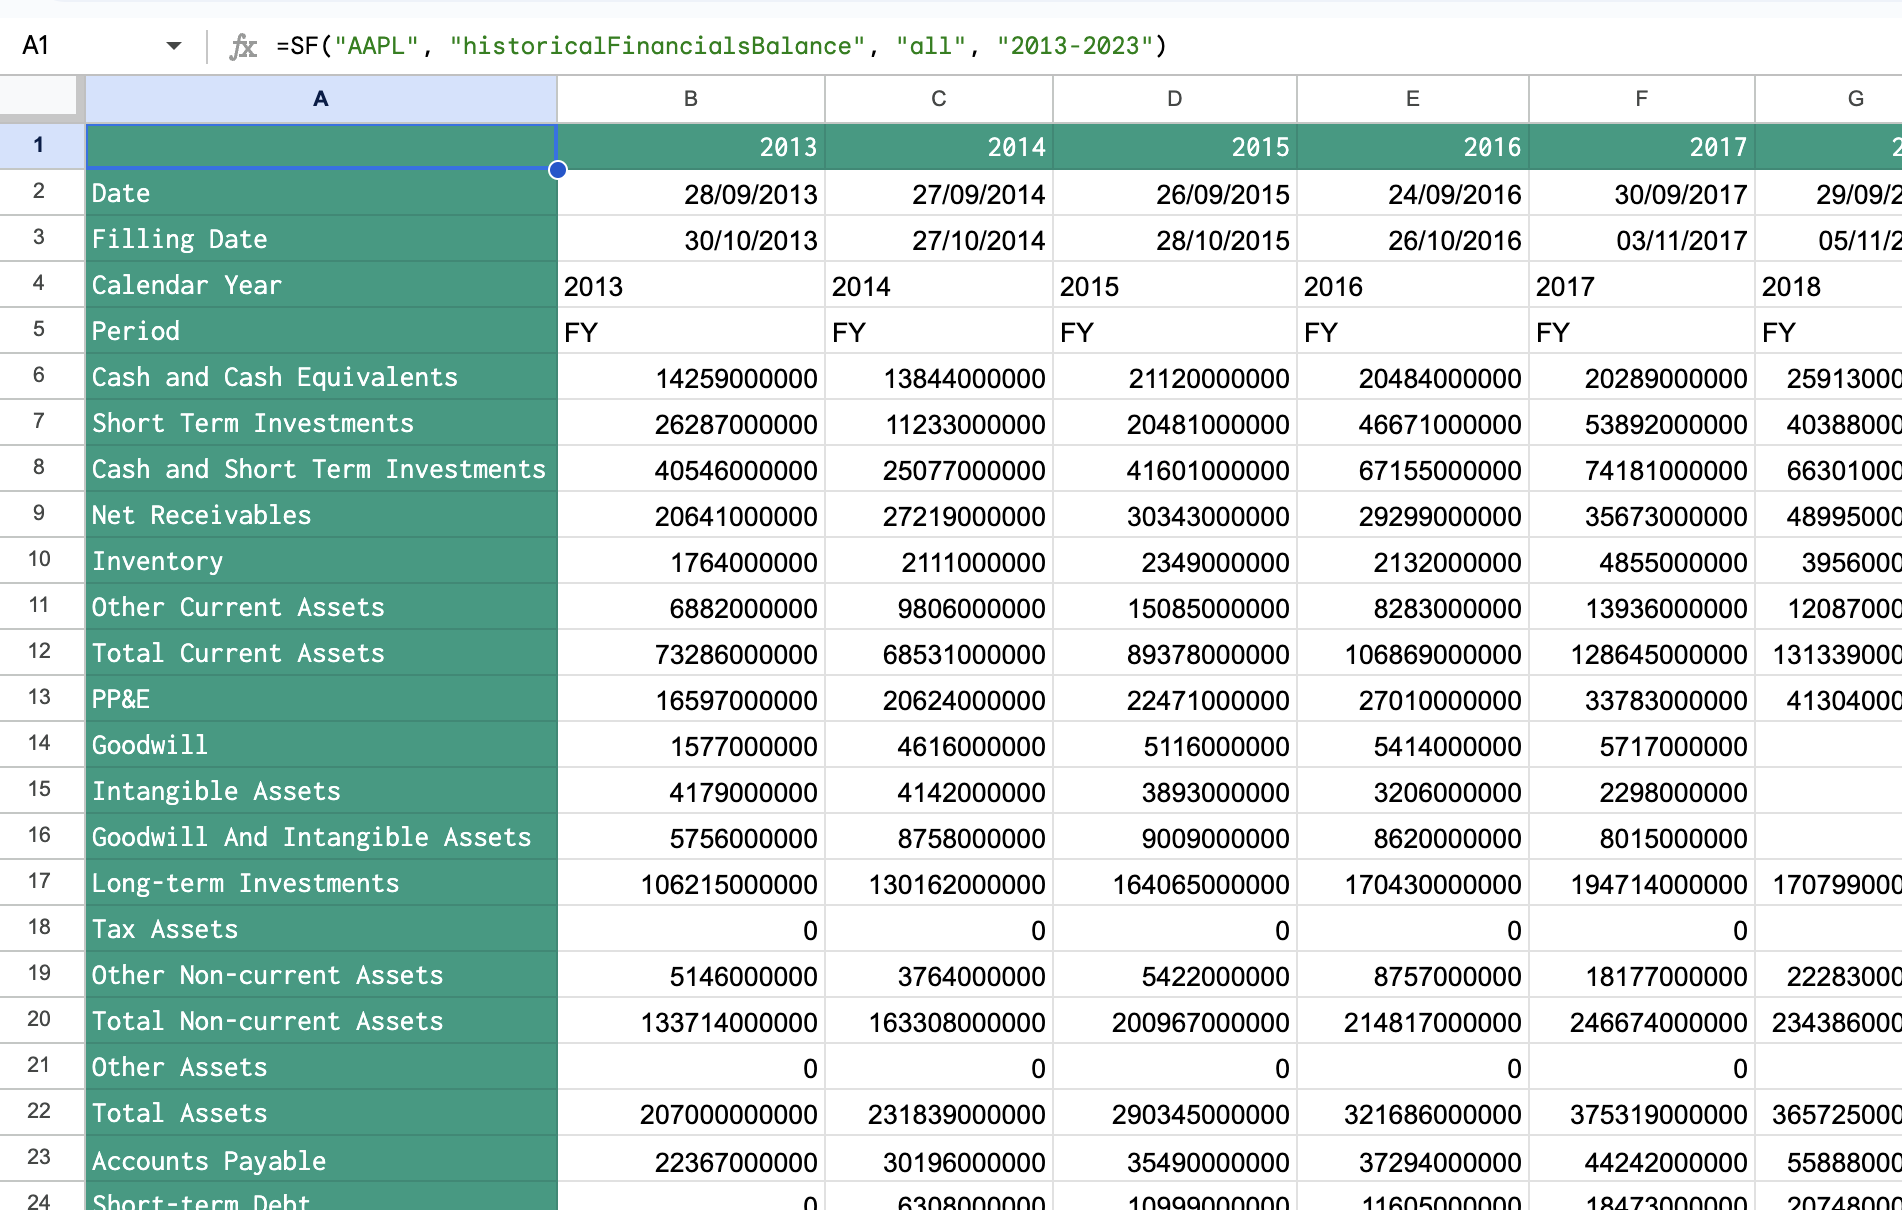
You can read all about how to use the powerful Financial Statements function in our documentation.
How to track upcoming earnings and dividend announcements for US companies
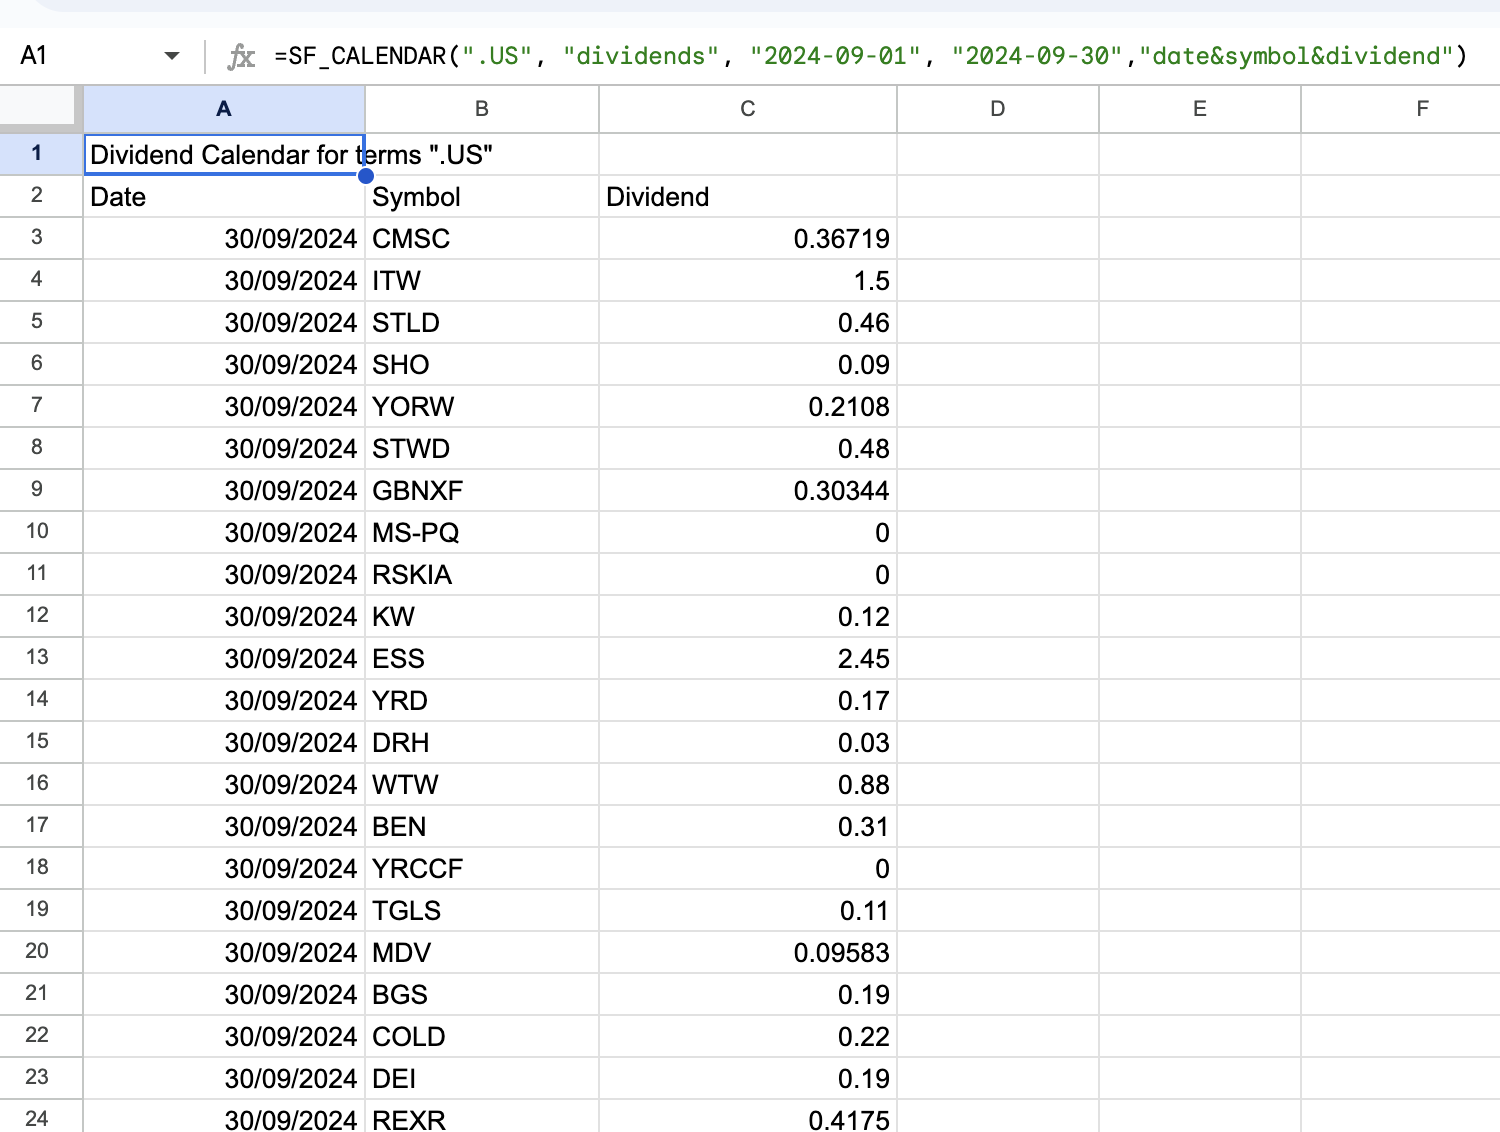
SheetsFinance provides access to financial calendars directly from within Google Sheets by using the Financial Calendars function. Using this function, you can track upcoming earnings and dividend announcements for US markets. Just specify the search terms and the calendar type:
=SF_CALENDAR(".US", "dividends", "2024-09-01", "2024-09-30","date&symbol÷nd")🔥 Hot Tip: Enter the search term
".US"to specify US markets.
You can generate an earnings calendars similarly by specifying the calendar type as "earnings". You also don't have to generate data for the entire market, instead you can specify specific stocks by chaining them together with the & operator, just be sure to use the exact match ($) operator to ensure the search is exact:
=SF_CALENDAR("$AAPL&$MSFT&$GOOG&$AMZN", "earnings", "2024-07-01", "2024-10-30","all")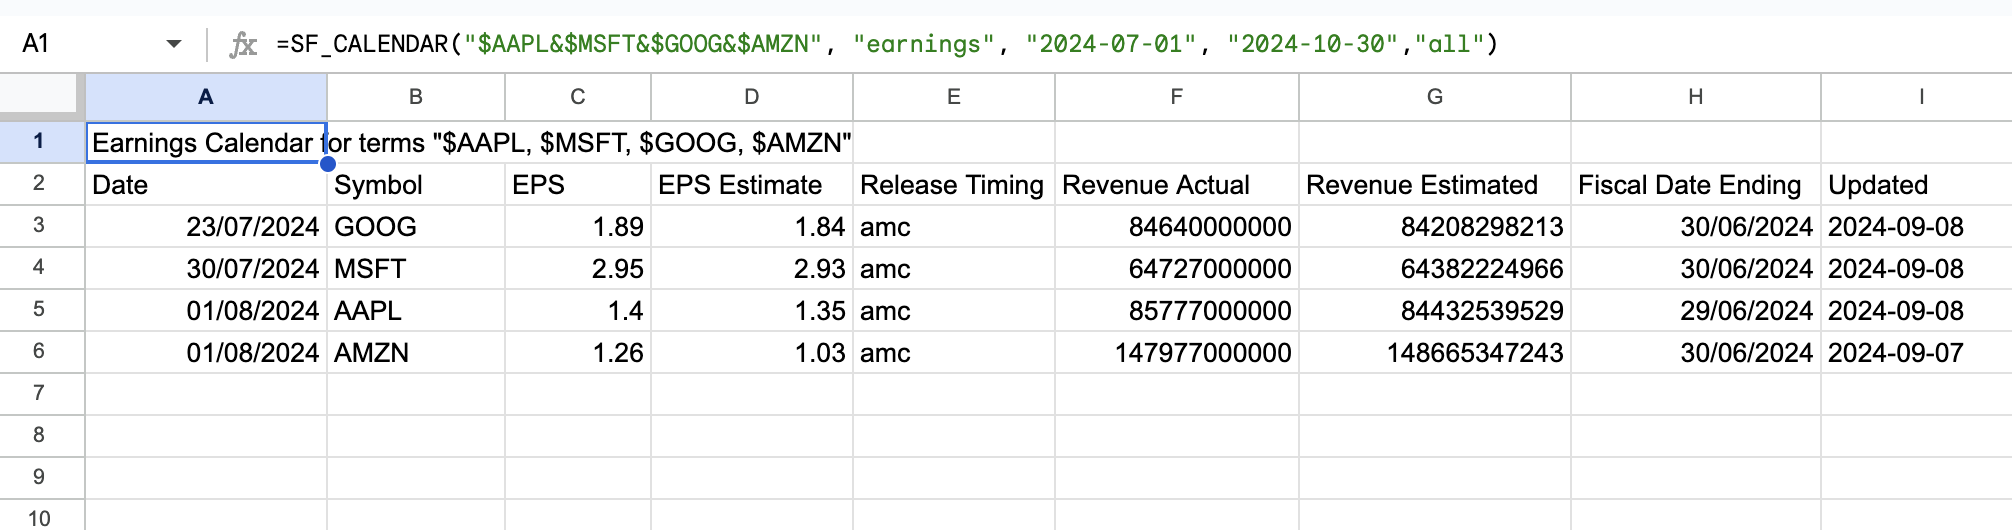
Analysing insider trading activity using the Insiders function
SheetsFinance provides access to insider trading data for US stocks. To generate insider trading transaction data for AAPL:
=SF("AAPL", "insiders")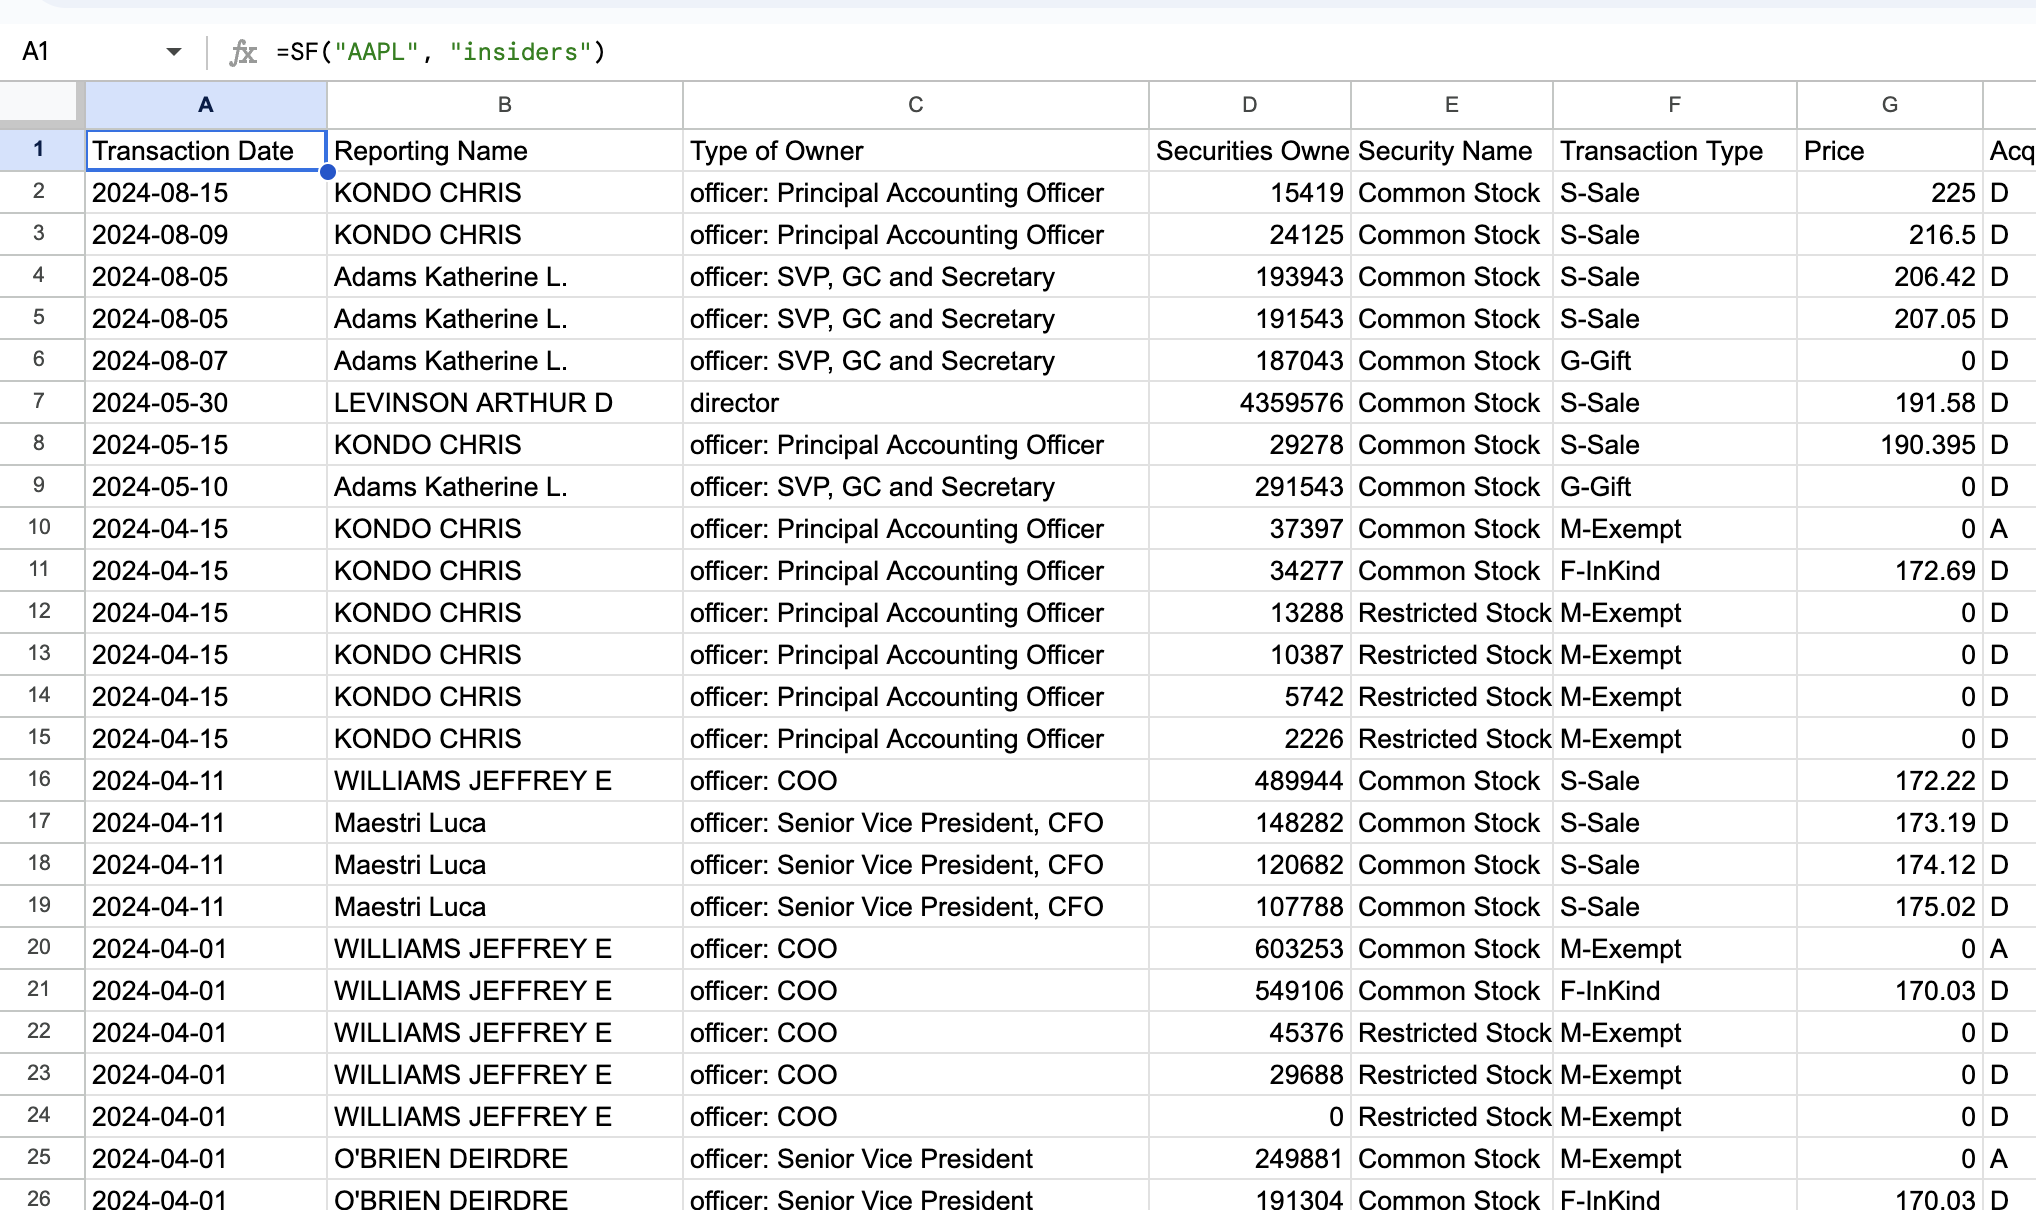
Insider transaction data provides up to the last 400 transactions, including the transaction date, type, and the number of shares traded. To analyse insider activty over more years you can use our Insider Statistics function to get a summary of insider trading activity on a quarterly basis:
=SF("AAPL", "insiderStats", "all", "2013-2023")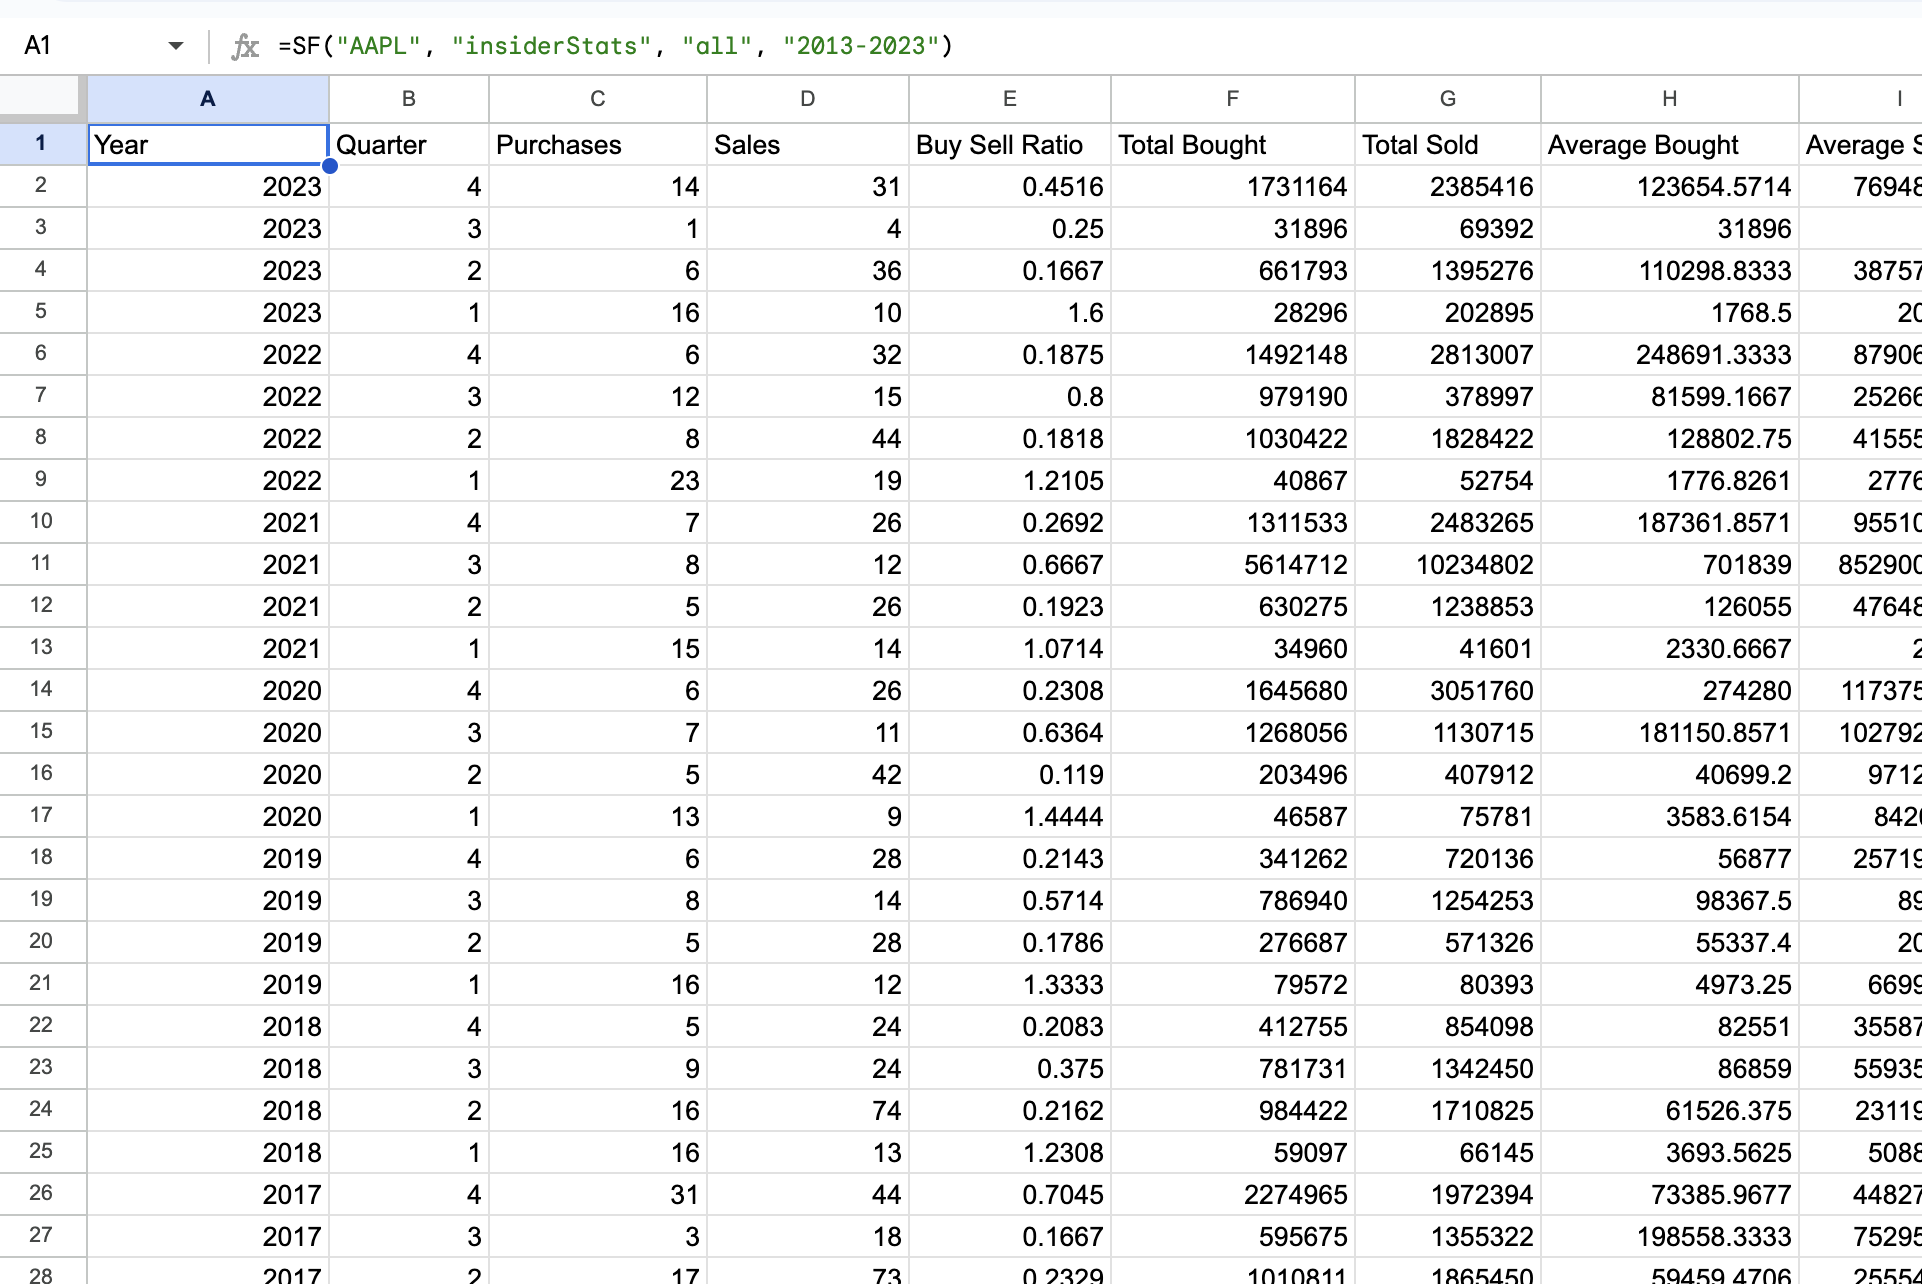
Using the Function Generator to build these functions for you
Feeling overwhelmed by all these functions? Don't panic, we've got you covered 😎
Open our Function Generator and have it build your functions for you. You kind find the generator under Extensions > SheetsFinance > Function Generator in Google Sheets. It gives you the ability to explore all our available functions and automatically generate the function you need with a few clicks.
Finding the correct ticker symbol
Use the Symbol Search tool in Google Sheets under Extensions > SheetsFinance > Symbol Search, or online at Symbol Search.
That's it for tracking the US stock markets in real-time with Google Sheets. For more details, check out our documentation.