
Calculate MACD lines from EMAs
MACD (Moving Average Convergence Divergence) is built from two underlying EMAs. Pull the fast and slow EMA time series with SF_TECHNICAL(), reverse the output so the oldest date is first, then compute the MACD line, Signal line, and histogram in your spreadsheet.
Pull the two EMA time series
Use two SF_TECHNICAL() calls to return the date, close price, and EMA for each period. A common starting point is a 12-period fast EMA and a 26-period slow EMA.
=SF_TECHNICAL("AAPL", "12ema&date&close", "daily", "2023-09-25", "2024-09-24", "NH&-")=SF_TECHNICAL("AAPL", "26ema&date&close", "daily", "2023-09-25", "2024-09-24", "NH&-")Each formula returns three columns: Date, Close, and EMA. The NH option removes the header row so the output is pure data, and the - option reverses the order so the oldest date is at the top.
Why reverse the output? SF_TECHNICAL() returns the newest date first by default. Use "-" to flip the series to chronological order, which is required for charting and for calculating the Signal line correctly.
Build the MACD line
In a new column next to the two EMA outputs, subtract the slow EMA from the fast EMA for each row. This is the MACD line.
=FastEMA - SlowEMABuild the Signal line
The Signal line is an EMA of the MACD line. A common signal period is 9. Use a smoothing factor of 2 / (SignalPeriod + 1); for a 9-period signal that is 0.2. The first value is the average of the first N MACD values, and each subsequent value is (Current MACD × SmoothingFactor) + (Previous Signal × (1 − SmoothingFactor)).
Build the Histogram
The histogram (also called Diff) shows the distance between the MACD line and the Signal line. Subtract the Signal line from the MACD line in a new column.
=MACD - SignalTemplate example
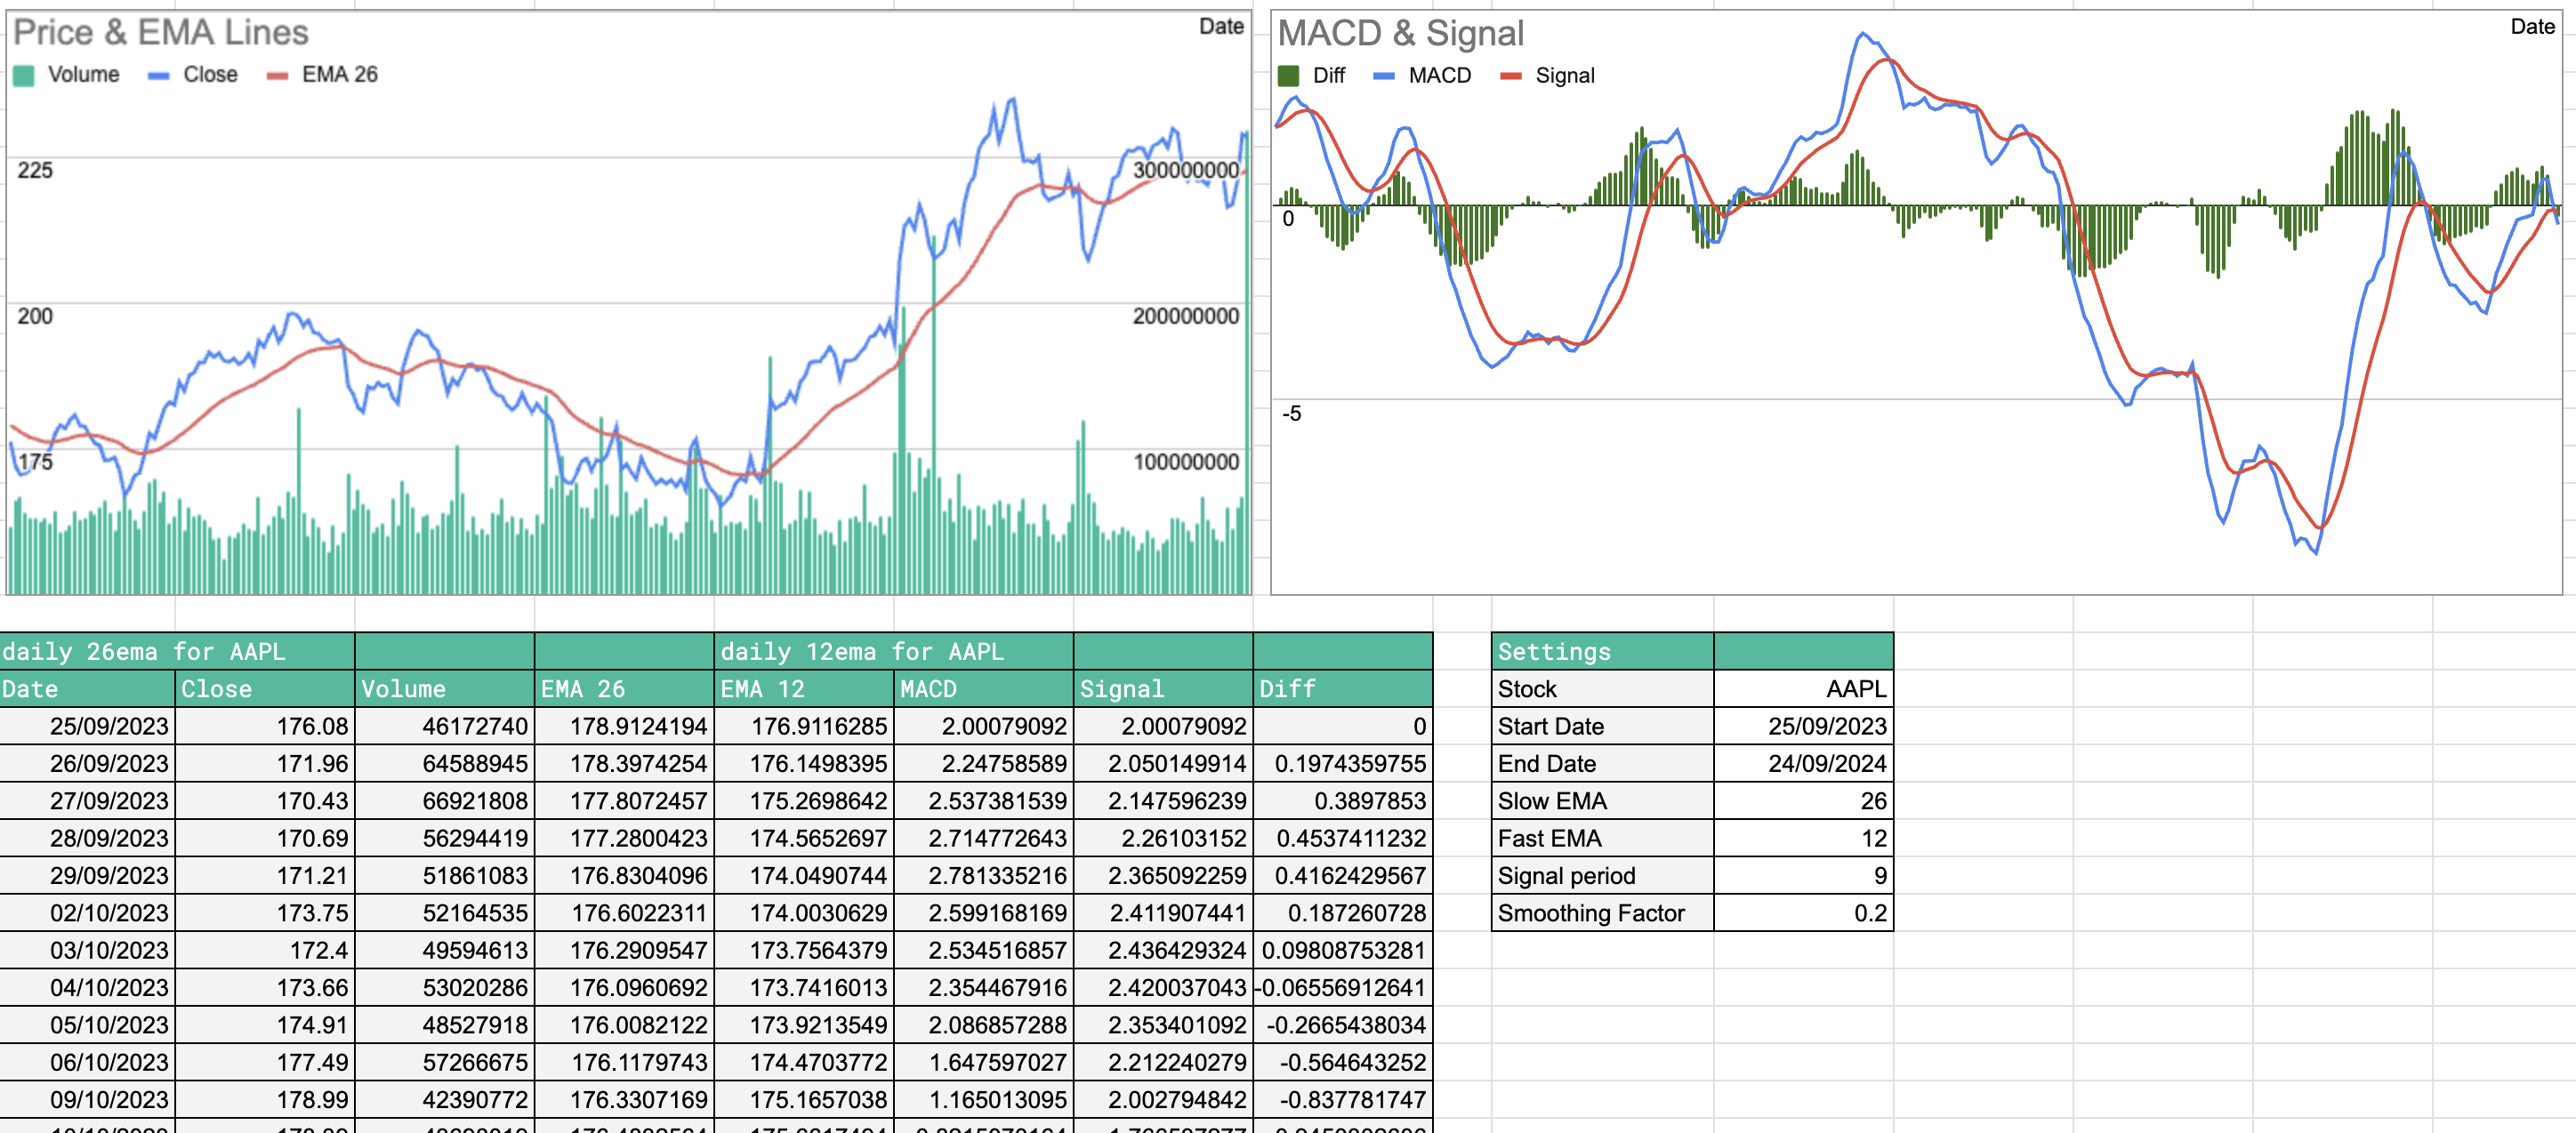
The MACD template below uses global settings for stock, date range, slow EMA, fast EMA, signal period, and smoothing factor. It pulls two technical time series, ensures they are in chronological order with the reverse option, and calculates the MACD, Signal, and Diff columns.
What is next
For more on the SF_TECHNICAL() syntax and supported indicators, read Technical Analysis. For the full function catalog, see Function List.