How to Connect Your Fidelity Account to Excel
Managing your Fidelity investments just got easier! With SheetsFinance for Excel, you can now connect your Fidelity brokerage account directly to Microsoft Excel and access all your up-to-date portfolio data.
Whether you're tracking your retirement accounts, analyzing your trading performance, or building custom portfolio dashboards, SheetsFinance brings your Fidelity data right into Excel where you can leverage its powerful calculation and visualization tools.
Fidelity connection details
What we'll cover
- What data you can access from your Fidelity account
- Step-by-step guide to connecting Fidelity to Excel
- How to use the
SF_BROKERAGE()function to pull your data - Example use cases and formulas
- Privacy and security information
📊 What Fidelity Data Can You Access?
Once connected, SheetsFinance allows you to pull the following data from your Fidelity account directly into Excel:
- Holdings - Current positions including symbol, quantity, cost basis, current value, and unrealized gains/losses
- Transactions - Complete transaction history including buys, sells, dividends, deposits, withdrawals, and fees
- Orders - Recent orders and their status (filled, pending, cancelled)
- Balances - Account balances, cash positions, and buying power
- Options Positions - Options contracts including strike price, expiration, premium, and P&L
🔐 How to Connect Your Fidelity Account to Excel
Prerequisites
Before you begin, make sure you have:
- A SheetsFinance account with an active brokerage subscription
- SheetsFinance installed in Excel (installation guide)
- Your Fidelity account login credentials
💡 Free Trial: New users get a 15-day free trial of the brokerage features—no credit card required!
Step 1: Purchase or Start Your Brokerage Trial
- Visit the SheetsFinance Pricing Page
- Select a brokerage plan or start your free trial
- Complete the checkout process
Step 2: Connect Fidelity on the SheetsFinance Website
- Log into your SheetsFinance Account Dashboard
- Navigate to the Brokerage tab
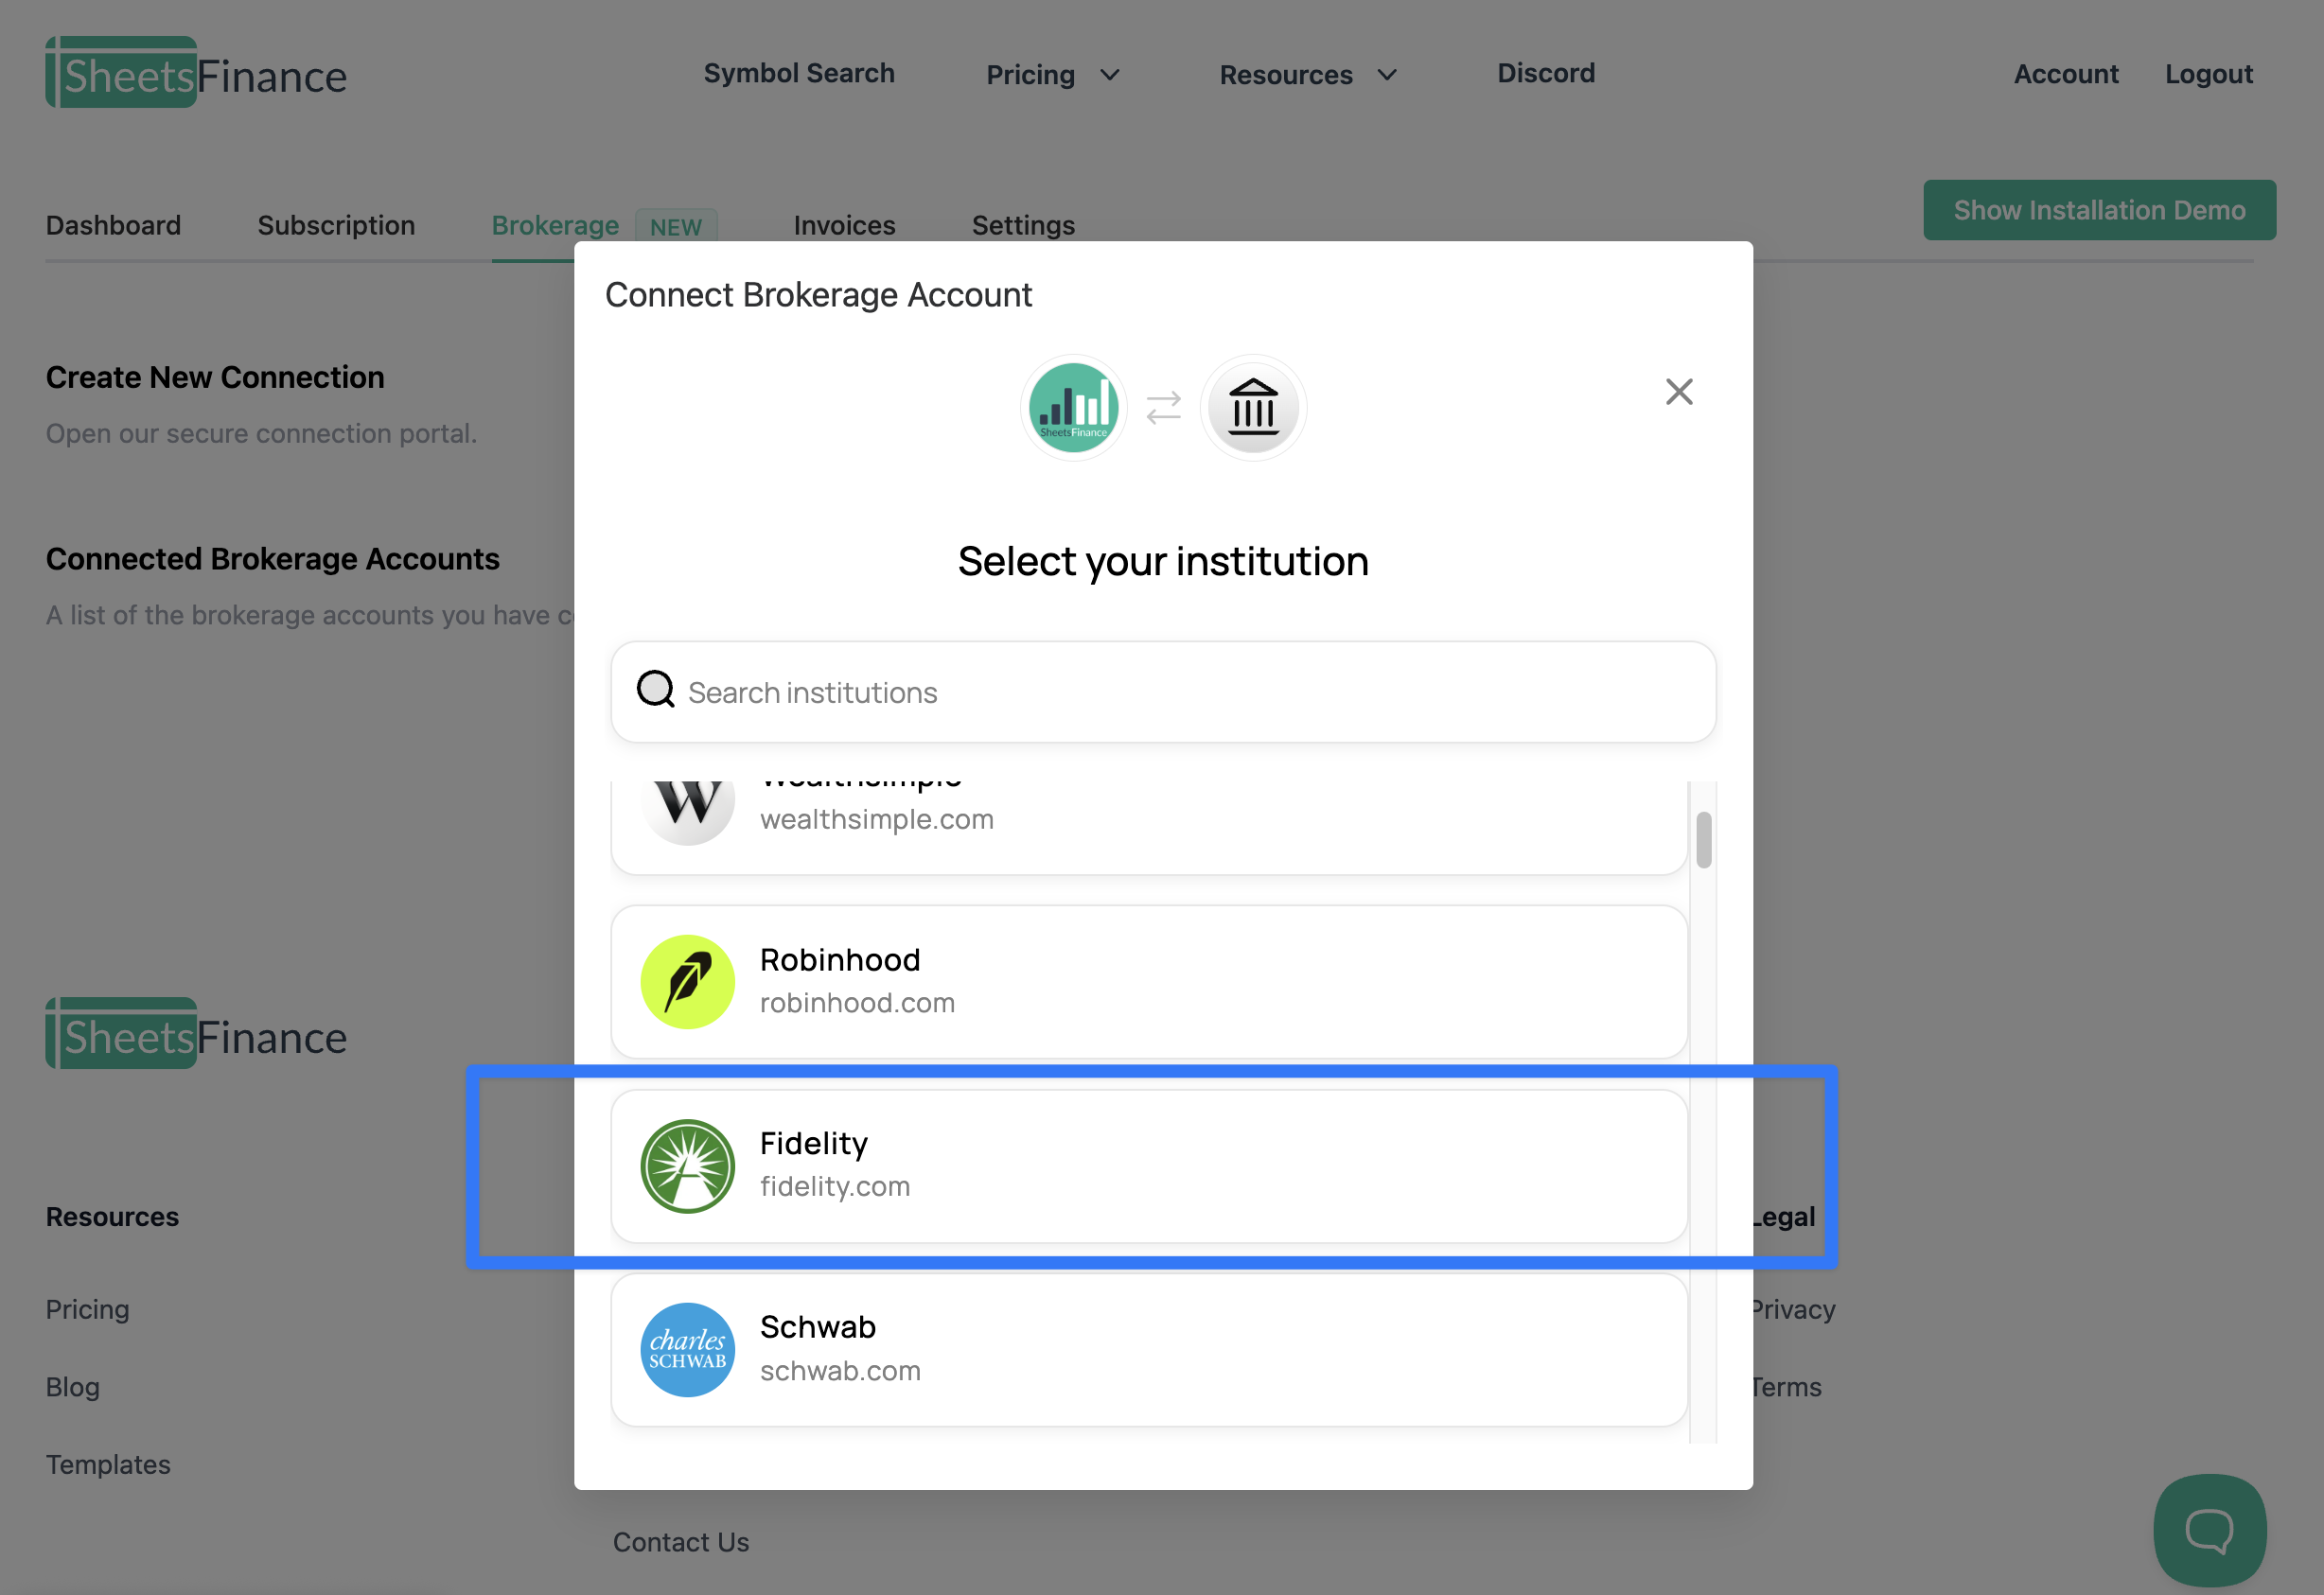
- Click Connect under "Create New Connection"
- Search for and select Fidelity from the list of brokers
- You'll be redirected to Fidelity's secure login page
- Enter your Fidelity username and password
- Authorize SheetsFinance to access your account data (read-only)
- Complete any two-factor authentication if required
Once connected, you'll see your Fidelity account listed in your Connected Brokerage Accounts section.
Step 3: Set a Nickname for Your Fidelity Account
By default, SheetsFinance will use "fidelity" as the nickname for your account. This nickname is what you'll use in Excel formulas to reference this specific account.
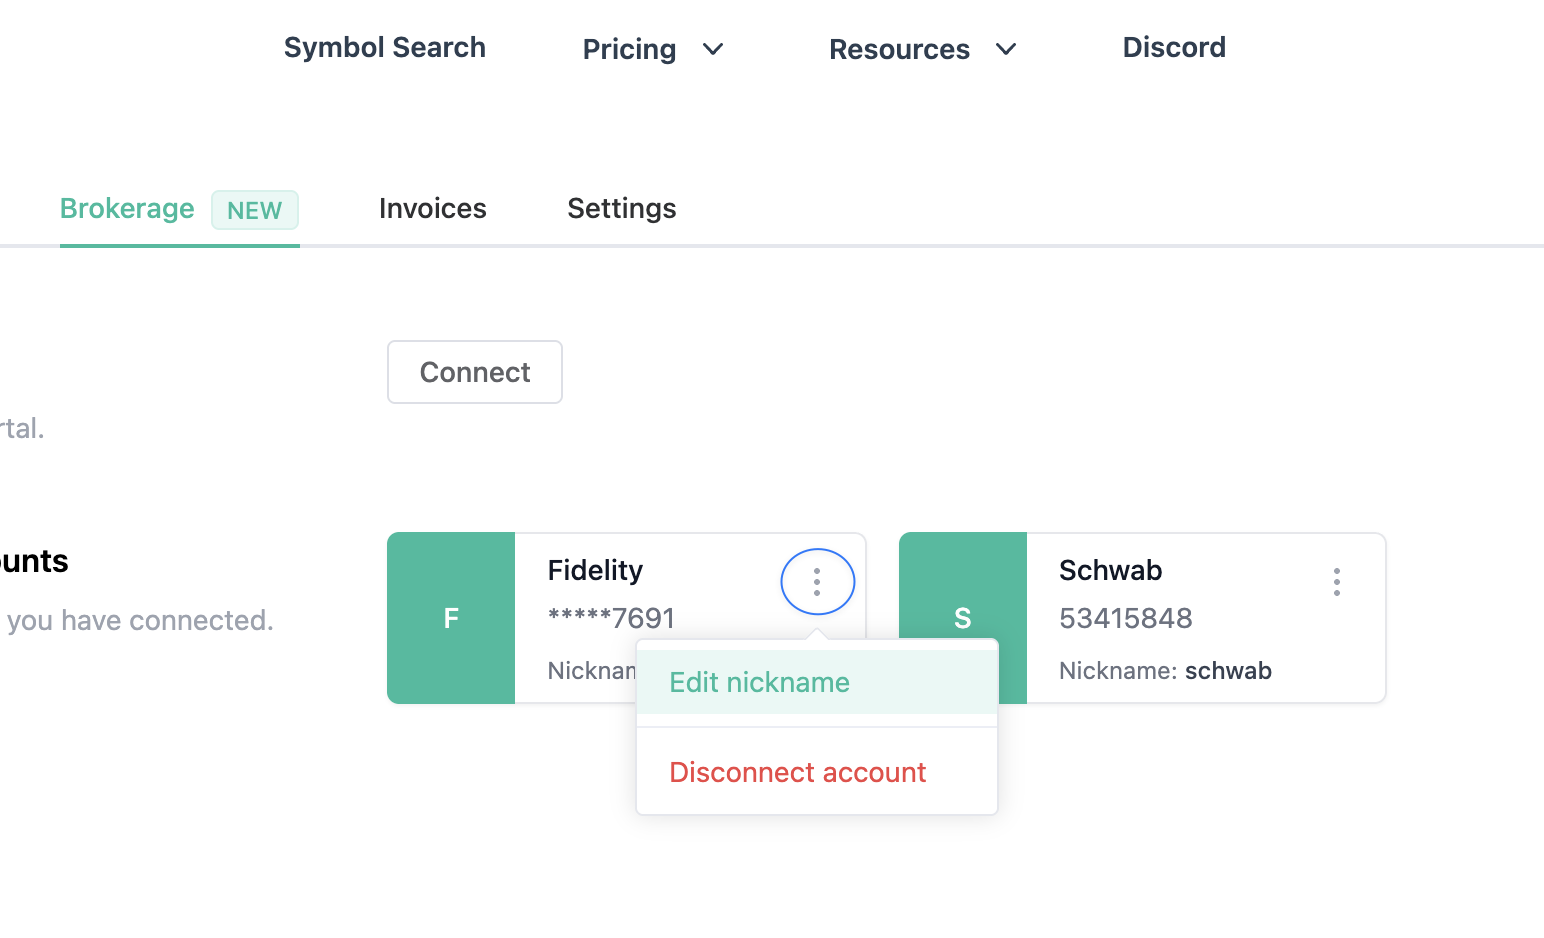
To customize the nickname:
- In the Brokerage tab of your account dashboard, find your Fidelity connection
- Click Edit Nickname
- Enter a custom nickname (e.g., "fidelity_401k", "fidelity_brokerage", etc.)
- Click Save
💡 Tip: If you have multiple Fidelity accounts, use descriptive nicknames like "fidelity_401k" and "fidelity_taxable" to keep them organized.
You can also customise your account nicknames directly from Excel. All you need to do is:
- Click the SheetsFinance button in the ribbon menu
- Open the sidebar and navigate to Brokerage
- Find your Fidelity account and click the pencil icon to edit the nickname
- Enter your desired nickname and save
Step 4: Connect to SheetsFinance from Excel
- Open Microsoft Excel
- Make sure SheetsFinance is installed and connected to your account
- Click the SheetsFinance button in the ribbon menu
- Enter your SheetsFinance Connection ID (found in your account dashboard)
- Click Connect
- Once connected navigate to the Brokerage tab in the SheetsFinance sidebar where you'll see your Fidelity account(s) listed
📈 Using the SF_BROKERAGE() Function
Now that your Fidelity account is connected, you can start pulling data into Excel using the SF_BROKERAGE() function.
📚 Jump to the docs: For all the detail on how to use the
SF_BROKERAGE()function head to our docs
Basic Syntax
=SF_BROKERAGE(account_nickname, data_type, [metrics], [start_date], [end_date], [transaction_types])Example 1: Get Your Current Holdings
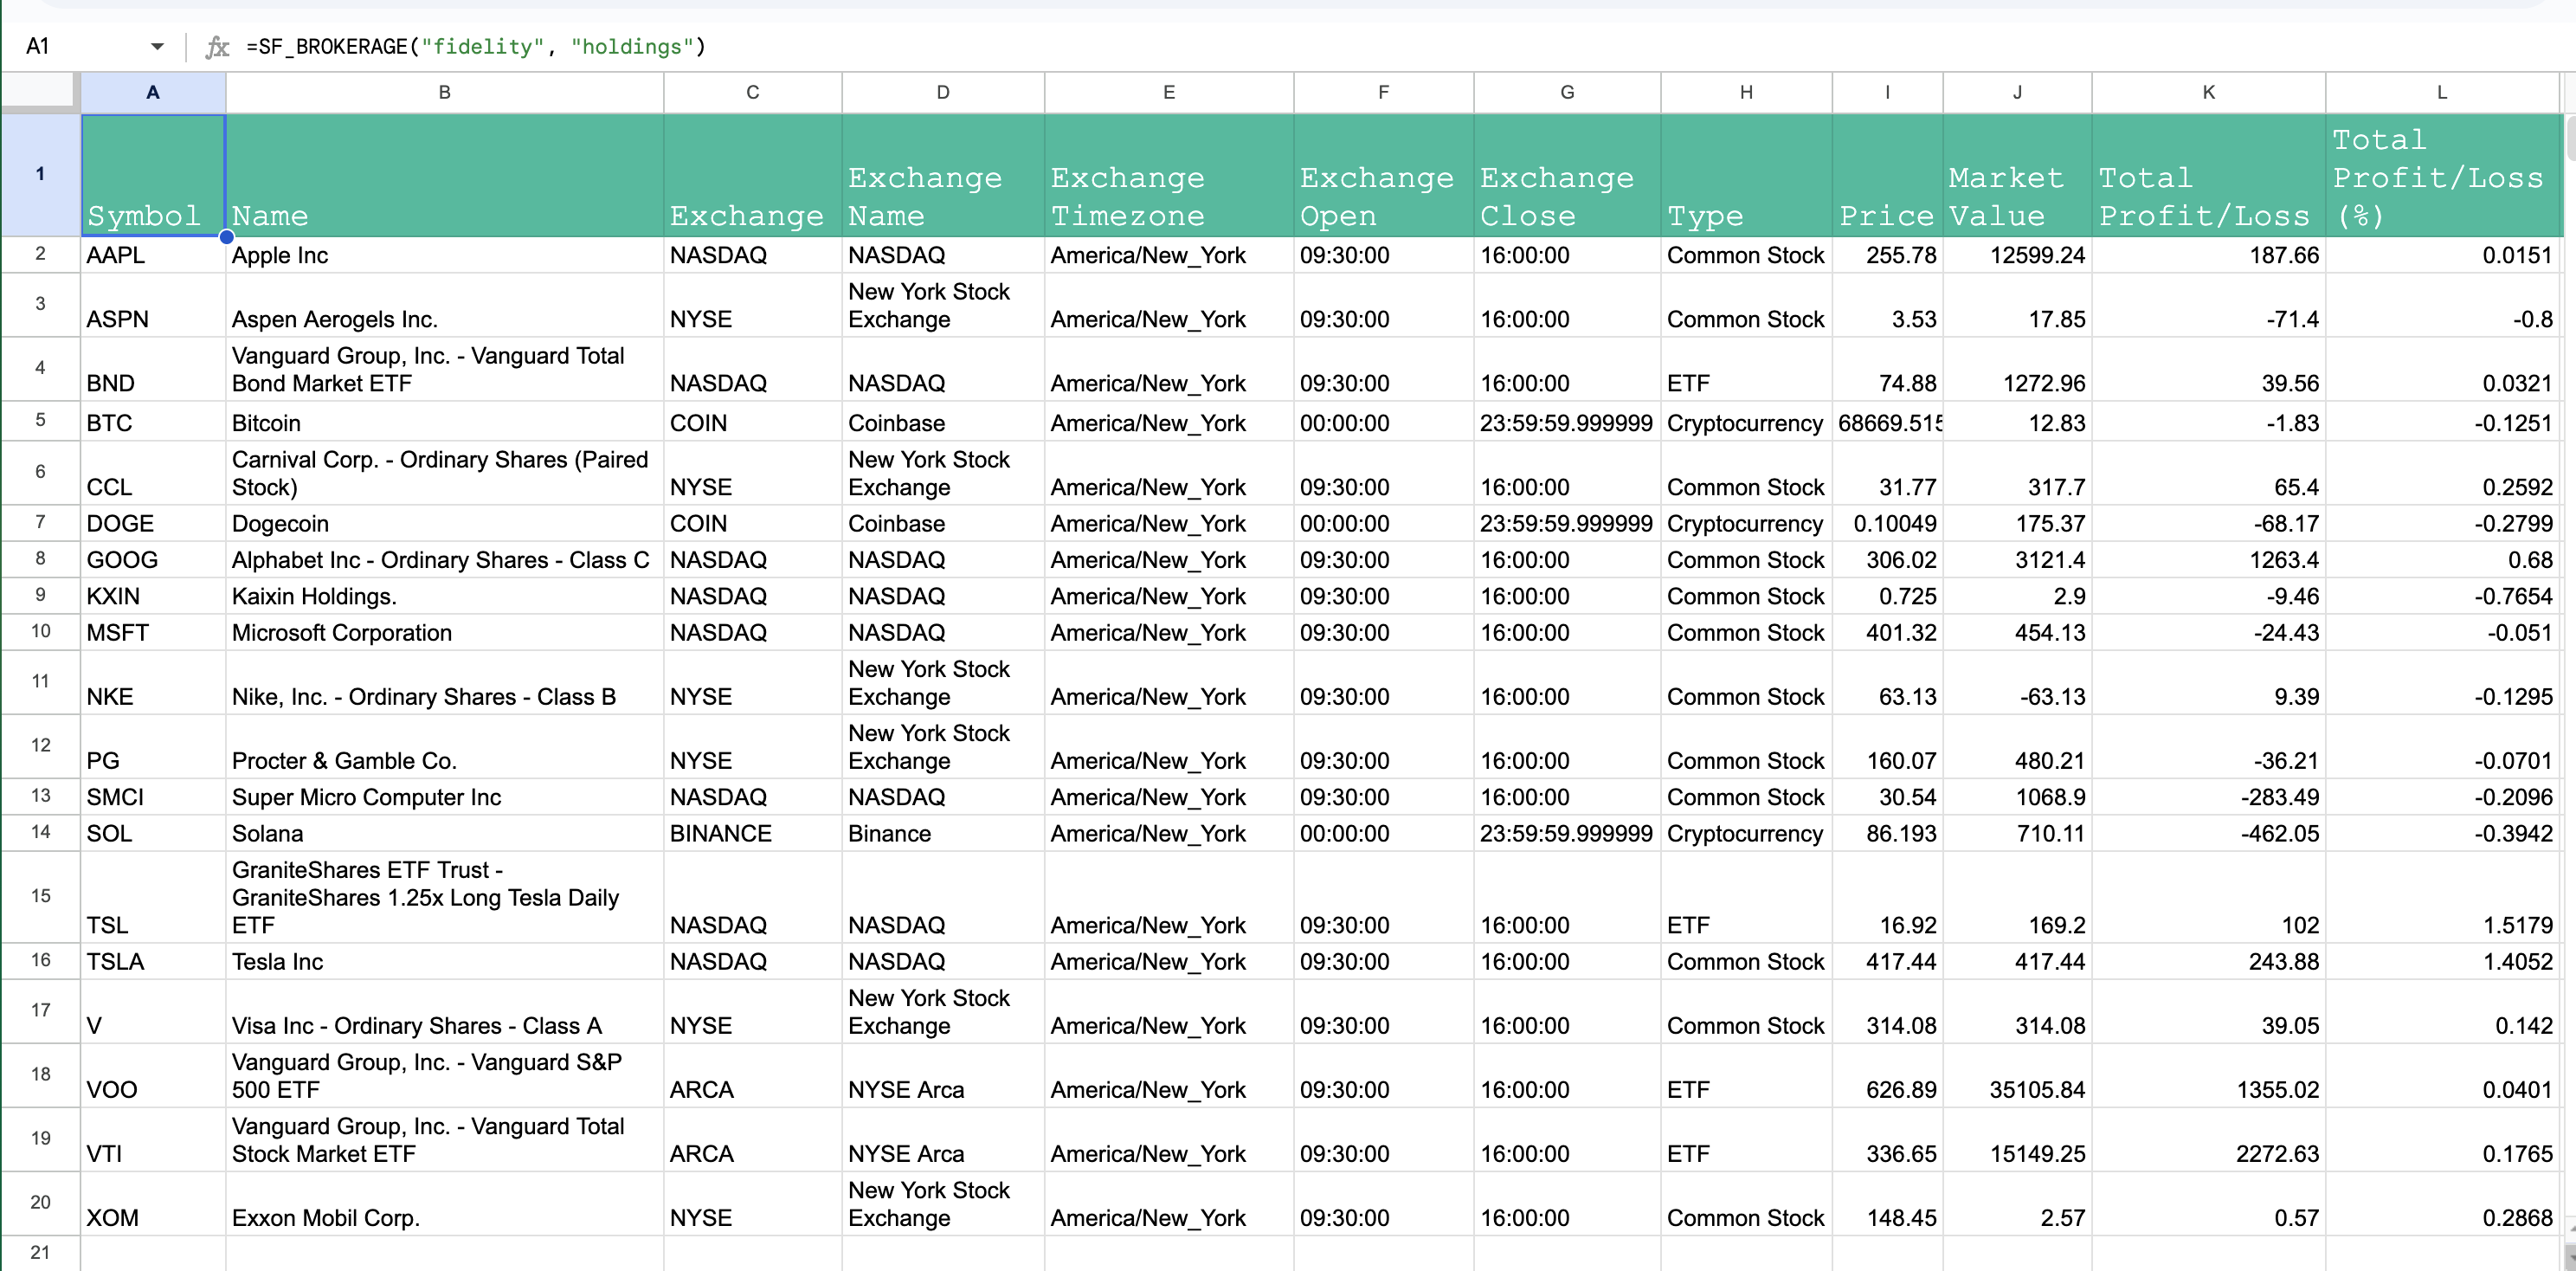
To pull all your Fidelity holdings/positions into Excel, use the "holdings" type:
=SF_BROKERAGE("fidelity", "holdings")This returns a table with all your positions including:
- Symbol
- Security name
- Units
- Average cost per share
- Current price
- Market value
- Unrealized gain/loss
- Unrealized gain/loss percentage
- And more!
🤔 Where are my options positions? These are handled separately under the
"optionsPositions"type, keep reading to learn more.
Example 2: Get Specific Holding Metrics
As with all SF functions, you can use the & operator to chain together multiple metrics. This allows you to filter down to exactly that data you're after. For example, to show only symbol, units, and market value you can do the following:
=SF_BROKERAGE("fidelity", "holdings", "symbol&units&marketValue")Example 3: View Your Transaction History
Access your account transaction history with the "transactions" type:
=SF_BROKERAGE("fidelity", "transactions")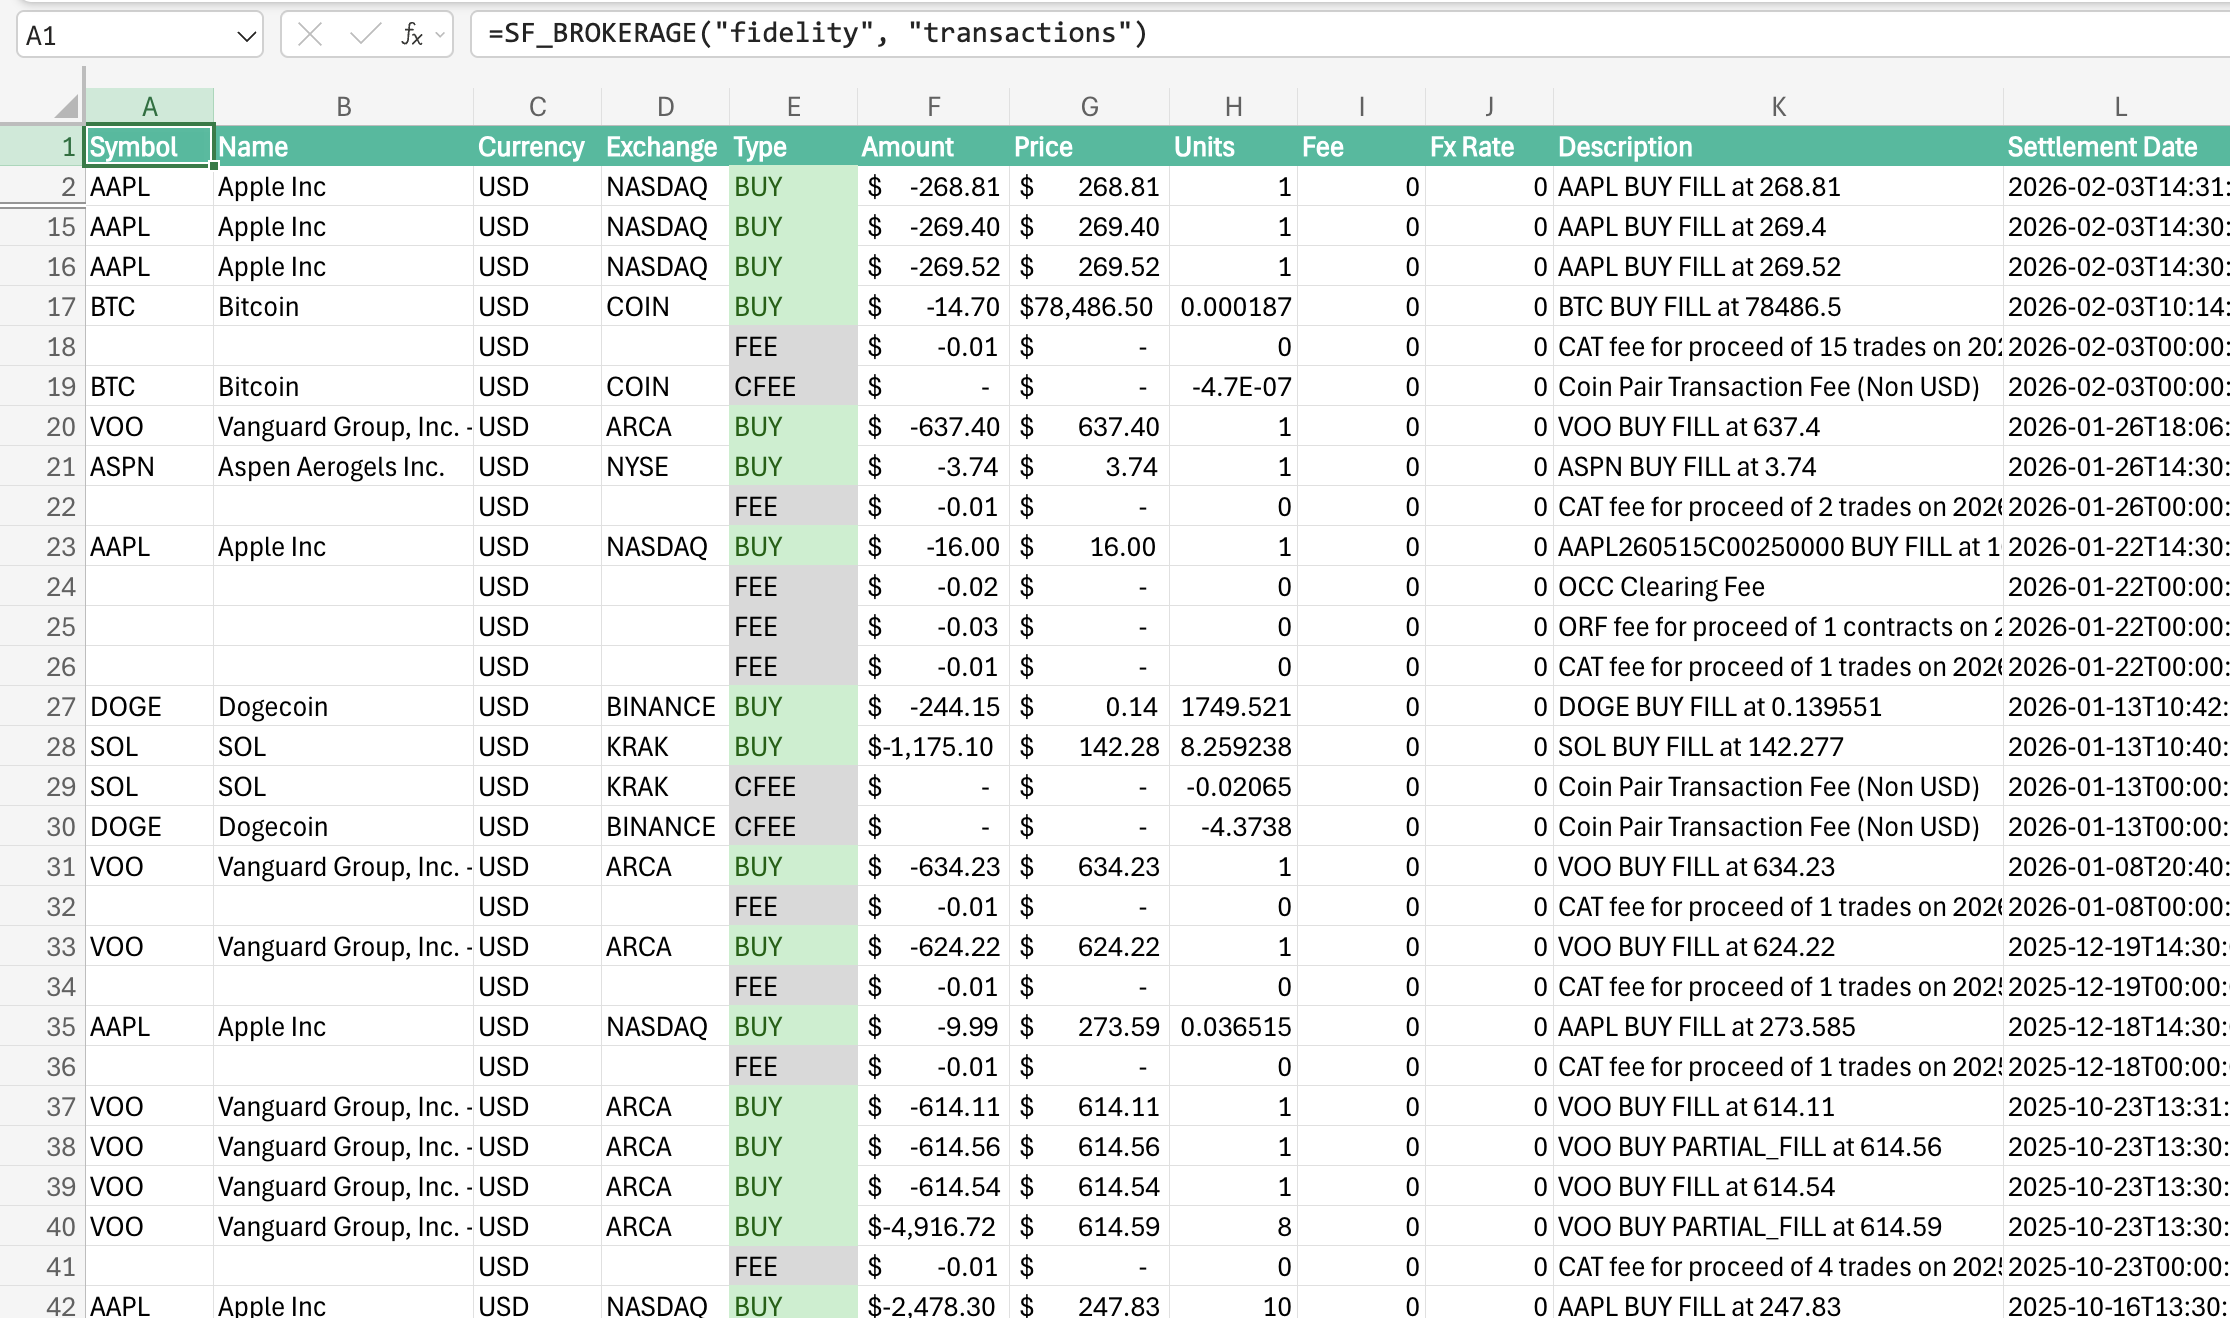
Example 4: Filter Transactions by Date and/or transaction type
The transaction type also supports the optional arguments start_date, end_date and transaction_types for more granular filtering. For example, to see all transactions from 2024:
=SF_BROKERAGE("fidelity", "transactions", "all", "2024-01-01", "2024-12-31")Or to see only buys and sells from 2024:
=SF_BROKERAGE("fidelity", "transactions", "all", "2024-01-01", "2024-12-31", "BUYS&SELLS")Example 5: Check Your Account Balances
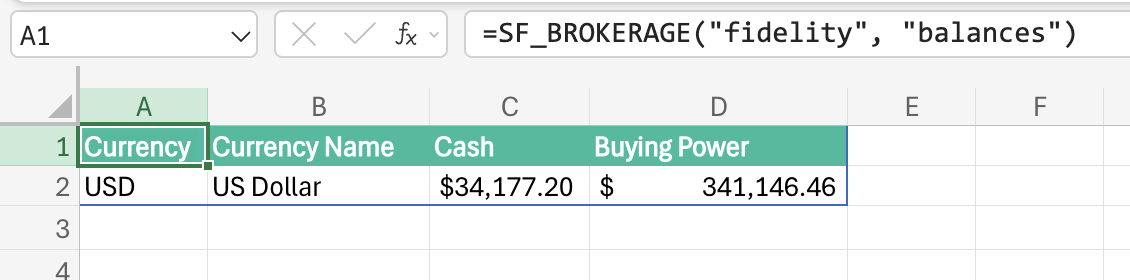
You can pull in your account balances including cash and buying power with the "balances" type:
=SF_BROKERAGE("fidelity", "balances")This shows your:
- Total account value
- Cash balance
- Buying power
Example 6: View Recent Orders
The "orders" type allows you to see your recent orders and their status:
=SF_BROKERAGE("fidelity", "orders")Your order history includes:
- Order type (market, limit, stop, etc.)
- Status (filled, pending, cancelled, etc.)
- Fill price and quantity
- Timestamps
- And more!
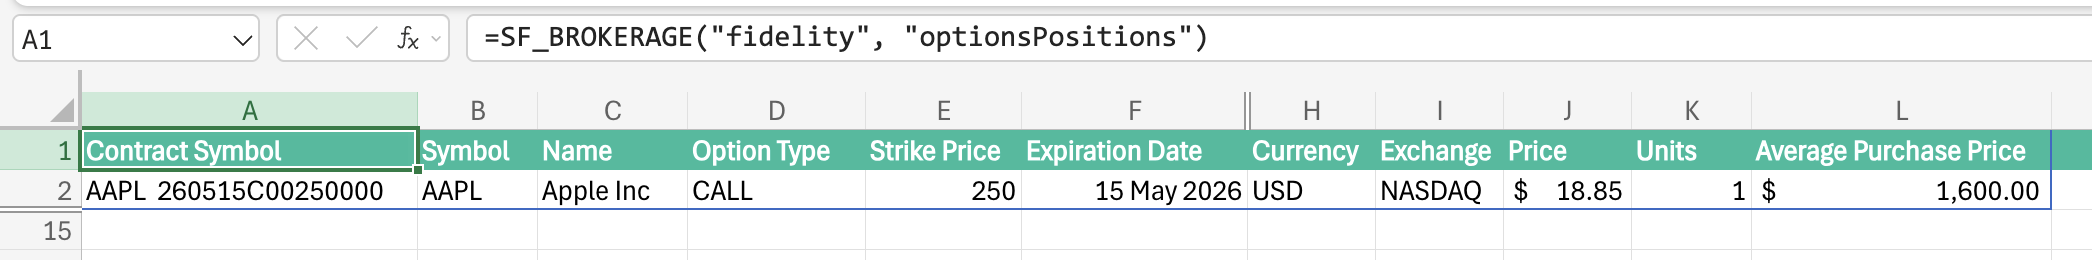
Example 7: View Options Positions
Last but not least, you can also access your options positions with the "optionsPositions" type. This is separate from the regular holdings data as options have unique attributes that need to be handled differently. To pull your options positions, use the following formula:
=SF_BROKERAGE("fidelity", "optionsPositions")This returns detailed options data including:
- Underlying symbol
- Option type (call/put)
- Strike price
- Expiration date
- P&L metrics
- And more!
💡 Practical Use Cases
1. Portfolio Performance Dashboard
Create a comprehensive dashboard showing:
- Total portfolio value
- Asset allocation by security
- Day's gain/loss
- YTD performance
- Top gainers and losers
2. Tax Management
Use the holdings and transaction data to identify:
- Positions with large unrealized gains/losses
- Understand your cost basis for tax reporting
- Plan tax-loss harvesting strategies
- Prepare for year-end tax planning
3. Dividend Tracking
Filter your transactions to show dividend income:
- Track dividend payments over time
- Calculate dividend yield by position
- Project future income
4. Trading Journal
Combine transactions and orders data to:
- Analyze your trading patterns
- Calculate win/loss ratios
- Track commission costs
- Identify your most profitable trades
5. Retirement Account Monitoring
If your Fidelity 401(k) or IRA is connected:
- Track contribution progress
- Monitor asset allocation
- Rebalance efficiently
- Plan for required minimum distributions (RMDs)
6. Collaborative Investment Tracking
Share your Google Sheet with:
- Financial advisors
- Tax professionals
- Family members (with appropriate privacy controls)
- Investment clubs
🔒 Privacy & Security
We take the security and privacy of your Fidelity data very seriously.There are two classes of data associated with your brokerage connection:
- Brokerage Data: This is the data that is pulled in from your brokerage account(s) into Google Sheets and/or Excel.
- Brokerage Credentials: Randomised tokens that are used to authenticate your brokerage account(s) with SheetsFinance.
SheetsFinance does the following to ensure the security of your data:
- User data belongs to the user: Your Fidelity brokerage data is your own, we do not touch it without your explicit permission. Only you have access to your brokerage data.
- No Long-term Brokerage Data Storage: We do not store any of your Fidelity brokerage data in databases on our servers. The only storage medium is temporary caching in-memory whilst actively using the data in Google Sheets and/or Excel, this is to ensure best performance.
- Encrypted Brokerage Credentials: Your Fidelity brokerage credentials are encrypted, stored securely and regularly rotated. Your brokerage credentials are only valid for the server-to-server connection between SheetsFinance and brokerage providers and are useless outside of this context.
- Complete Disconnection: If you remove a brokerage connection or your entire brokerage subscription, all brokerage credentials become invalid for future use. Entirely new credentials are generated if you reconnect your Fidelity brokerage account(s).
- Read-Only Access: SheetsFinance has read-only access to your Fidelity brokerage data. We do not have the ability to execute trades or make any changes to your Fidelity brokerage account(s).
📚 Additional Resources
- Brokerage Documentation - Complete guide to brokerage connections
- SF_BROKERAGE Function Reference - Detailed function documentation
- Supported Brokers - Full list of supported brokerage firms
- Excel Installation Guide - How to install SheetsFinance in Excel
🎯 Get Started Today
Ready to connect your Fidelity account to Excel?
- Sign up for SheetsFinance (15-day free trial)
- Start your brokerage trial
- Connect your Fidelity account
- Start analyzing your portfolio in Excel!
If you have any questions or need assistance, our support team is here to help.
Happy investing! 📊