

Overview
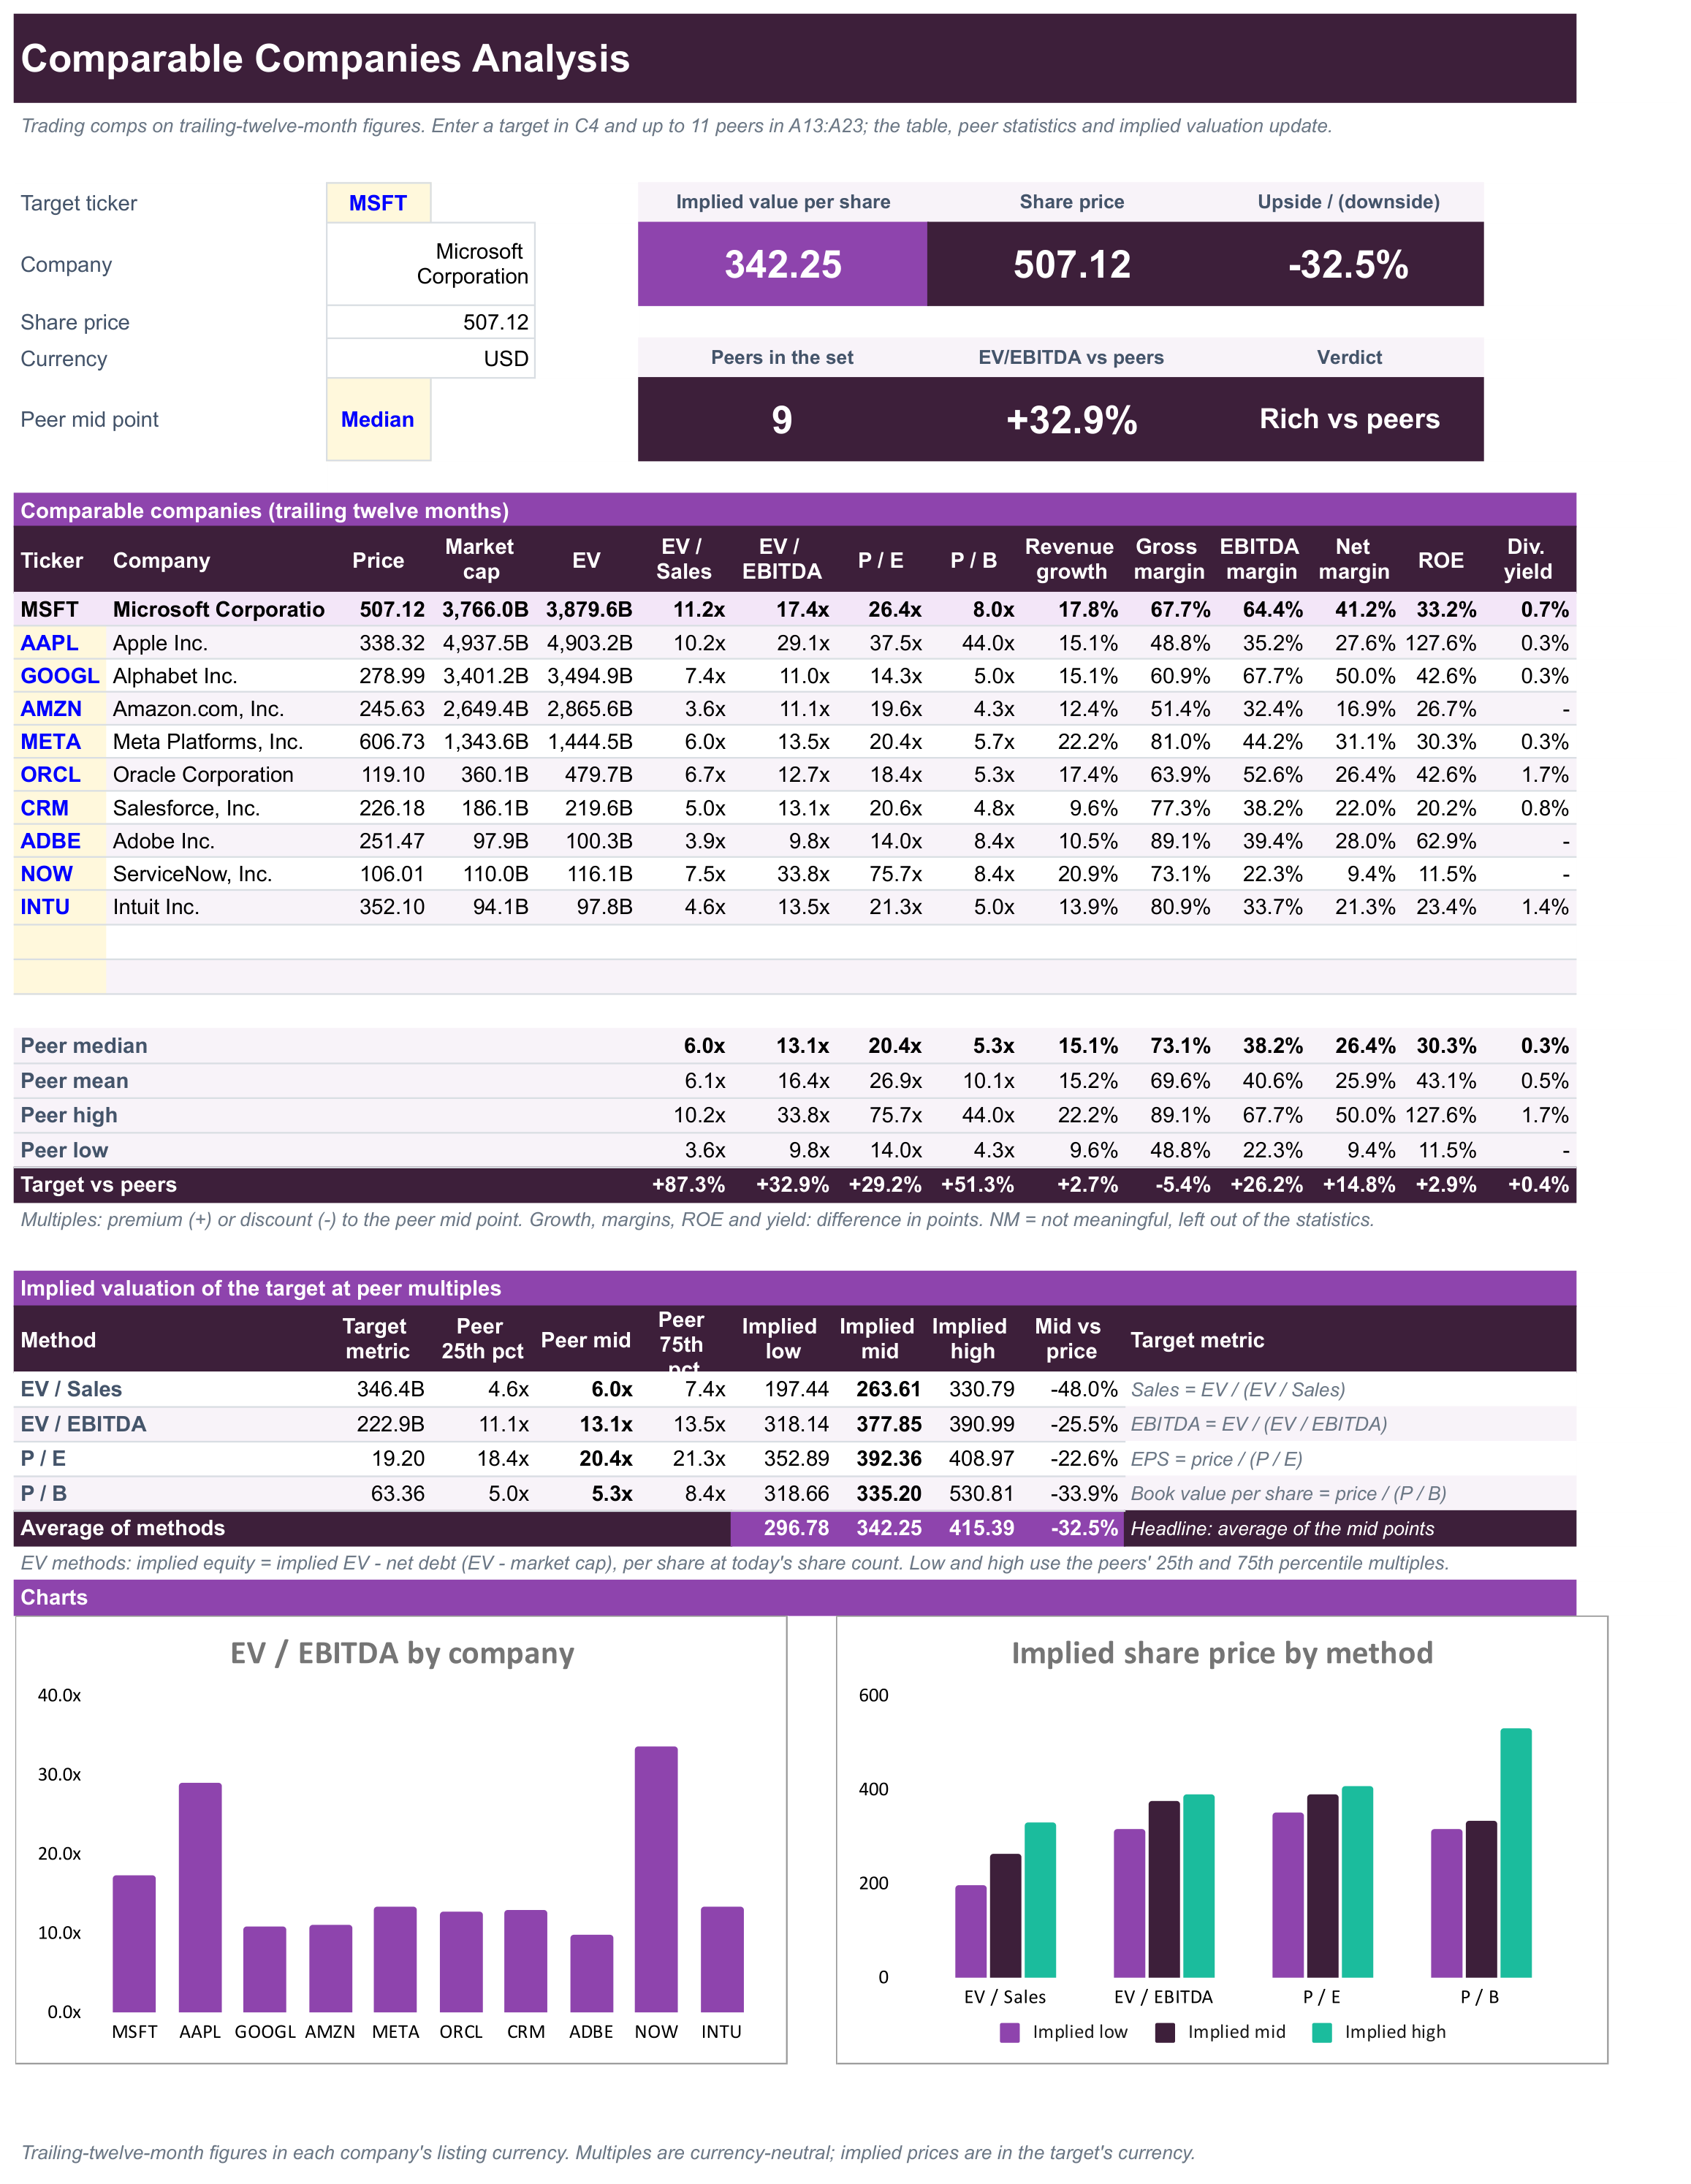
Value a company against its peers with a comparable companies analysis (trading comps): valuation multiples, growth, margins and returns for up to 12 companies side by side, and an implied share price range for the company you are valuing.
What's inside
- Comps dashboard: implied value per share, the current share price, the upside or downside, how many peers are in the set, the target's EV/EBITDA premium or discount to its peers, and a verdict, all at the top of the sheet.
- Comps table: one row per company with price, market cap and enterprise value, then:
- EV/Sales, EV/EBITDA, P/E and P/B multiples
- Revenue growth for the latest fiscal year
- Gross, EBITDA and net margins, ROE and dividend yield
- Peer statistics: median, mean, high and low for every column, plus the target's premium or discount to the peer mid point.
- Implied valuation: the target's sales, EBITDA, earnings and book value multiplied by the peers' 25th percentile, mid point and 75th percentile multiples, converted to a price per share, with the average of the methods as the headline.
- Charts: EV/EBITDA for every company in the set, and the implied share price range by method.
- Guide sheet: how to pick peers, how each figure is calculated, and where comps fit and don't.
The target goes in C4 and the peers in A13:A23, one ticker per row; unused rows can stay blank. Each data type loads the whole group with a single SheetsFinance formula, so changing a ticker updates its row straight away. Negative or zero multiples, such as the P/E of a loss-making company, show as NM and are left out of the statistics and the implied valuation. Choose median or mean for the peer mid point in C8.
Good for
- Checking whether a stock trades cheap or rich to the companies it competes with
- Building a peer table for a pitch, an investment memo or a coursework valuation
- Cross-checking an intrinsic value from the SF DCF Valuation Template with a market-based one
- Screening a sector for outliers on growth, margins or returns
How to use it
- Click Copy to Google Sheets to save your own copy.
- Open Extensions → SheetsFinance and make sure you're connected.
- Type the company you are valuing, such as
MSFT, into cell C4 on the Comps sheet. - List up to 11 peers in A13:A23, one ticker per row, and pick Median or Mean in C8.
- Read the Guide sheet for tips on choosing peers and how the implied value is worked out.
Google Sheets
Excel
Functions used
The SheetsFinance functions this template is built with. Read the docs to adapt it.