

Overview
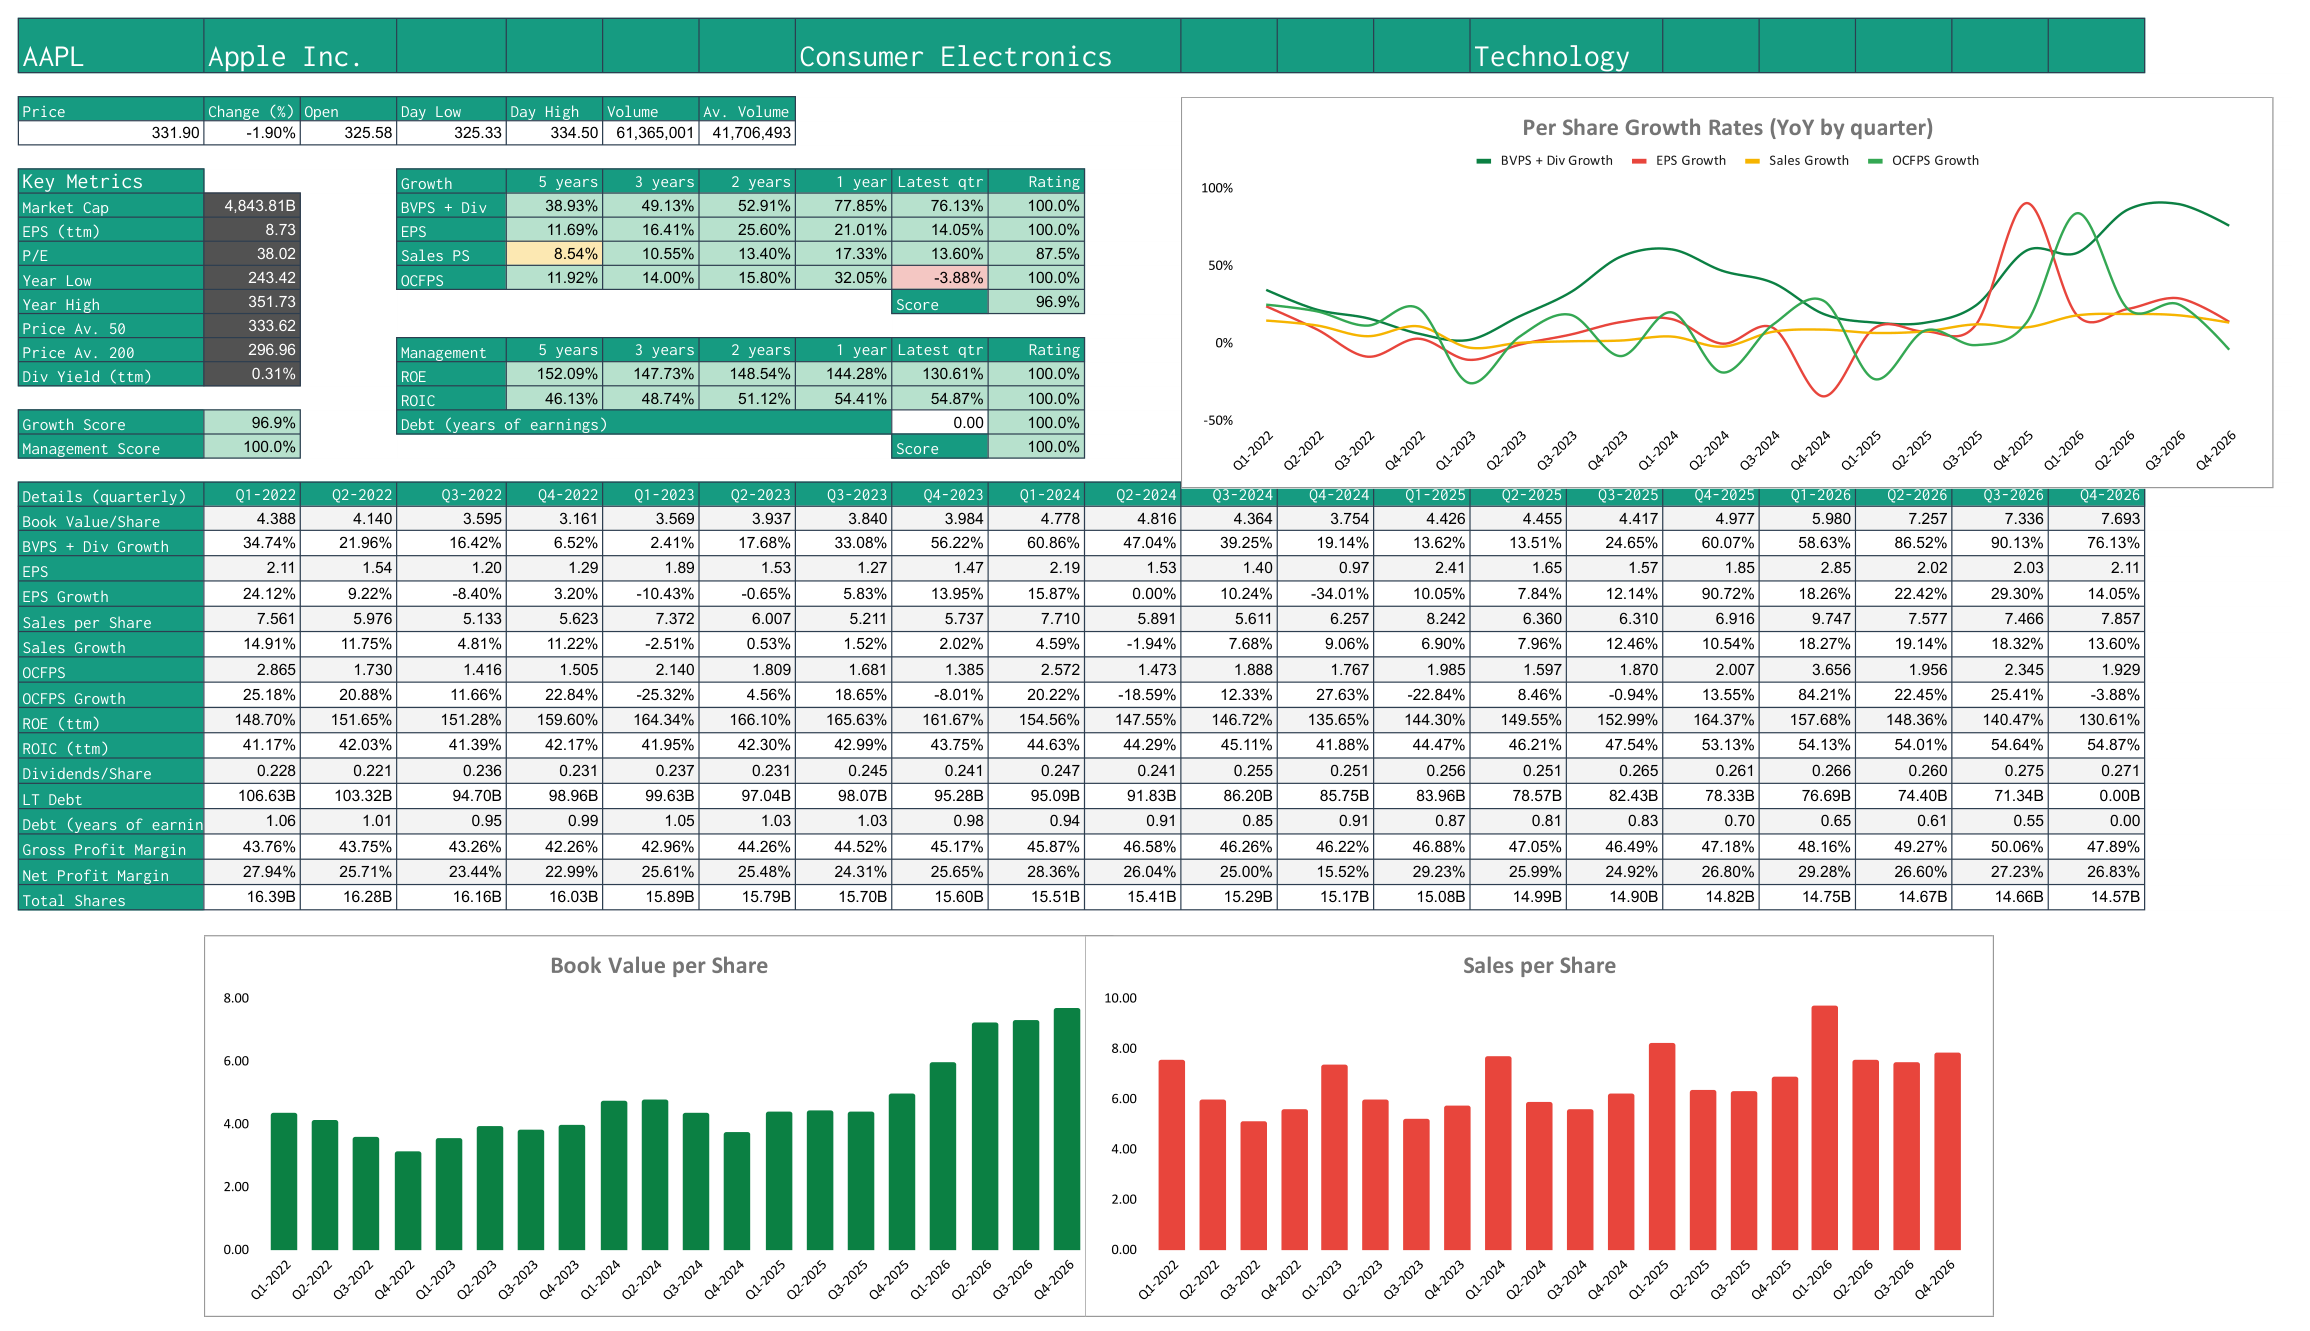
The quarterly version of the SF Growth Analysis and MOS Valuation Template: five years of quarterly results, four key per-share growth rates, a growth and management score, and an automatic Margin of Safety (MOS) valuation.
What's inside
- Growth Analysis: a dashboard of the last 20 quarters, focused on:
- Book value per share plus dividends (BVPS + Div)
- Earnings per share (EPS)
- Sales per share (SPS)
- Operating cash flow per share (OCFPS)
- Management: return on equity and return on invested capital over the last four quarters, plus long-term debt measured in years of earnings.
- MOS Valuation: uses the growth rates to forecast earnings, works out a fair value and the buy price needed for your target yearly return, then applies your margin of safety. A chart compares the last year of share prices with both.
- Quarterly Data: the raw quarterly statements behind every figure.
Change the ticker in cell A1 of the Growth Analysis sheet and the whole workbook reloads for the new company.
How growth is measured
Each quarter is compared with the same quarter a year earlier, so Q3 is measured against last year's Q3. That removes seasonal swings, such as a retailer's holiday quarter, and keeps every rate an annual rate. A quarter shows -- when the earlier figure is zero or negative, because a growth rate from a loss isn't meaningful.
The growth table averages those quarterly rates over 5 years (20 quarters), 3 years, 2 years and 1 year, and shows the latest quarter on its own.
How the scoring works
- Growth rating: each of the 5-, 3-, 2- and 1-year averages scores 0 points under 5%, 1 point from 5% to 10%, and 2 points at 10% or more. The rating is the points scored as a share of the points available. The latest quarter is shown but not scored, so one unusual quarter can't swing the rating.
- Growth Score: the average of the four growth ratings (BVPS + Div, EPS, Sales and OCFPS).
- Management Score: the average of the ROE rating, the ROIC rating (scored the same way as growth) and the debt rating. The debt rating is (10 − years of earnings) ÷ 10, so a company with no long-term debt scores 100% and one that needs 10 or more years of earnings to repay it scores 0%.
- Colours: green is 80% or more, amber 50% to 80%, and red below 50%. Growth rates are green at 10% or more, amber from 5% to 10% and red below 5%.
How the valuation works
- Growth rate: pick a horizon in L3 (5 years by default). The template takes the four growth rates for that horizon, drops the highest and lowest, and averages the middle two.
- Future earnings: today's trailing twelve months EPS grows at that rate for the forecast length in L4 (5 years by default).
- Future share price: future EPS × the future P/E. By default that's the highest of the current P/E, twice the growth rate (as a P/E) and the industry P/E in B22.
- Fair value: the future share price discounted back to today at your minimum acceptable annual return (MAAR) in H4 (15% by default).
- Buy price: fair value less your margin of safety in H3 (20% by default).
You can override the growth rate in L6 and the future P/E in L5 with one of the listed values or your own figure. The sheet also shows the valuation at the maximum and minimum growth rates and P/Es, so you can see the range.
Good for
- Tracking how a company's growth is changing quarter by quarter, before it shows up in annual results
- A quick, repeatable valuation check before you buy
- Pairing with the annual SF Growth Analysis and MOS Valuation Template for a 10-year view
How to use it
- Click Copy to Google Sheets to save your own copy.
- Open Extensions → SheetsFinance and make sure you're connected.
- Type a ticker such as
AAPLinto cell A1 on the Growth Analysis sheet. - Open the MOS Valuation sheet and adjust the safety margin, MAAR and forecast settings in H3:H4 and L3:L6 to suit you.
Functions used
The SheetsFinance functions this template is built with. Read the docs to adapt it.