

Overview
Check a company's Altman Z-Score, Edward Altman's measure of bankruptcy risk, from live balance sheet, income statement and market data.
What's inside
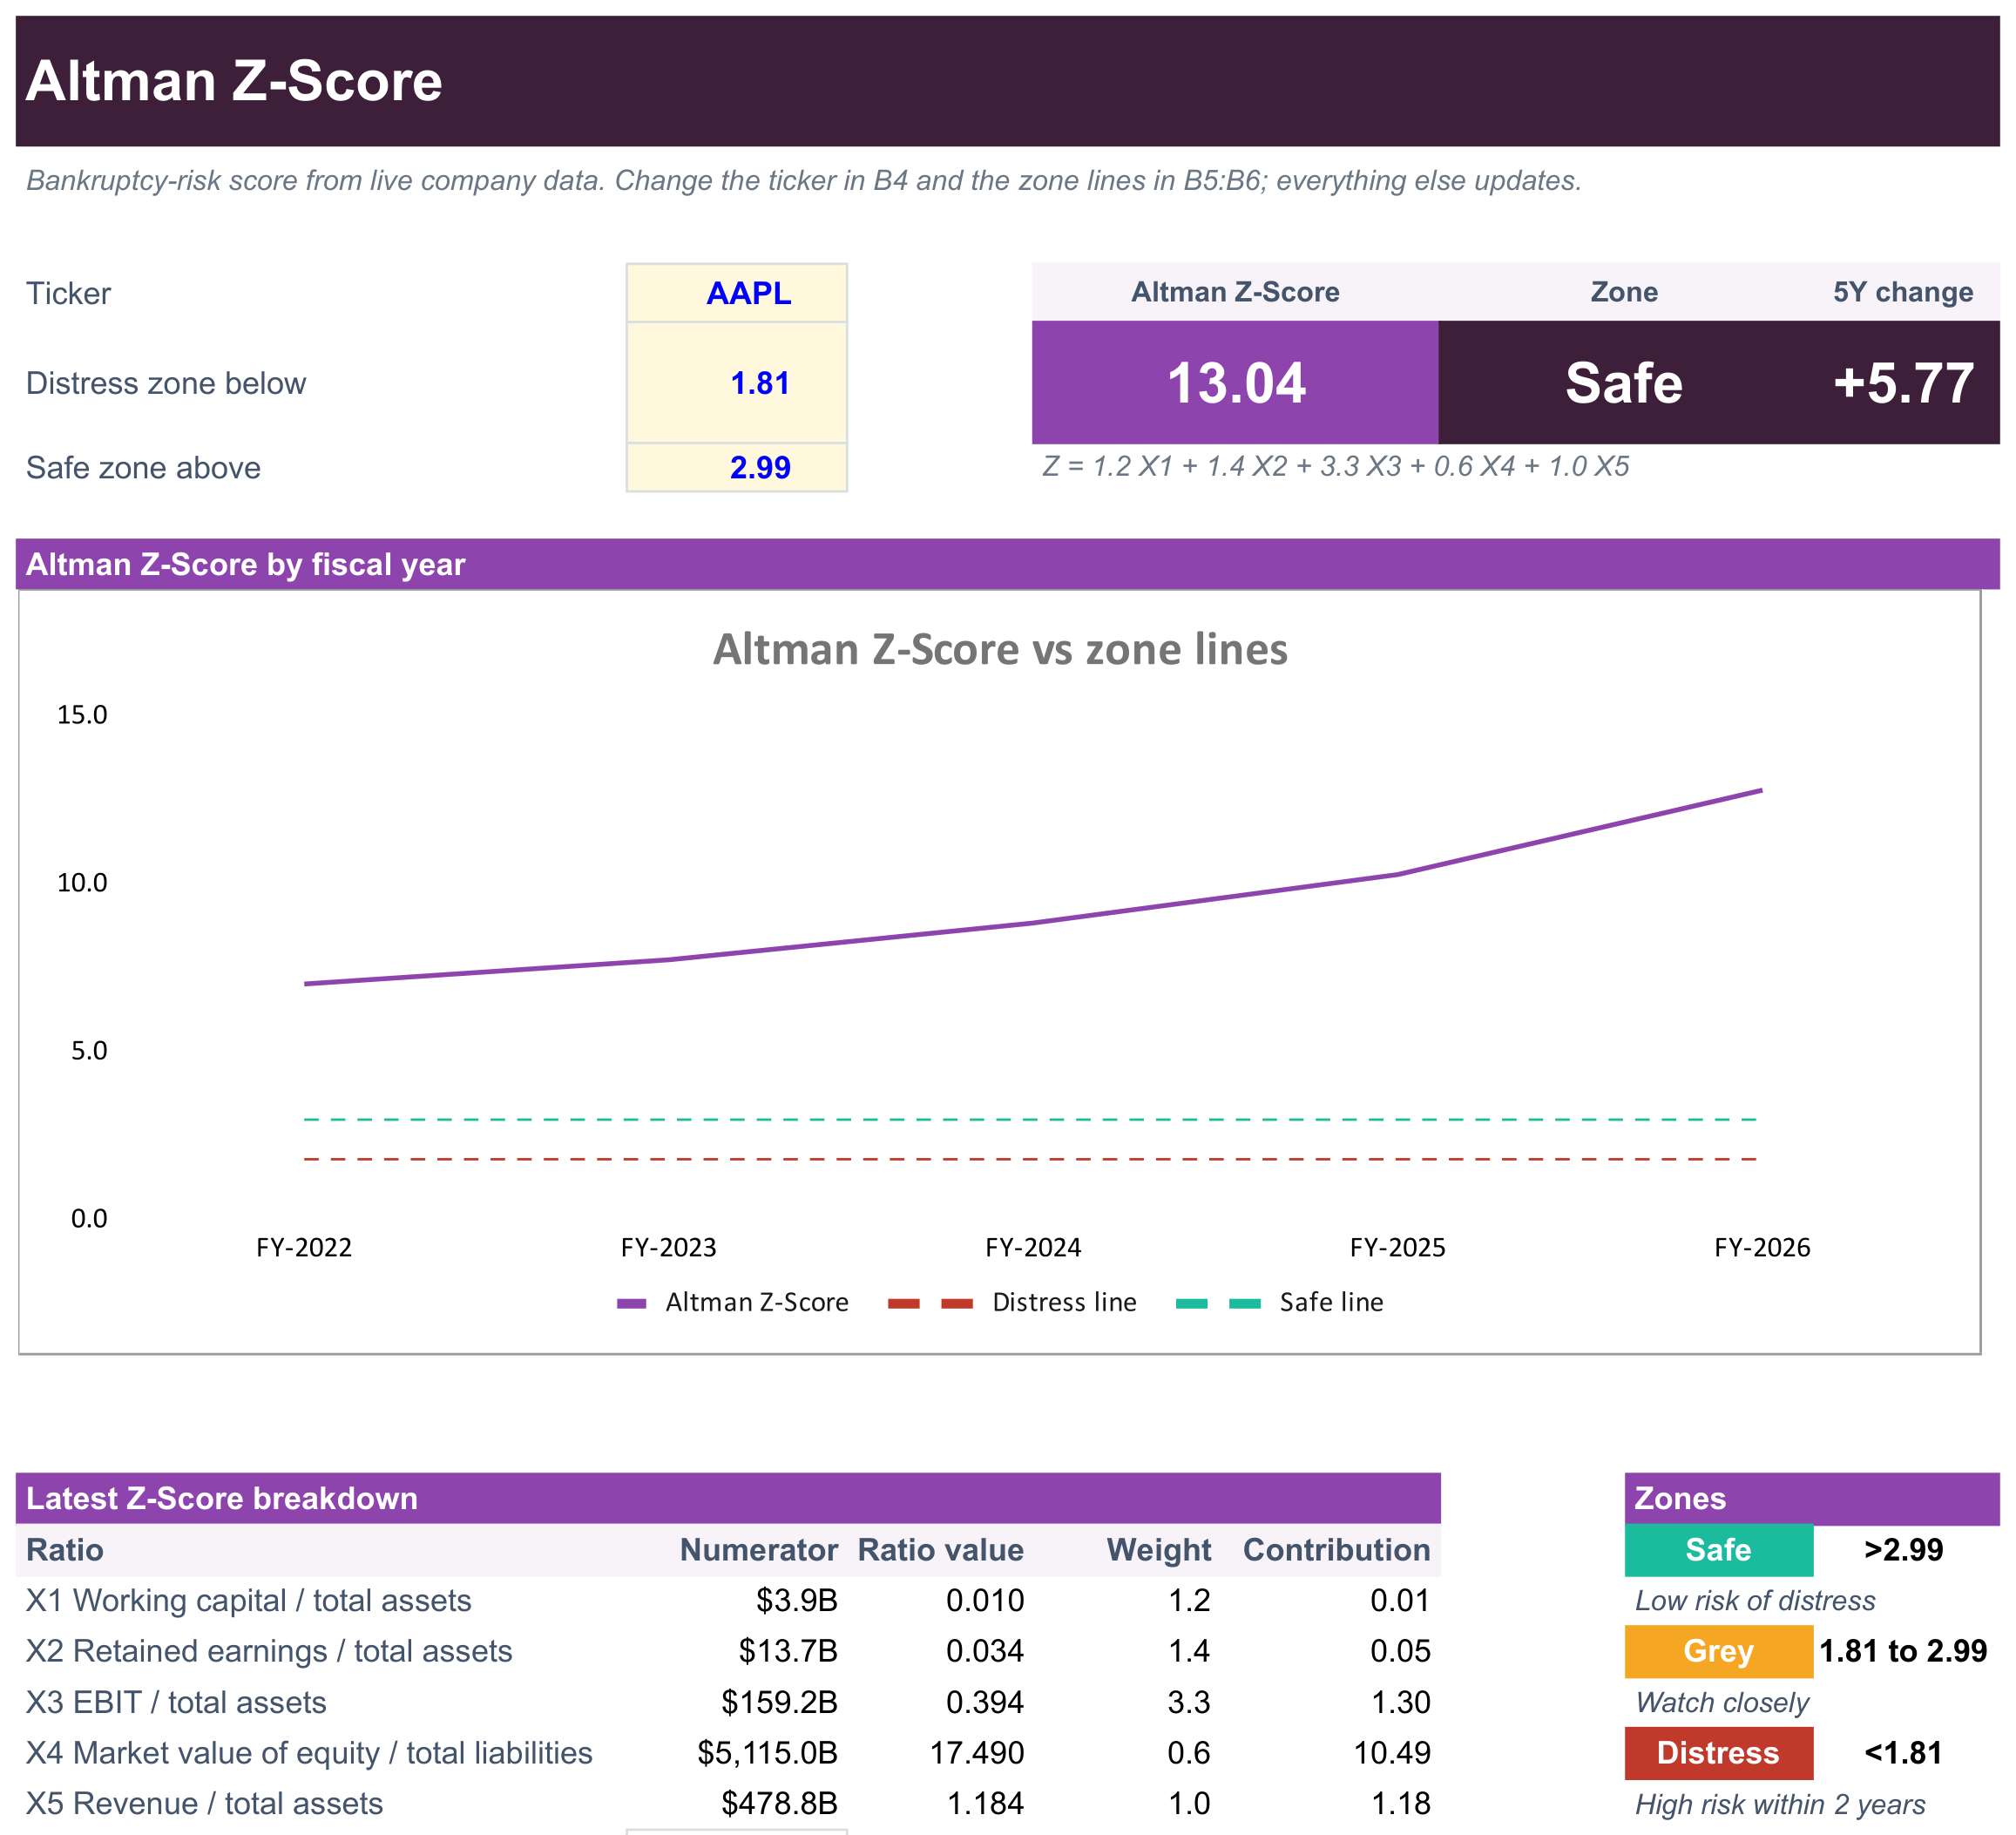
- Headline tiles: the latest Z-Score, its zone (safe, grey or distress) and how far the score has moved over the last five fiscal years.
- Z-Score history chart: the score for each of the last five fiscal years against the distress and safe lines.
- Latest Z-Score breakdown: the five ratios with their weights, so you can see what drives the score:
- X1 working capital / total assets, weight 1.2
- X2 retained earnings / total assets, weight 1.4
- X3 EBIT / total assets, weight 3.3
- X4 market value of equity / total liabilities, weight 0.6
- X5 revenue / total assets, weight 1.0
- SheetsFinance cross-check: SheetsFinance's own reported Z-Score next to the rebuilt one.
- Annual history: the underlying figures, the five ratios and the score for each fiscal year.
The zone lines start at Altman's original 1.81 and 2.99. You can change them in the blue cells B5 and B6, and the tiles, chart and zone guide follow.
The latest breakdown uses today's market cap, while the history uses each fiscal year's year-end market value, so the latest score and the newest year in the history can differ. If a statement is missing a year, that year is left blank rather than shifting the others.
The original Z-Score was built for public manufacturing companies. Treat it with care for banks, insurers and other financial companies, whose balance sheets work differently.
Good for
- A quick financial-health check before you dig into a full valuation such as the SF DCF Valuation Template
- Spotting companies whose balance sheet is getting weaker over time
- Learning how the Z-Score is built and which ratio drives it
How to use it
- Click Copy to Google Sheets to save your own copy.
- Open Extensions → SheetsFinance and make sure you're connected.
- Type a ticker such as
AAPLinto cell B4. - Adjust the distress and safe lines in B5 and B6 if you use different cut-offs.
Functions used
The SheetsFinance functions this template is built with. Read the docs to adapt it.