

Overview
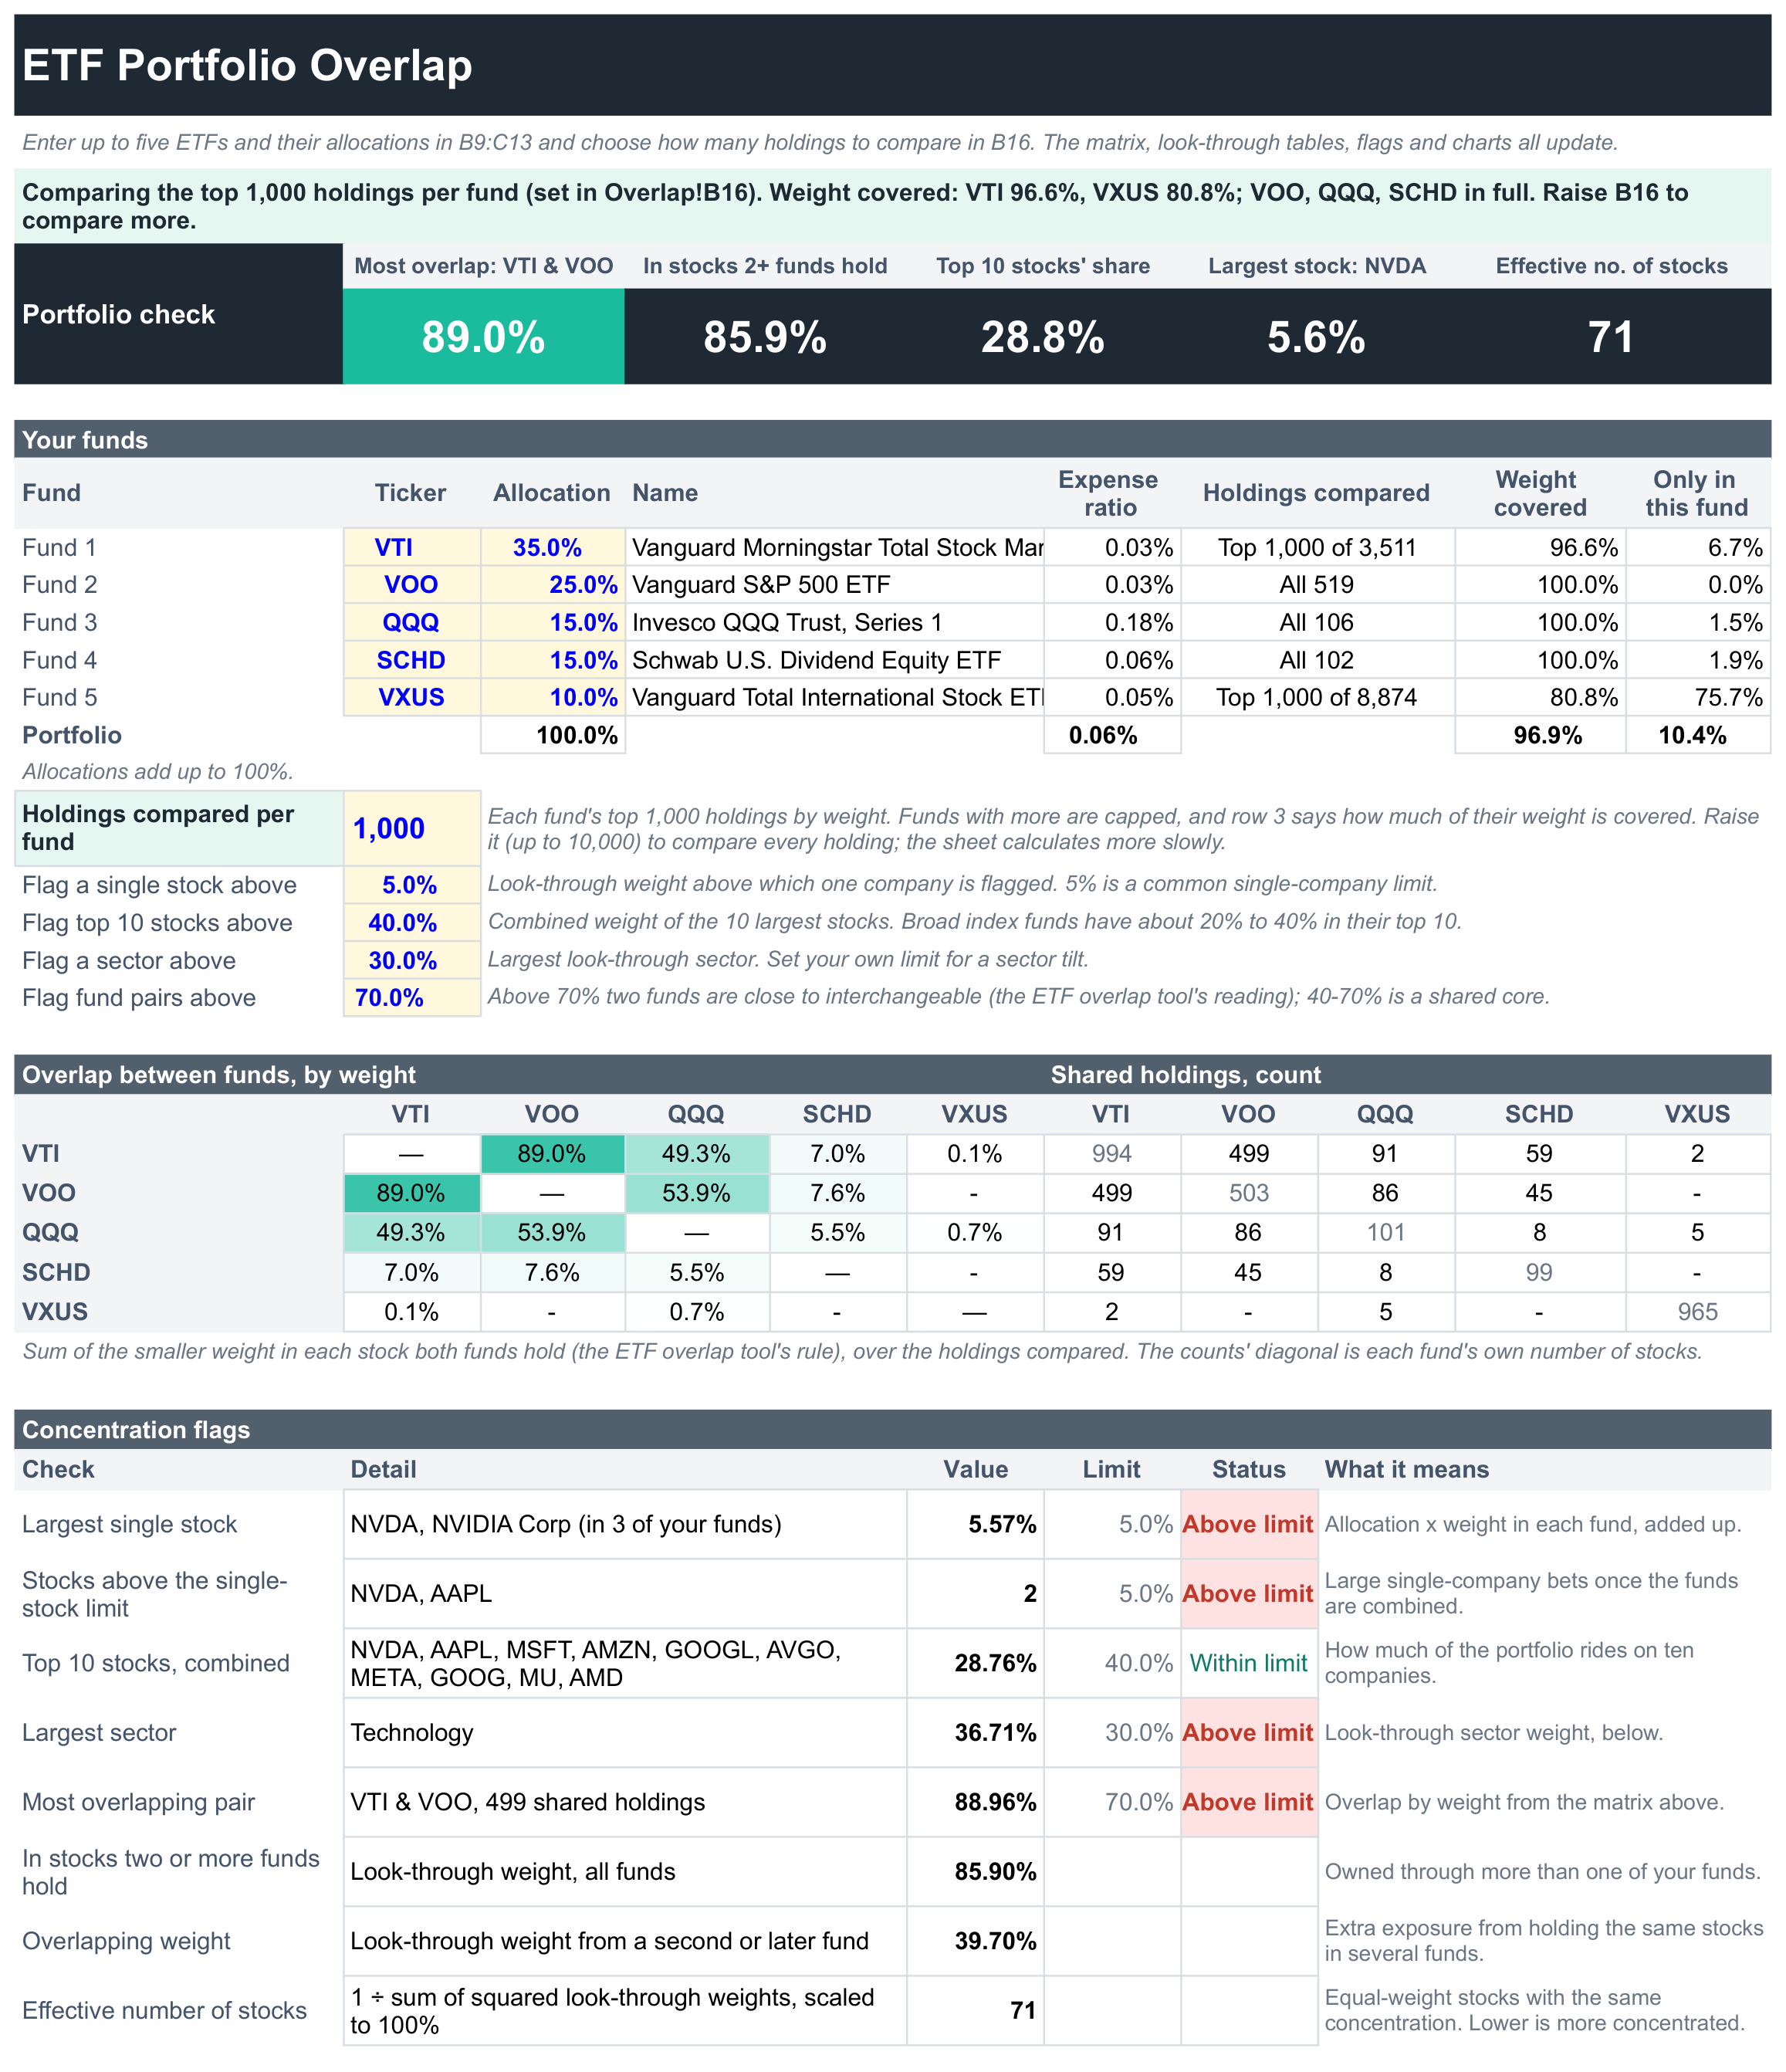
Check the ETF overlap across your whole portfolio: how much your funds duplicate each other, which stocks you really own once they are combined, and where the portfolio is concentrated, for up to five funds in one sheet.
What's inside
- Portfolio check tiles: the most overlapping pair of funds, the share of the portfolio in stocks two or more funds hold, the top 10 stocks' share, the largest single stock and the effective number of stocks.
- Your funds: each fund's name, expense ratio, how many holdings are compared, the share of its weight they cover and its weight in stocks none of your other funds hold, plus the portfolio's blended expense ratio.
- Overlap matrix: the weight overlap between every pair of funds, shaded by size, beside the number of shared holdings.
- Concentration flags: the largest stock, stocks above your single-stock limit, the top 10, the largest sector and the most overlapping pair, each checked against a limit you set.
- Look-through exposure: each stock's combined weight across your funds, with the top 15 and two charts on the dashboard:
- Sector look-through across 11 sectors, and the 10 largest countries
- The full list of every stock on the Look-through sheet, with each fund's weight and its contribution
- Shared holdings sheet: every stock two or more of your funds hold, with its weight in each fund and the overlapping weight.
Enter up to five ETFs in B9 to B13 on the Overlap sheet and your allocation to each in C9 to C13. Set how many holdings per fund to compare in B16. The default of 1,000 covers S&P 500, Nasdaq-100 and dividend funds in full; total-market and international funds hold thousands of stocks, so row 3 on every sheet says how much of each fund's weight is compared. Raise B16 to 10,000 to compare every holding, at the cost of a slower sheet. The limits for the flags are in B17 to B20.
Overlap between two funds is the sum of the smaller weight in each stock both hold, the same rule as the free SheetsFinance ETF overlap tool. Holdings are matched by ISIN, falling back to the ticker.
Good for
- Checking whether the funds you already own duplicate each other before you add another
- Seeing your real exposure to the largest stocks once a total-market, S&P 500 and Nasdaq-100 fund are combined
- Testing a rebalance by changing the allocations and watching the flags
- Going further than the free ETF overlap tool with five funds and your own allocations, alongside the two-fund SF ETF Comparison
How to use it
- Click Copy to Google Sheets to save your own copy.
- Open Extensions → SheetsFinance and make sure you're connected.
- Type up to five funds you own, such as
VTI,VOOandQQQ, into cells B9 to B13 on the Overlap sheet, with your allocation to each in C9 to C13. - Check row 3 for how much of each fund is compared, and raise the holdings count in B16 if you want every holding.
Functions used
The SheetsFinance functions this template is built with. Read the docs to adapt it.