

Overview
Get up to 20 years of income statements, balance sheets and cash flow statements for any listed company, laid out the way analysts read them, with the ratios worked out for every year.
What's inside
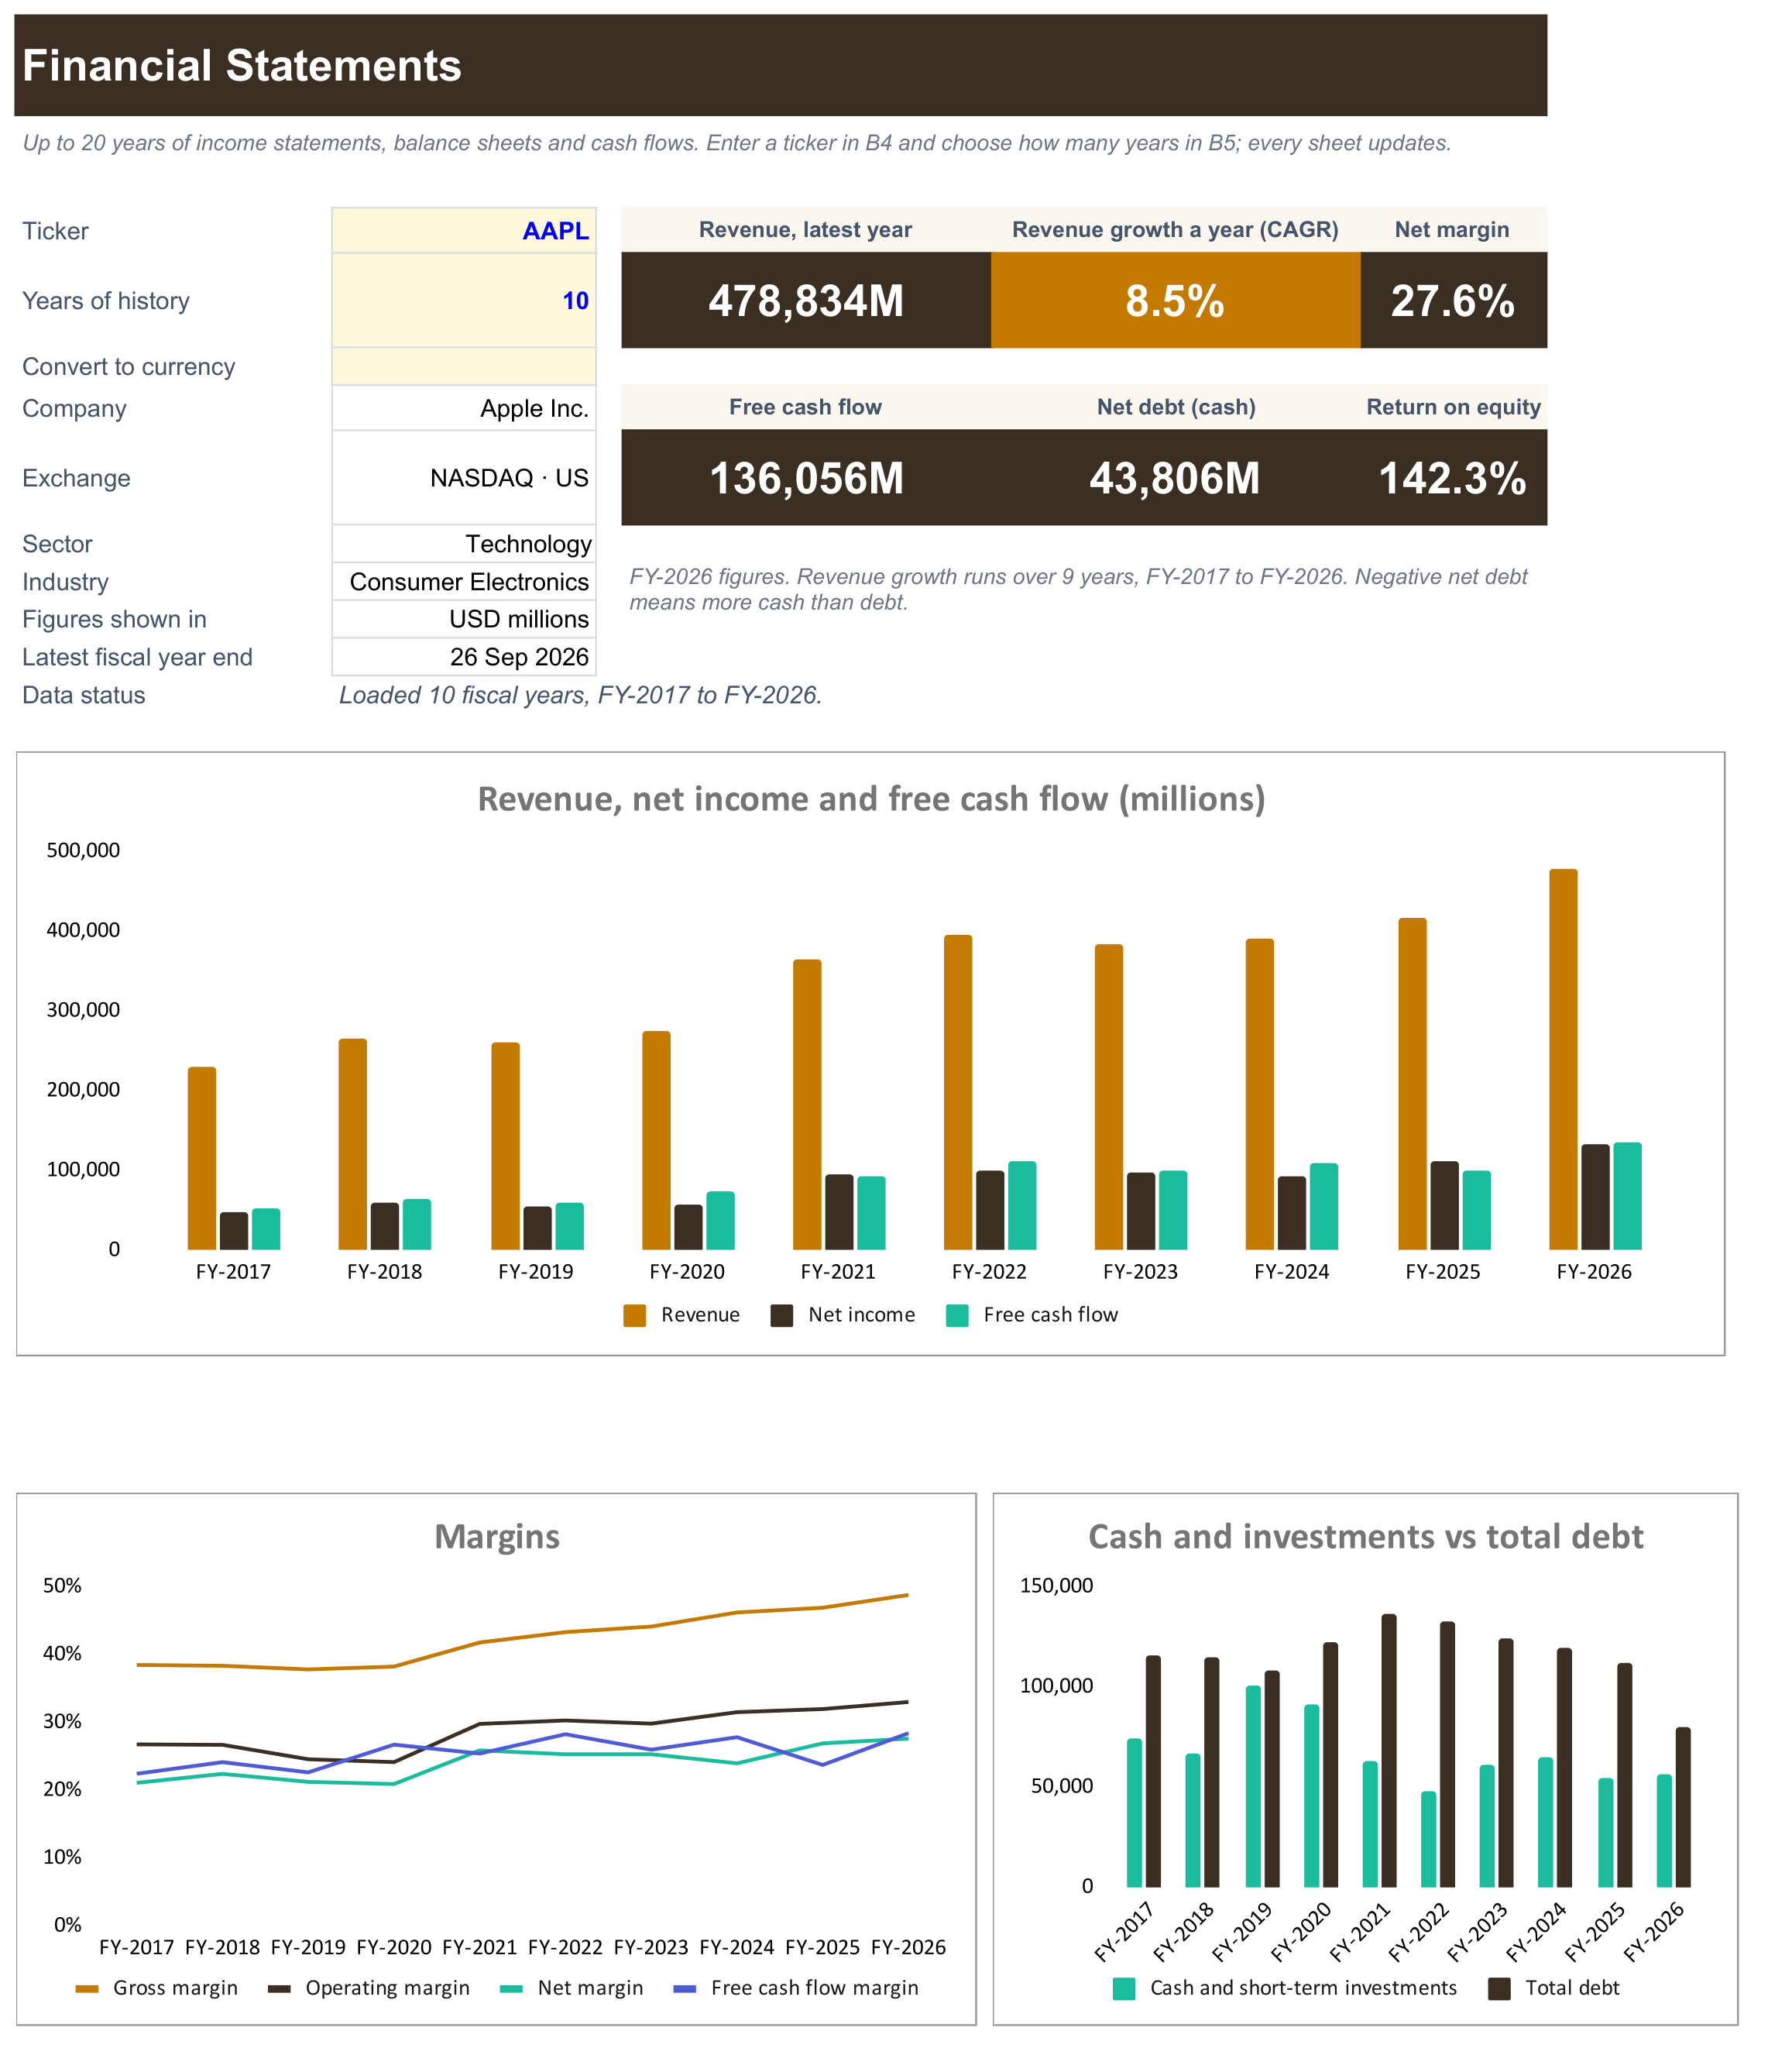
- Summary: the company's details, six headline figures for the latest fiscal year (revenue, revenue growth rate, net margin, free cash flow, net debt and return on equity) and charts of every year you load.
- Income Statement: revenue down to net income with subtotals, EPS and share counts, EBITDA and EBIT, then:
- Revenue and diluted EPS growth
- Gross, operating, EBITDA and net margins
- Effective tax rate, and R&D and SG&A as a share of revenue
- Balance Sheet: assets, liabilities and equity with subtotals and a check that the balance sheet balances in every year, then:
- Total debt, net debt and working capital
- Current ratio, quick ratio, debt to equity and net debt to EBITDA
- Book value and tangible book value per share
- Return on equity, return on assets and return on invested capital
- Cash Flow: operating, investing and financing cash flows and free cash flow, then free cash flow margin, cash conversion, capex and stock-based pay as a share of revenue, dividends per share, payout ratio, and buybacks plus dividends.
- Guide sheet: how the figures are presented, the formula behind every ratio, and the sense checks worth running.
Type a ticker into cell B4 and choose how many fiscal years to load in B5: 2, 5, 10 or 20. Figures are shown in millions of the company's reporting currency, oldest year on the left, with the period end date and filing date for each year. To compare companies in one currency, type a code such as USD or EUR into B6; every year is converted at today's exchange rate.
How far back you can go depends on your SheetsFinance plan: Basic plans can load the last 2 fiscal years, Investor plans up to 10 and Analyst plans and above all 20. If your plan doesn't cover the years you pick, the status line under the inputs says so. Years a company didn't report stay blank, and a ratio shows n/m when the figure it divides by is zero or negative.
Good for
- Reading a company's long-term track record on one page
- Checking margins, returns and cash conversion before you invest
- Spotting rising debt, shrinking cash or a weakening balance sheet early
- Pulling clean historical inputs for the SF DCF Valuation Template or your own model
How to use it
- Click Copy to Google Sheets to save your own copy.
- Open Extensions → SheetsFinance and make sure you're connected.
- Type a ticker such as
AAPLinto cell B4 on the Summary sheet. - Choose how many years to load in cell B5, and type a currency code into B6 if you want the figures converted.
- Read the Guide sheet for how each ratio is calculated.
Functions used
The SheetsFinance functions this template is built with. Read the docs to adapt it.