

Overview
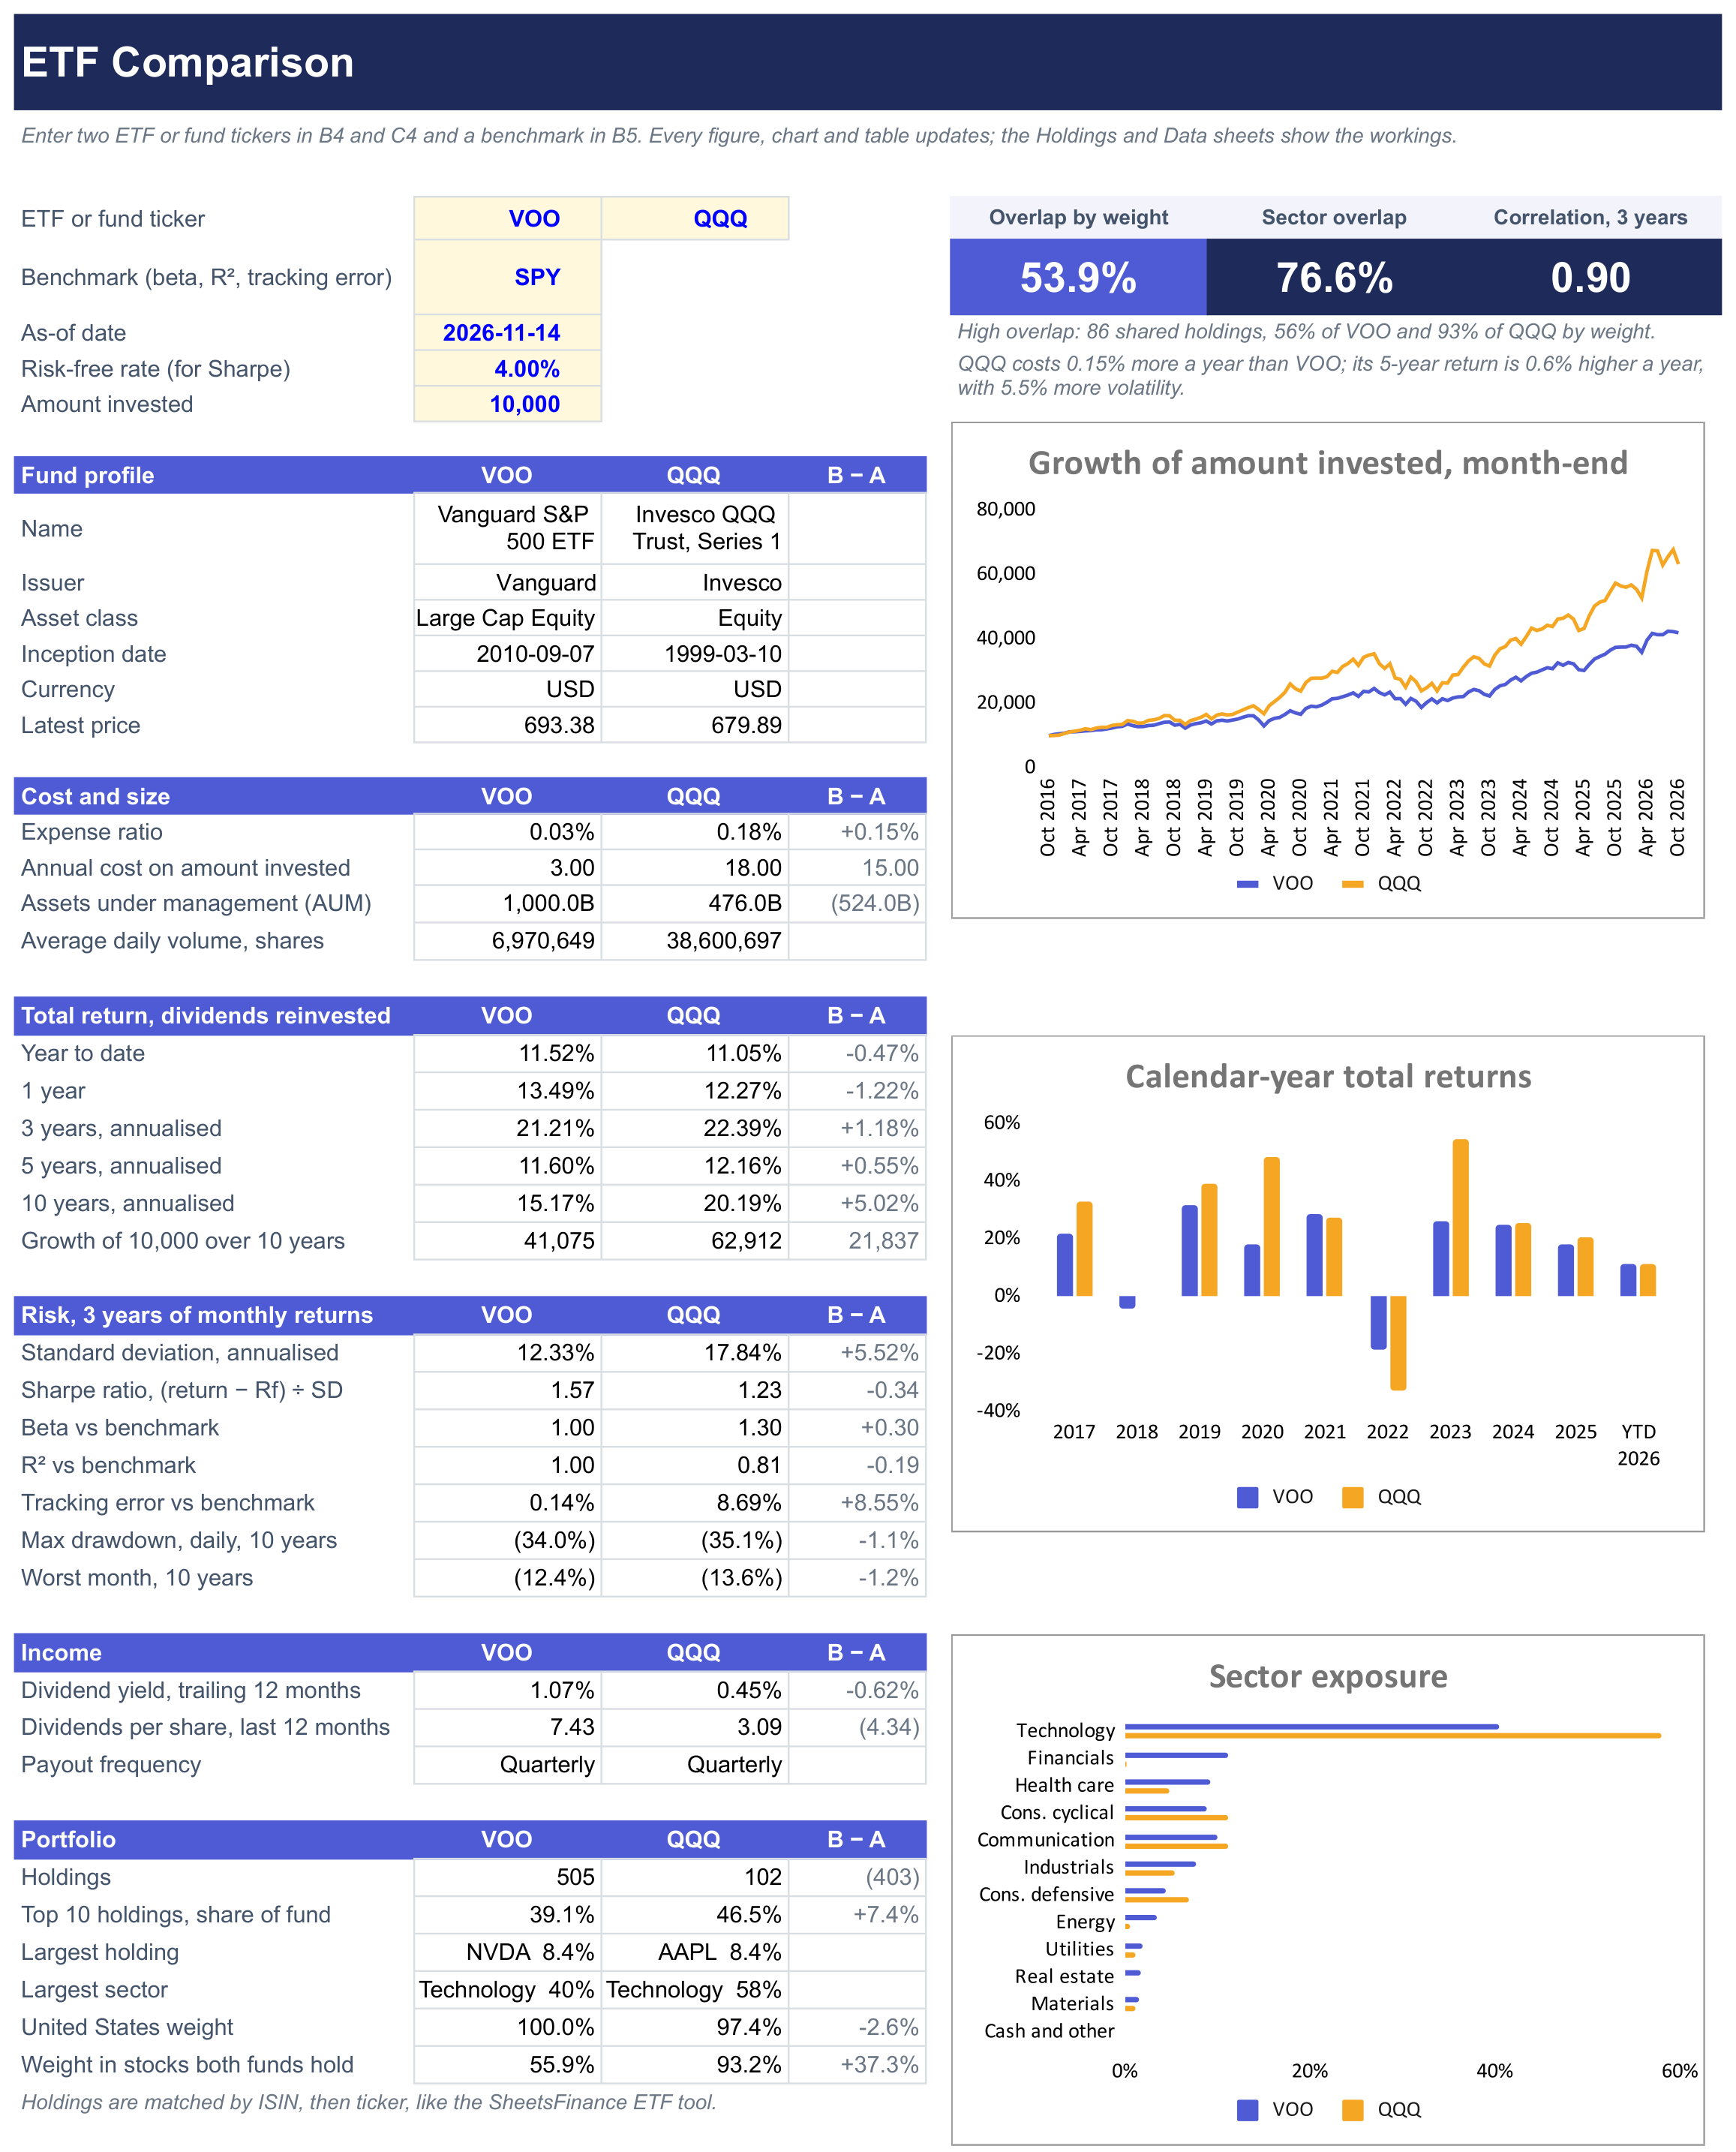
Compare two ETFs or index funds side by side: cost, size, returns, risk, income and how much the two portfolios overlap, all from live data in one sheet.
What's inside
- Headline tiles: overlap by weight, sector overlap and the 3-year correlation of the two funds, with a one-line verdict on the overlap and on cost, return and volatility.
- Side-by-side scorecard: each fund in its own column with the difference beside it:
- Fund profile: name, issuer, asset class, inception date, currency and latest price
- Cost and size: expense ratio, the annual cost on your investment, assets under management and trading volume
- Total return with dividends reinvested: year to date and 1, 3, 5 and 10 years annualised
- Risk from 36 monthly returns: standard deviation, Sharpe ratio, beta, R-squared and tracking error against your benchmark, plus the daily max drawdown and worst month over 10 years
- Income: trailing 12-month yield, dividends per share and payout frequency
- Portfolio: holdings, top 10 concentration, largest holding and sector, US weight, and how much of each fund sits in stocks both hold
- Calendar-year returns: the last nine years and this year to date, as a table and a chart.
- Sector and country exposure: both funds on the same sector list with the sector overlap, and each fund's largest countries with the geographic overlap.
- Largest shared holdings: the ten stocks that contribute most to the overlap, with each fund's weight.
- Holdings and Data sheets: every holding matched across the two funds, and the prices, dividends and calculations behind each figure.
Enter the two funds in B4 and C4 and a benchmark such as SPY in B5. You can also set the as-of date in B6, the risk-free rate for the Sharpe ratio in B7 and the amount invested in B8. Holdings are matched by ISIN, falling back to the ticker, the same way as the SheetsFinance ETF comparison tool. A figure is left blank when a fund is too young for the period, and the overlap shows n/a for funds that don't publish holdings.
Good for
- Choosing between two funds that track similar indexes, such as VOO and IVV or VTI and VOO
- Checking whether two funds you already own duplicate each other before adding a third
- Weighing a cheaper fund against one with a stronger record, net of fees
- Going further than the free ETF comparison tool with your own benchmark, dates and risk-free rate, alongside the single-fund SF ETF Analysis Template
How to use it
- Click Copy to Google Sheets to save your own copy.
- Open Extensions → SheetsFinance and make sure you're connected.
- Type the two funds you want to compare, such as
VOOandQQQ, into cells B4 and C4 on the Compare sheet. - Set a benchmark in B5 that suits the funds, such as
SPYfor US stocks orACWIfor global funds, and your risk-free rate in B7.
Google Sheets
Excel
Functions used
The SheetsFinance functions this template is built with. Read the docs to adapt it.