Dividends
Historical company dividends can be generated via SF_DIVIDEND(). This function will return multiple rows and columns of data depending on the date range supplied and the metrics requested. The function layout is as follows:
=SF_DIVIDEND(symbol, startDate, endDate, metric, options)symbolis the ticker symbol of the financial asset (e.g.,"AAPL"). You can use our Symbol Search to find the correct ticker symbol.startDateis the start date for the dividend history, written in iso format YYY-MM-DD, e.g."2000-04-03"endDateis the end date for the dividend history, written in iso format YYY-MM-DD, e.g."2019-12-24"metricselects what metrics to display. Leave blank or enter"all"to display all available metrics. You can also select a single metric or multiple metrics by chaining them together with the&operator, e.g."date÷nd&paymentDate".optionsadjusts the formatting of the output."-"reverses the default output order and"NH"removes the header on the output. These can be combined by chaining with the&operator like so"-&NH".
The dividend metric options are:
All (
"all")Date (
"date")Dividend (
"dividend")Adjusted Dividend (
"adjDividend")Record Date (
"recordDate")Payment Date (
"paymentDate")Declaration Date (
"declarationDate")Yield (
"yield")Frequency (
"frequency")
Tips:
Leaving
metricblank will default to displaying all metrics, the same as inputting"all".You can chain together metrics to display a subset using the
&character, such as"date÷nd".
Example 1 - All metrics no formatting
=SF_DIVIDEND("AAPL", "2015-10-12", "2022-03-10", "all")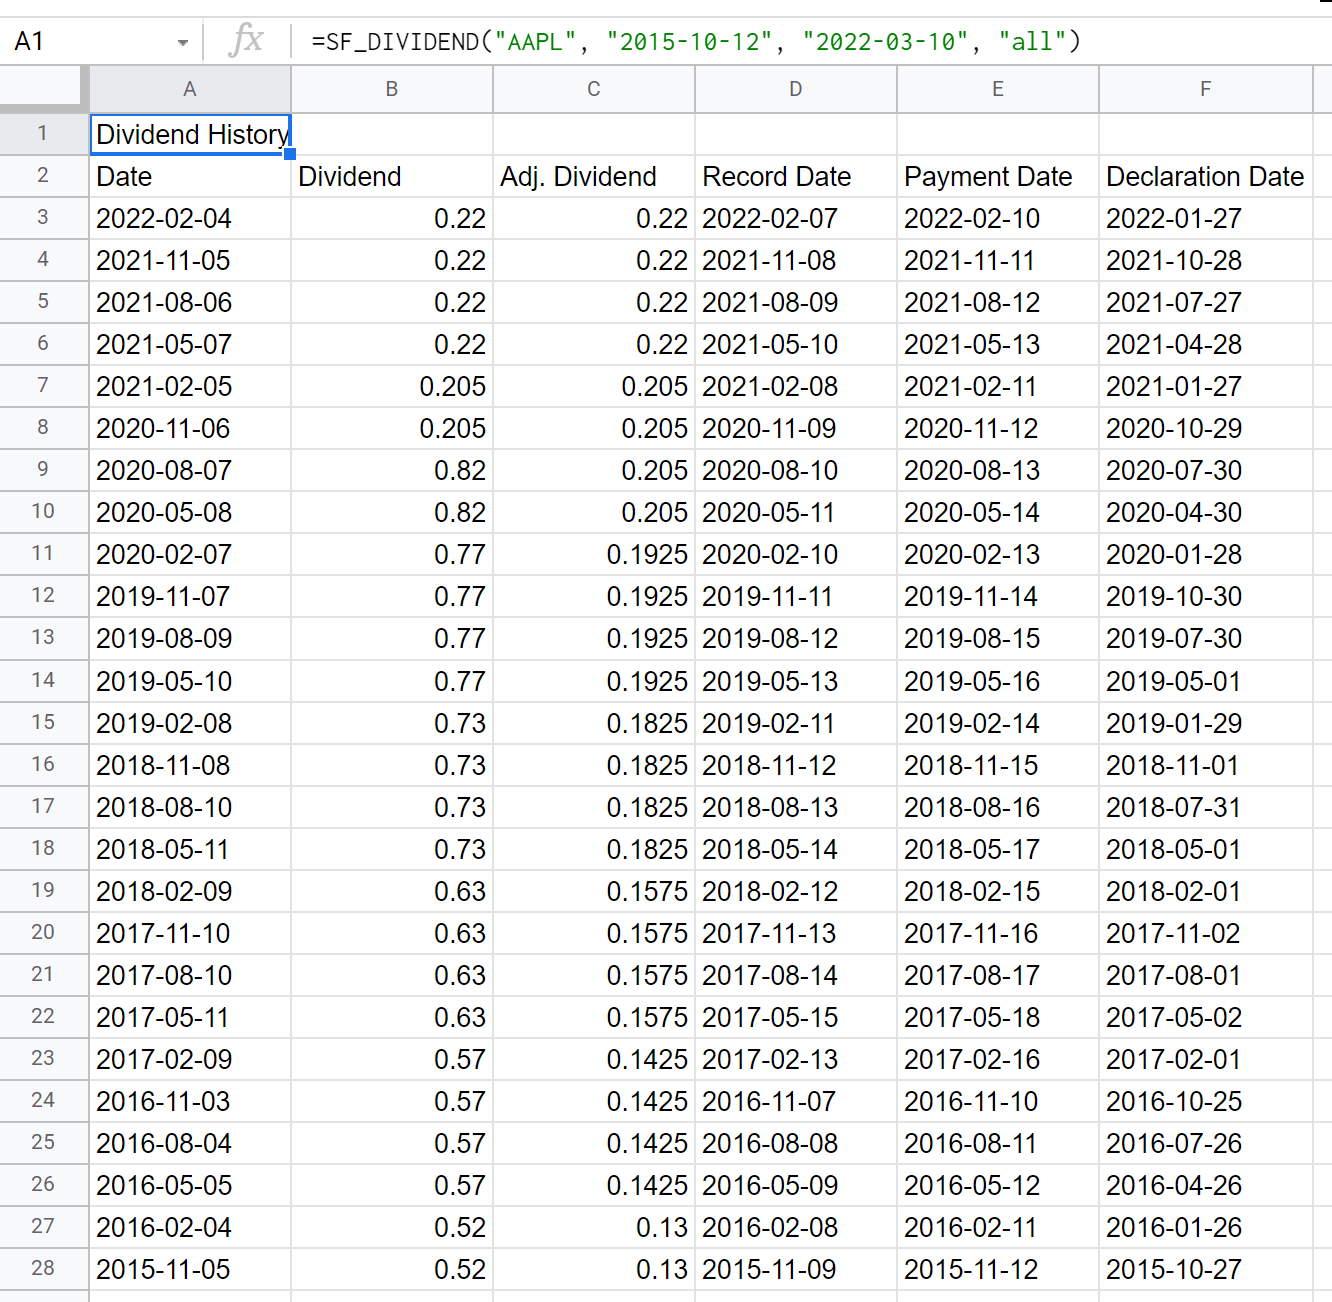
Example 2 - Single metric no formatting
=SF_DIVIDEND("AAPL", "2015-10-12", "2022-03-10", "dividend")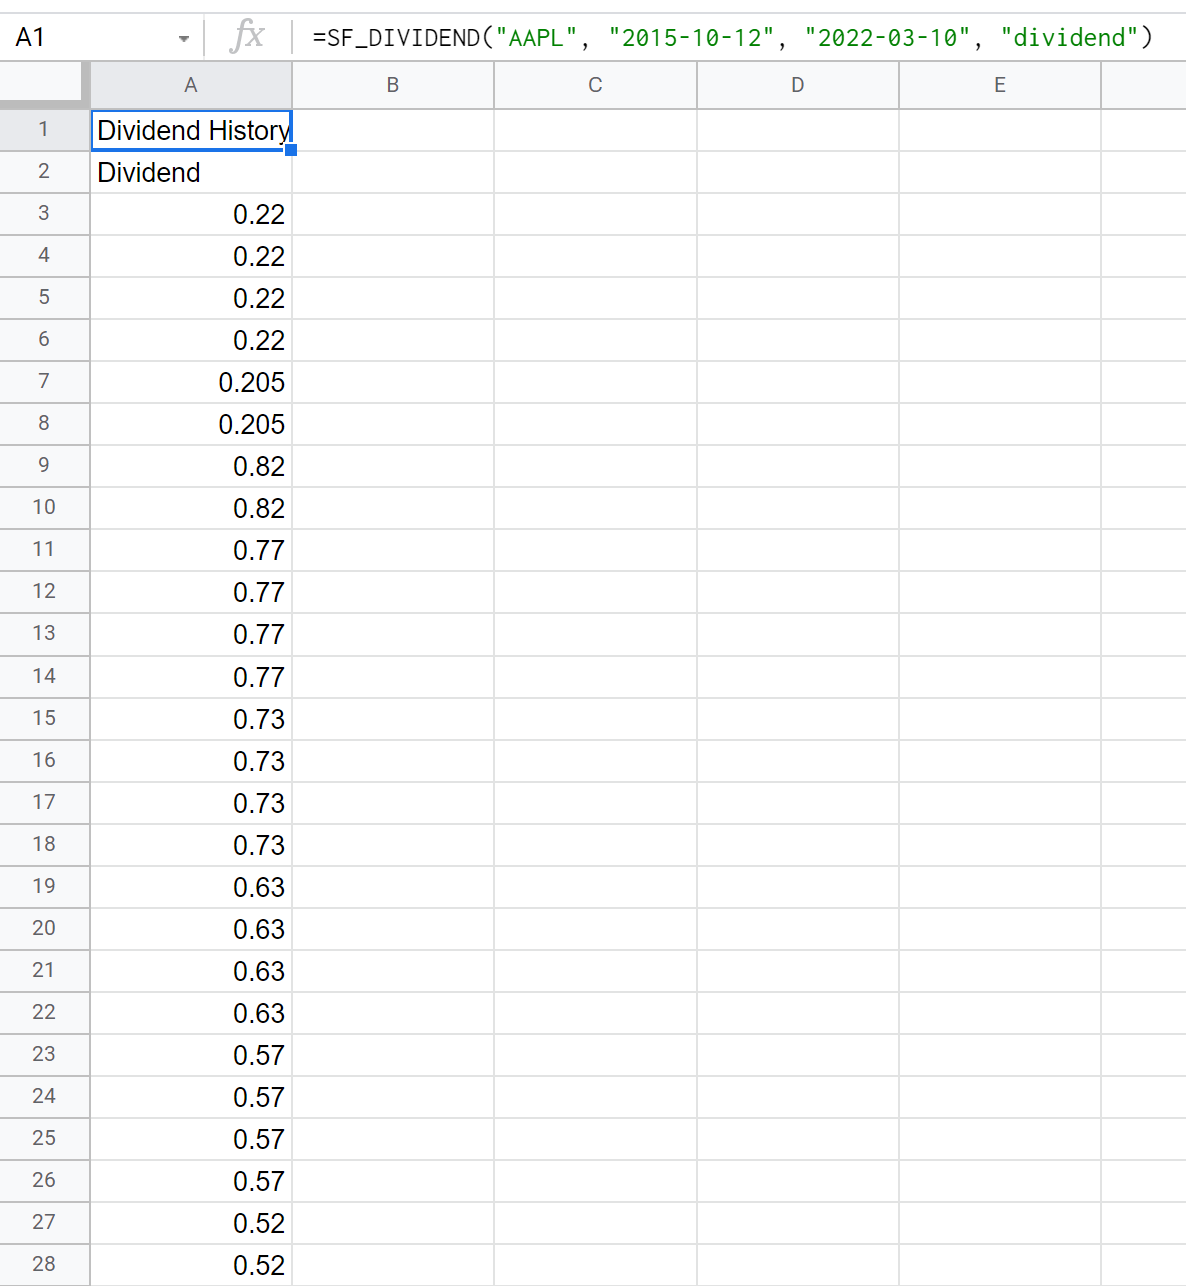
Example 3 - Multiple metrics no formatting
=SF_DIVIDEND("AAPL", "2015-10-12", "2022-03-10", "date÷nd&paymentDate")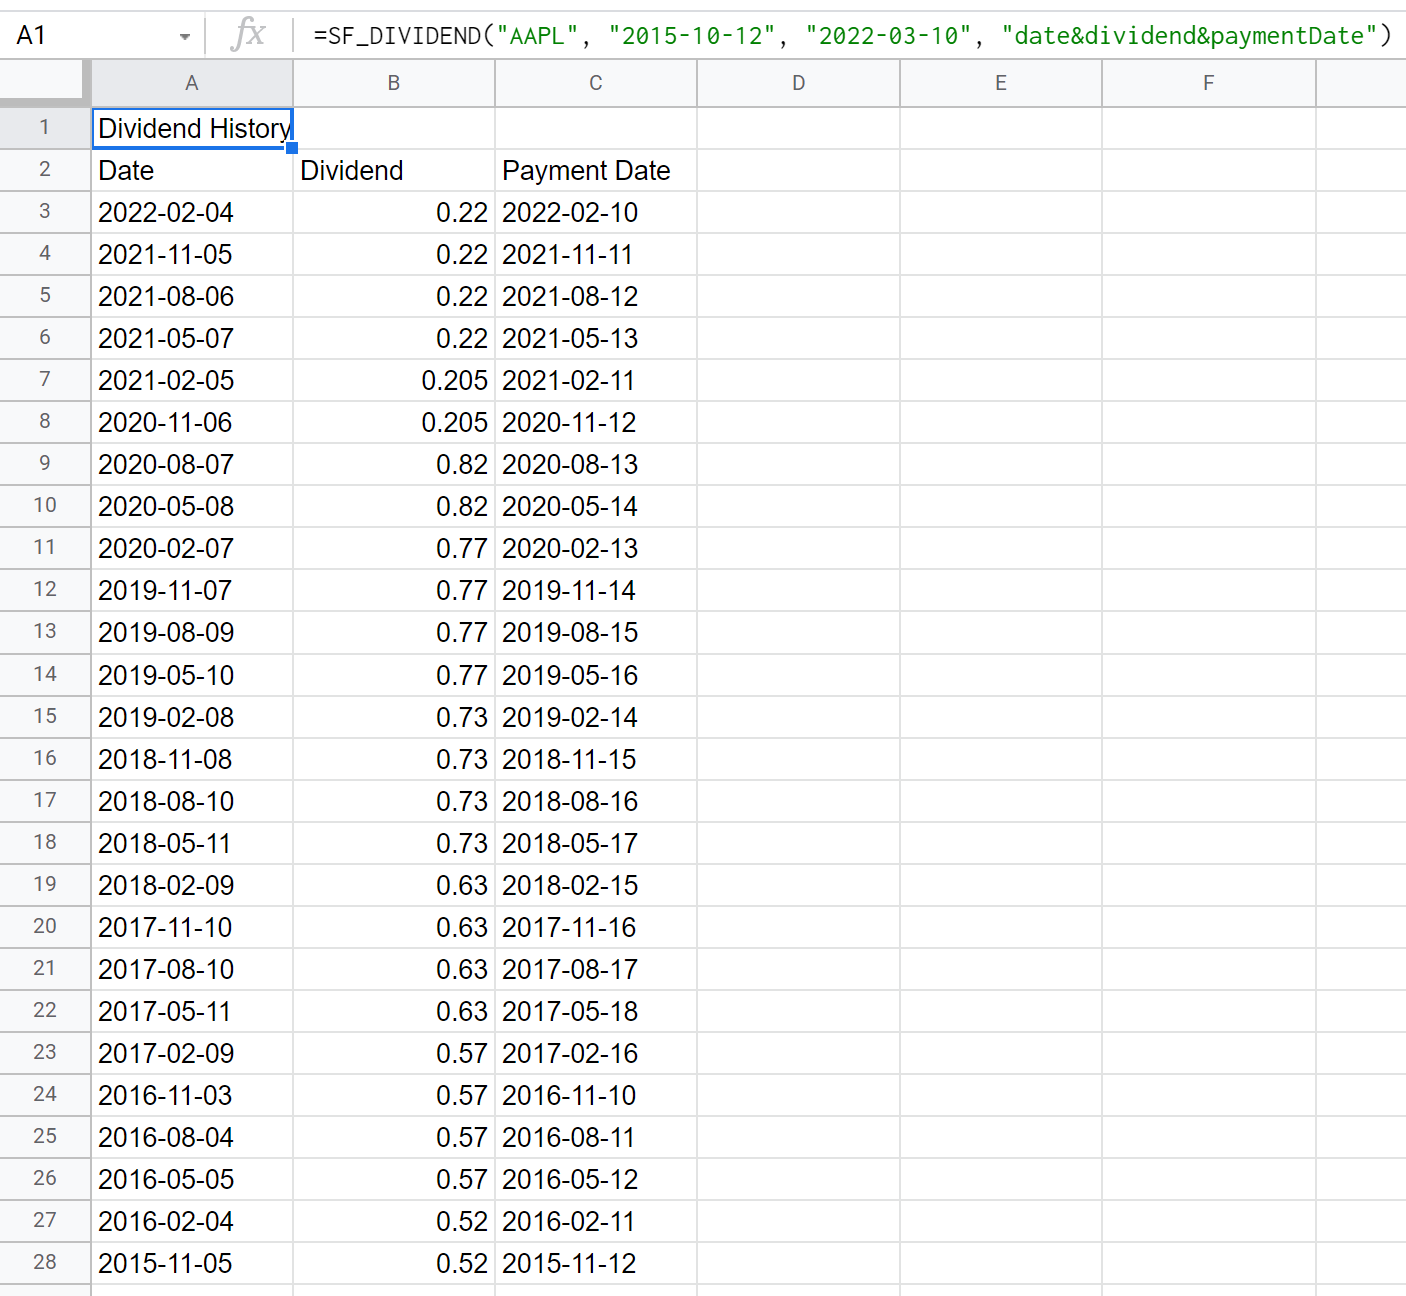
Example 4 - Multiple metrics no header
=SF_DIVIDEND("AAPL", "2015-10-12", "2022-03-10", "date÷nd&adjDividend", "NH")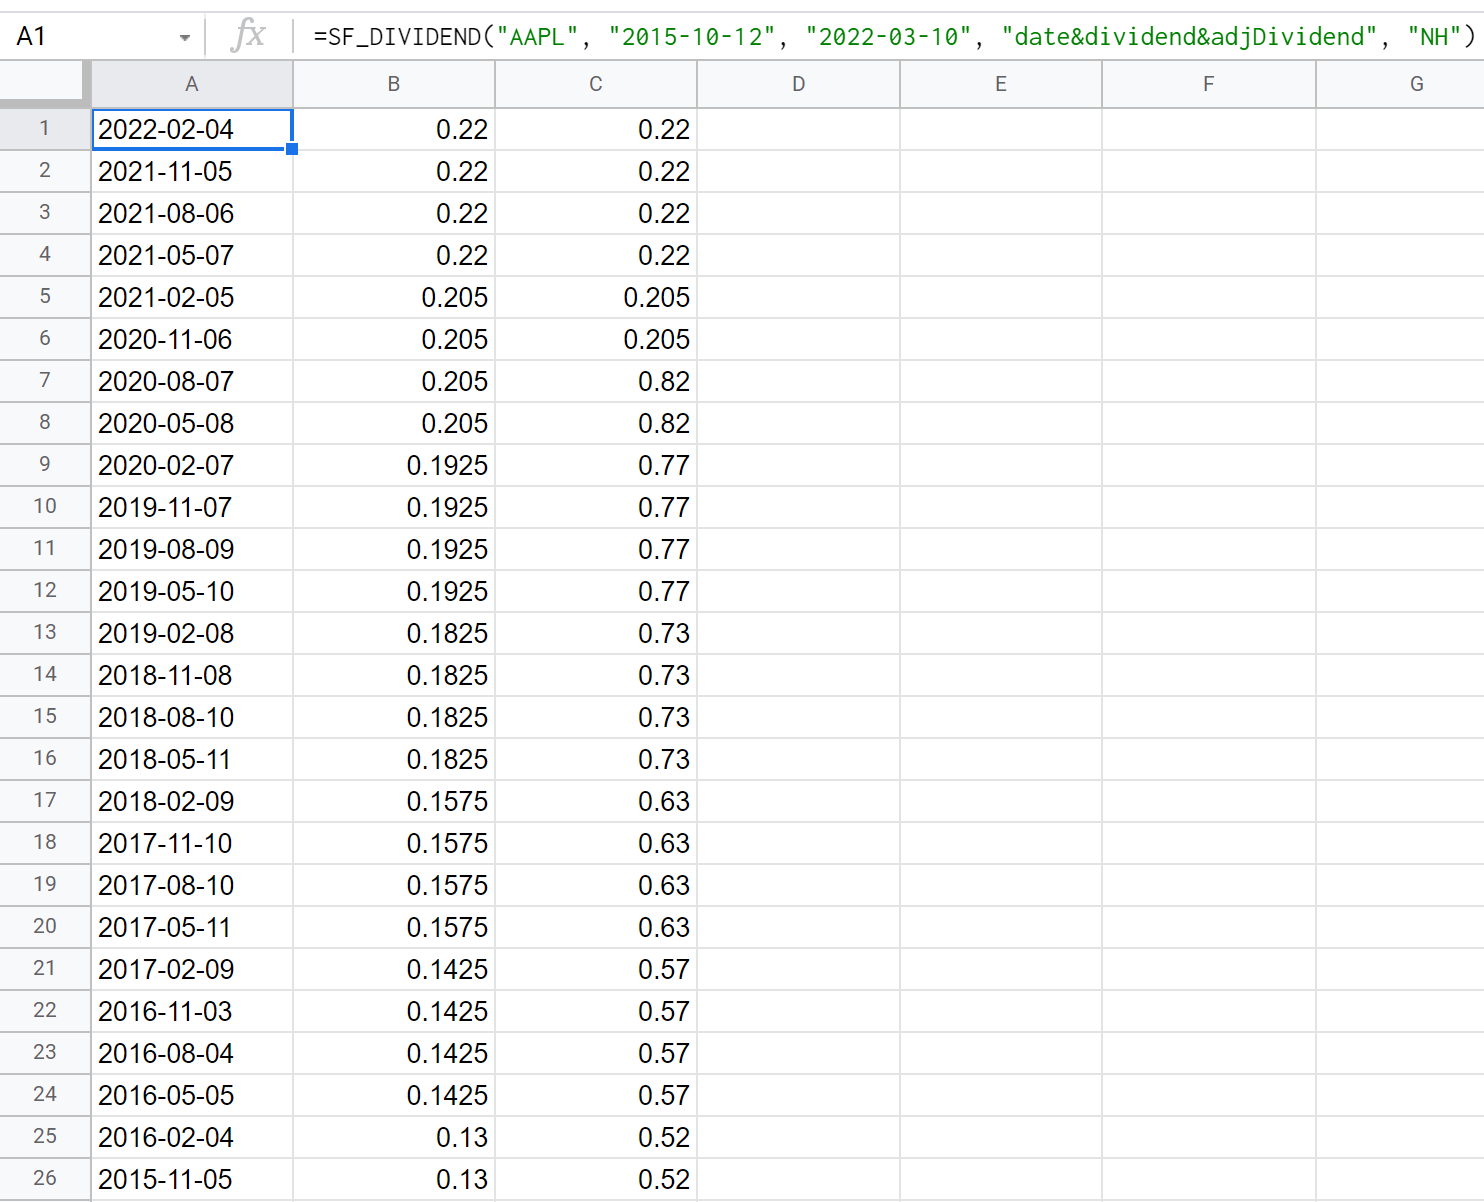
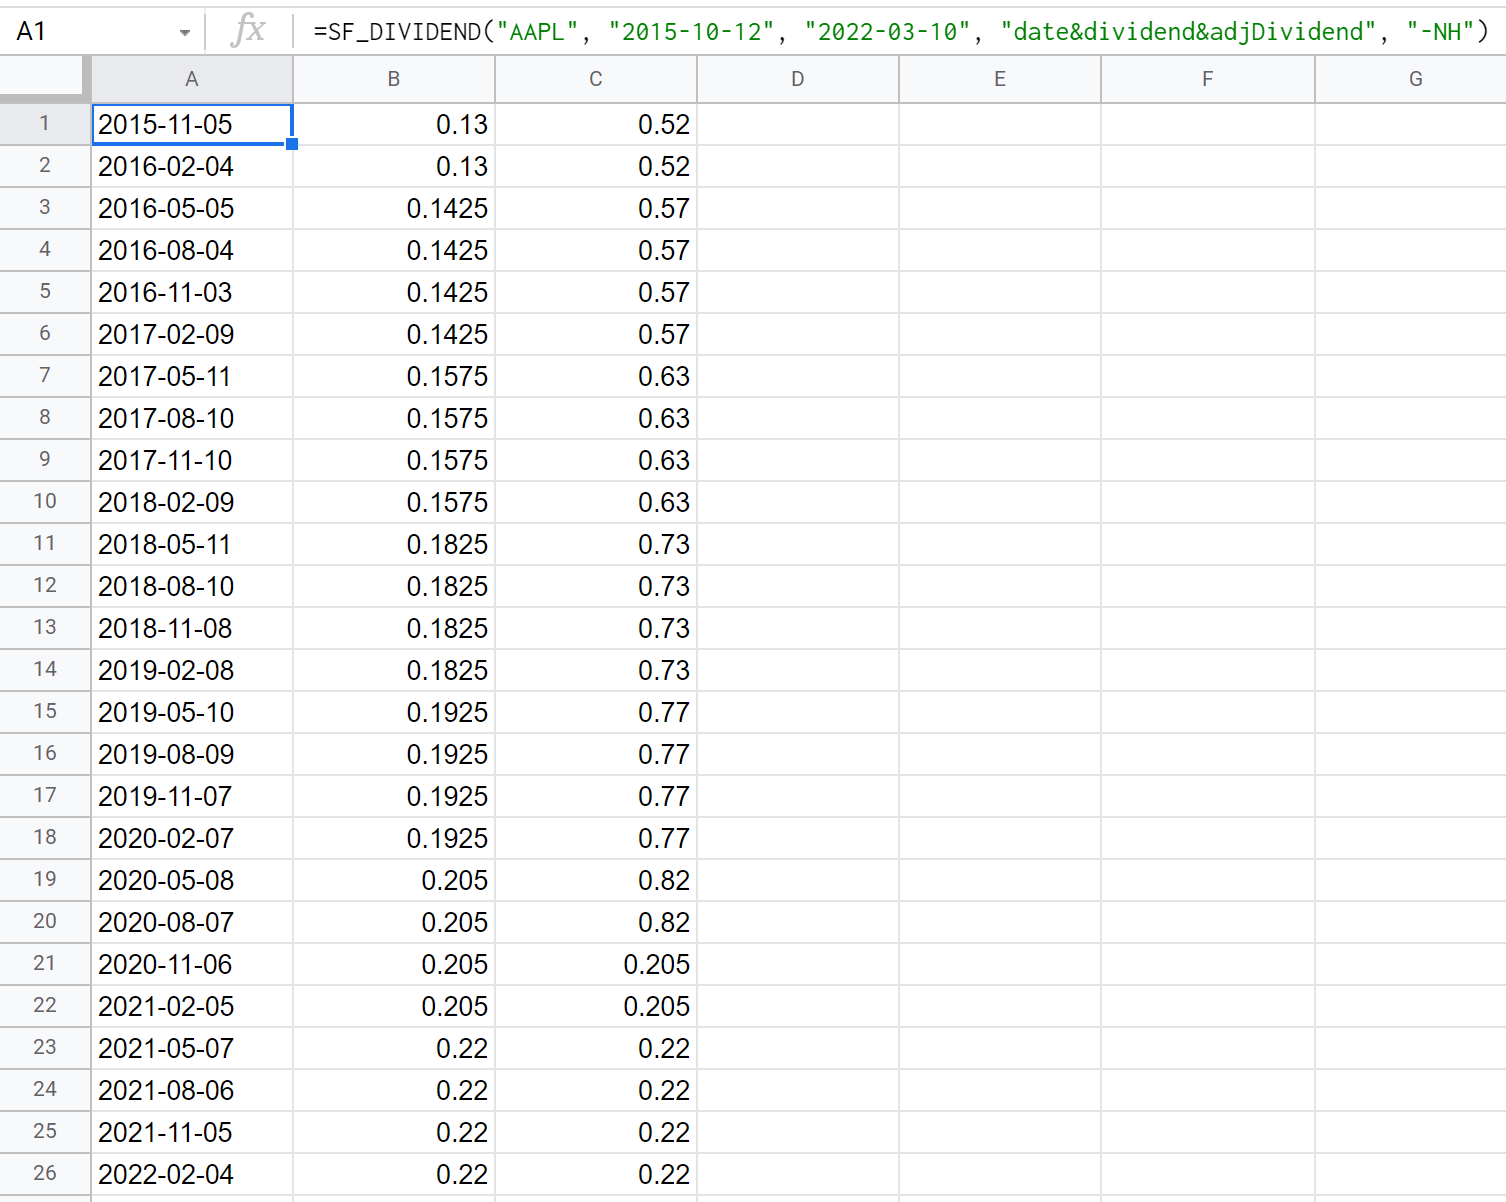
Example 5 - Multiple metrics, no header, reversed order
=SF_DIVIDEND("AAPL", "2015-10-12", "2022-03-10", "date÷nd&adjDividend", "-NH")