
Stock Screener
Important: Use our in-built Stock Screener, to create the SF_SCREEN() function automatically, read up more on how to use it here
If you're looking to screen our entire database of financial assets by a variety of metrics, then SF_SCREEN() is what you're after. Unlike all other SheetsFinance functions, SF_SCREEN() is not centered around a specific stock symbol/code but rather a series of filters that is used to screen our database of over 80,000 assets. Whilst filters are used to run the screen, it's the metrics that determine the output.
=SF_SCREEN(filters, metrics, options)filtersis the combinations of filters that control the screen. Filters combine a metric, operator and value. For example, this is a filtermarketCap>500000000where the metric ismarketCapthe operator is>and the value is500000000. Available operators are>,<and=. You can combine multiple filters using the&operator, e.g."marketcap>1000000000&exchange=NYSE,NASDAQ§or=Technology". Some filters accept multiple values, in which case you can separate them with commas, e.g."exchange=NYSE,NASDAQ".metricsUse this parameter to select which items you'd like included in the output of the screen. These do not need to be the same or a subset of filters. If left blank or as"all"then only the basic metrics are returned. You can chain together multiple metrics using the&operator. E.g.,"symbol§or&industry&exchange&marketCap&price".optionsadjusts the formatting of the output. There are a number of available options, such as removal of the header rows ("NH"), or ordering of the output ("ob=marketCap"). See the full list of options below. Options can be chained together using the&symbol. E.g."NH&ob=beta".
🤨 Filters vs Metrics:
Filters are used to narrow down the universe of stocks to those that meet certain criteria. They are applied before the data is retrieved and determine which stocks are included in the results.
Metrics are the specific data points that you want to retrieve for the stocks that pass the filters. They are applied after the data is retrieved and determine what information is included in the output.
Filters
To compose your screen, first select the filters you'd like and then chain them together using the & operator. There are two kinds of filters:
Basic (11 available)
Advanced (98 available)
Basic Filters
Our basic filters are available for all plans from Investor up. They are as follows:
Market Cap (
"marketCap")Price (
"price")Beta (
"beta")Volume (
"volume")Average Volume (
"averageVolume")Last Annual Dividend (
"lastDividend")ETF (
"isEtf")Actively Trading (
"isActivelyTrading") -- defaults totrue, see OptionsSector (
"sector") - e.g.,"Technology"Industry (
"industry") - e.g.,"Software—Infrastructure"Country (
"country") - 2 letter country codes e.g.,"US"and"AU"Exchange (
"exchange")IPO Date (
"ipoDate")
Advanced Filters
Advanced filters are available for our Analyst plan and all our commercial plans. There are currently 98 advanced filters available:
Gross Profit Margin TTM (
"grossProfitMarginTTM")EBIT Margin TTM (
"ebitMarginTTM")EBITDA Margin TTM (
"ebitdaMarginTTM")Operating Profit Margin TTM (
"operatingProfitMarginTTM")Pretax Profit Margin TTM (
"pretaxProfitMarginTTM")Continuous Operations Profit Margin TTM (
"continuousOperationsProfitMarginTTM")Net Profit Margin TTM (
"netProfitMarginTTM")Bottom Line Profit Margin TTM (
"bottomLineProfitMarginTTM")Receivables Turnover TTM (
"receivablesTurnoverTTM")Payables Turnover TTM (
"payablesTurnoverTTM")Inventory Turnover TTM (
"inventoryTurnoverTTM")Fixed Asset Turnover TTM (
"fixedAssetTurnoverTTM")Asset Turnover TTM (
"assetTurnoverTTM")Current Ratio TTM (
"currentRatioTTM")Quick Ratio TTM (
"quickRatioTTM")Solvency Ratio TTM (
"solvencyRatioTTM")Cash Ratio TTM (
"cashRatioTTM")Price To Earnings Ratio TTM (
"priceToEarningsRatioTTM")Price To Earnings Growth Ratio TTM (
"priceToEarningsGrowthRatioTTM")Forward Price To Earnings Growth Ratio TTM (
"forwardPriceToEarningsGrowthRatioTTM")Price To Book Ratio TTM (
"priceToBookRatioTTM")Price To Sales Ratio TTM (
"priceToSalesRatioTTM")Price To Free Cash Flow Ratio TTM (
"priceToFreeCashFlowRatioTTM")Price To Operating Cash Flow Ratio TTM (
"priceToOperatingCashFlowRatioTTM")Debt To Assets Ratio TTM (
"debtToAssetsRatioTTM")Debt To Equity Ratio TTM (
"debtToEquityRatioTTM")Debt To Capital Ratio TTM (
"debtToCapitalRatioTTM")Long Term Debt To Capital Ratio TTM (
"longTermDebtToCapitalRatioTTM")Financial Leverage Ratio TTM (
"financialLeverageRatioTTM")Working Capital Turnover Ratio TTM (
"workingCapitalTurnoverRatioTTM")Operating Cash Flow Ratio TTM (
"operatingCashFlowRatioTTM")Operating Cash Flow Sales Ratio TTM (
"operatingCashFlowSalesRatioTTM")Free Cash Flow Operating Cash Flow Ratio TTM (
"freeCashFlowOperatingCashFlowRatioTTM")Debt Service Coverage Ratio TTM (
"debtServiceCoverageRatioTTM")Interest Coverage Ratio TTM (
"interestCoverageRatioTTM")Short Term Operating Cash Flow Coverage Ratio TTM (
"shortTermOperatingCashFlowCoverageRatioTTM")Operating Cash Flow Coverage Ratio TTM (
"operatingCashFlowCoverageRatioTTM")Capital Expenditure Coverage Ratio TTM (
"capitalExpenditureCoverageRatioTTM")Dividend Paid And Capex Coverage Ratio TTM (
"dividendPaidAndCapexCoverageRatioTTM")Dividend Payout Ratio TTM (
"dividendPayoutRatioTTM")Dividend Yield TTM (
"dividendYieldTTM")Enterprise Value TTM (
"enterpriseValueTTM")Revenue Per Share TTM (
"revenuePerShareTTM")Net Income Per Share TTM (
"netIncomePerShareTTM")Interest Debt Per Share TTM (
"interestDebtPerShareTTM")Cash Per Share TTM (
"cashPerShareTTM")Book Value Per Share TTM (
"bookValuePerShareTTM")Tangible Book Value Per Share TTM (
"tangibleBookValuePerShareTTM")Shareholders Equity Per Share TTM (
"shareholdersEquityPerShareTTM")Operating Cash Flow Per Share TTM (
"operatingCashFlowPerShareTTM")Capex Per Share TTM (
"capexPerShareTTM")Free Cash Flow Per Share TTM (
"freeCashFlowPerShareTTM")Net Income Per EBT TTM (
"netIncomePerEbtTTM")EBT Per EBIT TTM (
"ebtPerEbitTTM")Price To Fair Value TTM (
"priceToFairValueTTM")Debt To Market Cap TTM (
"debtToMarketCapTTM")Effective Tax Rate TTM (
"effectiveTaxRateTTM")Enterprise Value Multiple TTM (
"enterpriseValueMultipleTTM")Dividend Per Share TTM (
"dividendPerShareTTM")EV To Sales TTM (
"evToSalesTTM")EV To Operating Cash Flow TTM (
"evToOperatingCashFlowTTM")EV To Free Cash Flow TTM (
"evToFreeCashFlowTTM")EV To EBITDA TTM (
"evToEBITDATTM")Net Debt To EBITDA TTM (
"netDebtToEBITDATTM")Income Quality TTM (
"incomeQualityTTM")Graham Number TTM (
"grahamNumberTTM")Graham Net Net TTM (
"grahamNetNetTTM")Tax Burden TTM (
"taxBurdenTTM")Interest Burden TTM (
"interestBurdenTTM")Working Capital TTM (
"workingCapitalTTM")Invested Capital TTM (
"investedCapitalTTM")Return On Assets TTM (
"returnOnAssetsTTM")Operating Return On Assets TTM (
"operatingReturnOnAssetsTTM")Return On Tangible Assets TTM (
"returnOnTangibleAssetsTTM")Return On Equity TTM (
"returnOnEquityTTM")Return On Invested Capital TTM (
"returnOnInvestedCapitalTTM")Return On Capital Employed TTM (
"returnOnCapitalEmployedTTM")Earnings Yield TTM (
"earningsYieldTTM")Free Cash Flow Yield TTM (
"freeCashFlowYieldTTM")Capex To Operating Cash Flow TTM (
"capexToOperatingCashFlowTTM")Capex To Depreciation TTM (
"capexToDepreciationTTM")Capex To Revenue TTM (
"capexToRevenueTTM")Sales General And Administrative To Revenue TTM (
"salesGeneralAndAdministrativeToRevenueTTM")Research And Development To Revenue TTM (
"researchAndDevelopementToRevenueTTM")Stock Based Compensation To Revenue TTM (
"stockBasedCompensationToRevenueTTM")Intangibles To Total Assets TTM (
"intangiblesToTotalAssetsTTM")Average Receivables TTM (
"averageReceivablesTTM")Average Payables TTM (
"averagePayablesTTM")Average Inventory TTM (
"averageInventoryTTM")Days Of Sales Outstanding TTM (
"daysOfSalesOutstandingTTM")Days Of Payables Outstanding TTM (
"daysOfPayablesOutstandingTTM")Days Of Inventory Outstanding TTM (
"daysOfInventoryOutstandingTTM")Operating Cycle TTM (
"operatingCycleTTM")Cash Conversion Cycle TTM (
"cashConversionCycleTTM")Free Cash Flow To Equity TTM (
"freeCashFlowToEquityTTM")Free Cash Flow To Firm TTM (
"freeCashFlowToFirmTTM")Tangible Asset Value TTM (
"tangibleAssetValueTTM")Net Current Asset Value TTM (
"netCurrentAssetValueTTM")
Metrics
Metrics control what data is returned from the screen. These do not need to be the same as your filters. For example, you may want to screen based on a the exchange and the TTM ROE but in your output you're interested in seeing the recent volume or market cap of the resulting list. Metrics give you the freedom to output any combination of data points.
All filters are available as metrics.
Options
Options are used to format the output data to your liking. There are currently five available options:
NH- Removes the header rows from the output. This is useful if you want to use the output as a data source for a chart or other function.ob=- Orders the output by the specified metric descending. E.g.ob=marketCapwill order the output by the market cap value. You can change this to ascending order by adding a-to the start of the metric name, e.g.ob=-marketCap.limit=- Limits the output to the specified number of rows. E.g.limit=10will limit the output to the first 10 rows.incldNotActive- Includes inactive stocks in the output. By default inactive stocks are excluded from screens.screenCurrency=- Sets the currency used for the screen. It defaults to USD and controls the monetary filter thresholds, the ordering of monetary results, the returned monetary values and the currency labels in the output headers. See Currency-aware screening below.
Options can be chained together using the & symbol. E.g. "NH&ob=beta&limit=10".
Currency-aware screening
The screenCurrency= option sets the currency used for the screen. It defaults to USD and controls the monetary filter thresholds, the ordering of monetary results, the returned monetary values and the currency labels in the output headers. Currency codes are case-insensitive, and minor currency units such as GBp/GBX are normalized correctly.
Existing SF_SCREEN() formulas remain syntactically valid, but monetary screens without an explicit screenCurrency now use USD-equivalent thresholds, ordering and output. Results from existing global screens may therefore change compared with the previous source-currency comparisons.
Currency and sourceCurrency
currency is the currency used for the screen and the returned monetary values. sourceCurrency is the security's original profile currency. The existing currency=EUR filter keeps its original meaning: it only includes securities whose source currency is EUR, and it does not set the screen currency.
Currency-aware fields
Monetary values are converted to the screen currency for these profile fields: marketCap, price, lastDividend, and range (output conversion only). The following TTM monetary fields are converted too:
enterpriseValueTTMrevenuePerShareTTMnetIncomePerShareTTMinterestDebtPerShareTTMcashPerShareTTMbookValuePerShareTTMtangibleBookValuePerShareTTMshareholdersEquityPerShareTTMoperatingCashFlowPerShareTTMcapexPerShareTTMfreeCashFlowPerShareTTMdividendPerShareTTMgrahamNumberTTMgrahamNetNetTTMworkingCapitalTTMinvestedCapitalTTMaverageReceivablesTTMaveragePayablesTTMaverageInventoryTTMfreeCashFlowToEquityTTMfreeCashFlowToFirmTTMtangibleAssetValueTTMnetCurrentAssetValueTTM
Ratios, percentages, turnovers, volumes, counts, dates and beta are not converted. The profile range value is converted for display only.
Unsupported currencies and conversion limits
Unsupported screen currencies return a user-facing error. Securities without an available conversion rate are excluded when currency conversion is required, and the result title indicates that rows were not evaluated. Conversion rates are cached daily and are intended for comparable screening, not real-time foreign-exchange execution.
Currency examples
The market-cap threshold, ordering and returned market-cap values below are all in AUD:
=SF_SCREEN(
"marketCap>1000000000",
"symbol&marketCap¤cy&sourceCurrency",
"screenCurrency=AUD&ob=marketCap"
)The screen below only considers EUR-denominated securities, but compares and displays their market capitalisation in USD:
=SF_SCREEN(
"currency=EUR&marketCap>1000000000",
"symbol&marketCap¤cy&sourceCurrency",
"screenCurrency=USD"
)Examples
Example 1
All stocks with a market cap over $1 billion that are not ETFs and are actively trading, ordered by beta descending and limited to the first 10 rows. Displaying all metrics.
=SF_SCREEN("marketCap>1000000000&exchange=NYSE,NASDAQ&isEtf=false", "all", "ob=beta&limit=10")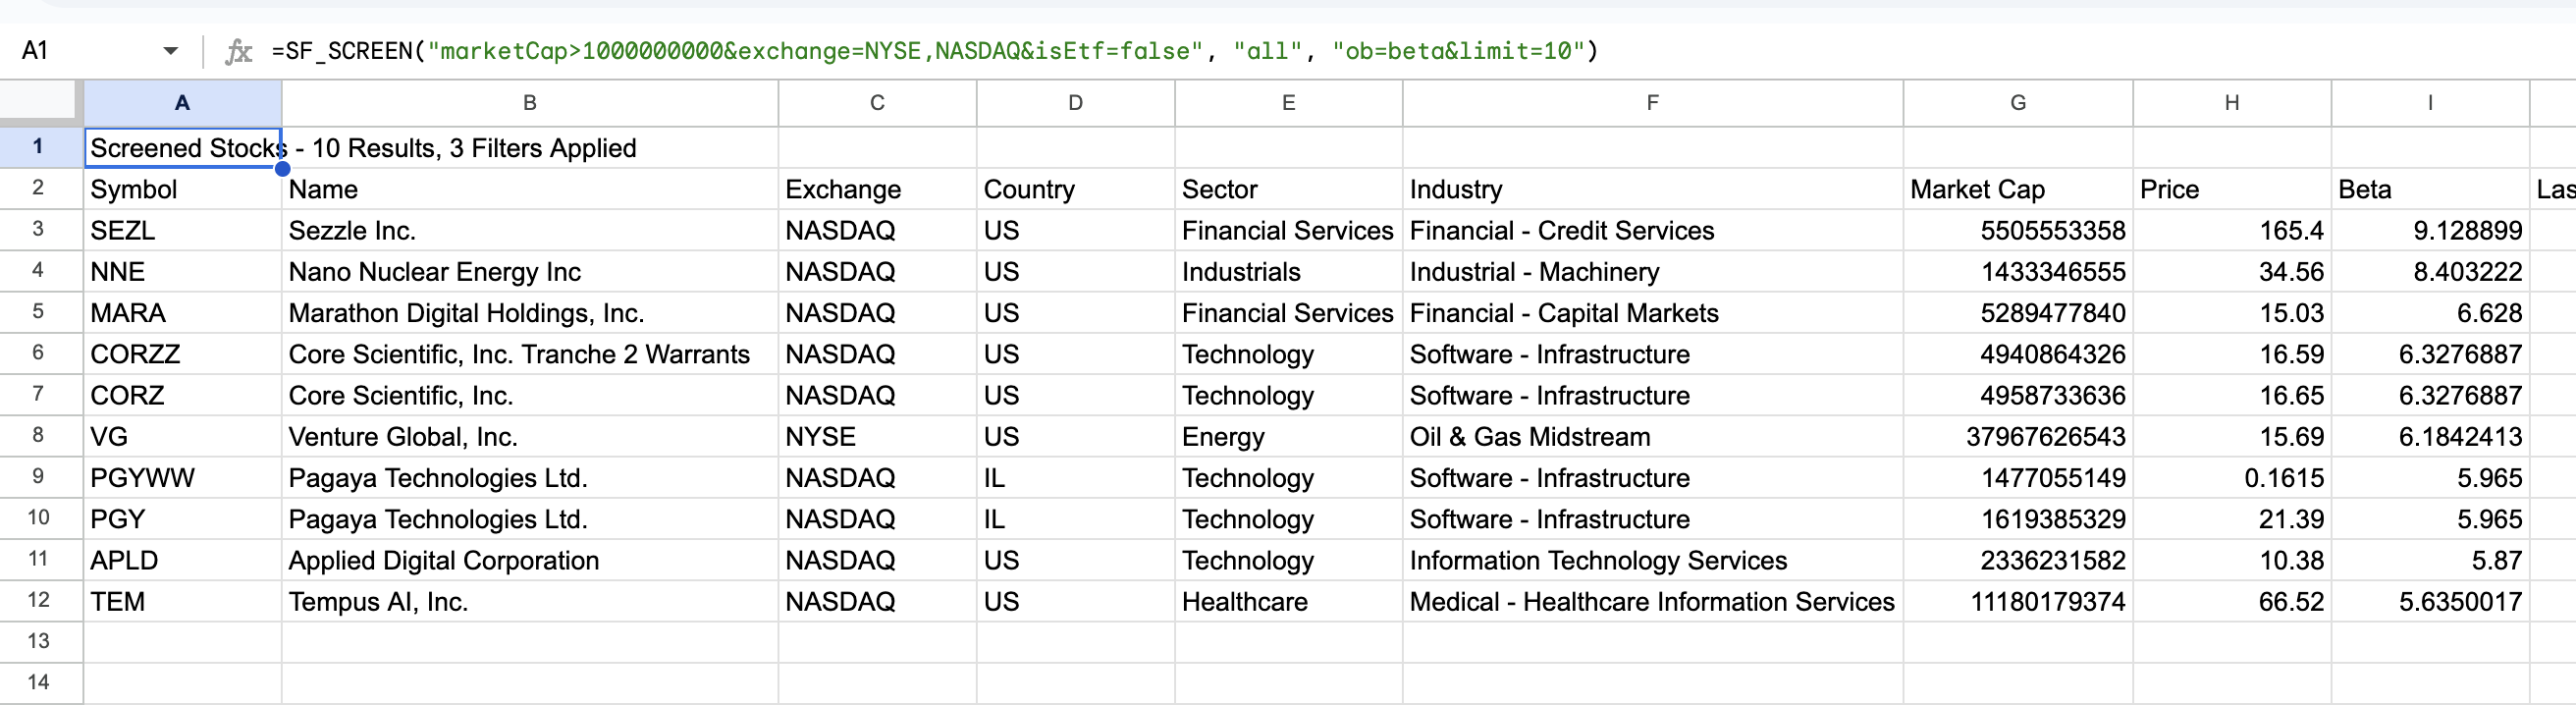
Example 2
All stocks in the Technology sector under $500 million market cap that are actively trading, ordered by last annual dividend descending and limited to the first 100 rows. Displaying only selected metrics. Displaying currency to best interpret the dividend output.
=SF_SCREEN("sector=Technology&marketCap<500000000", "symbol§or&industry&exchange&marketCap&price&lastDividend¤cy", "ob=lastDividend&limit=100")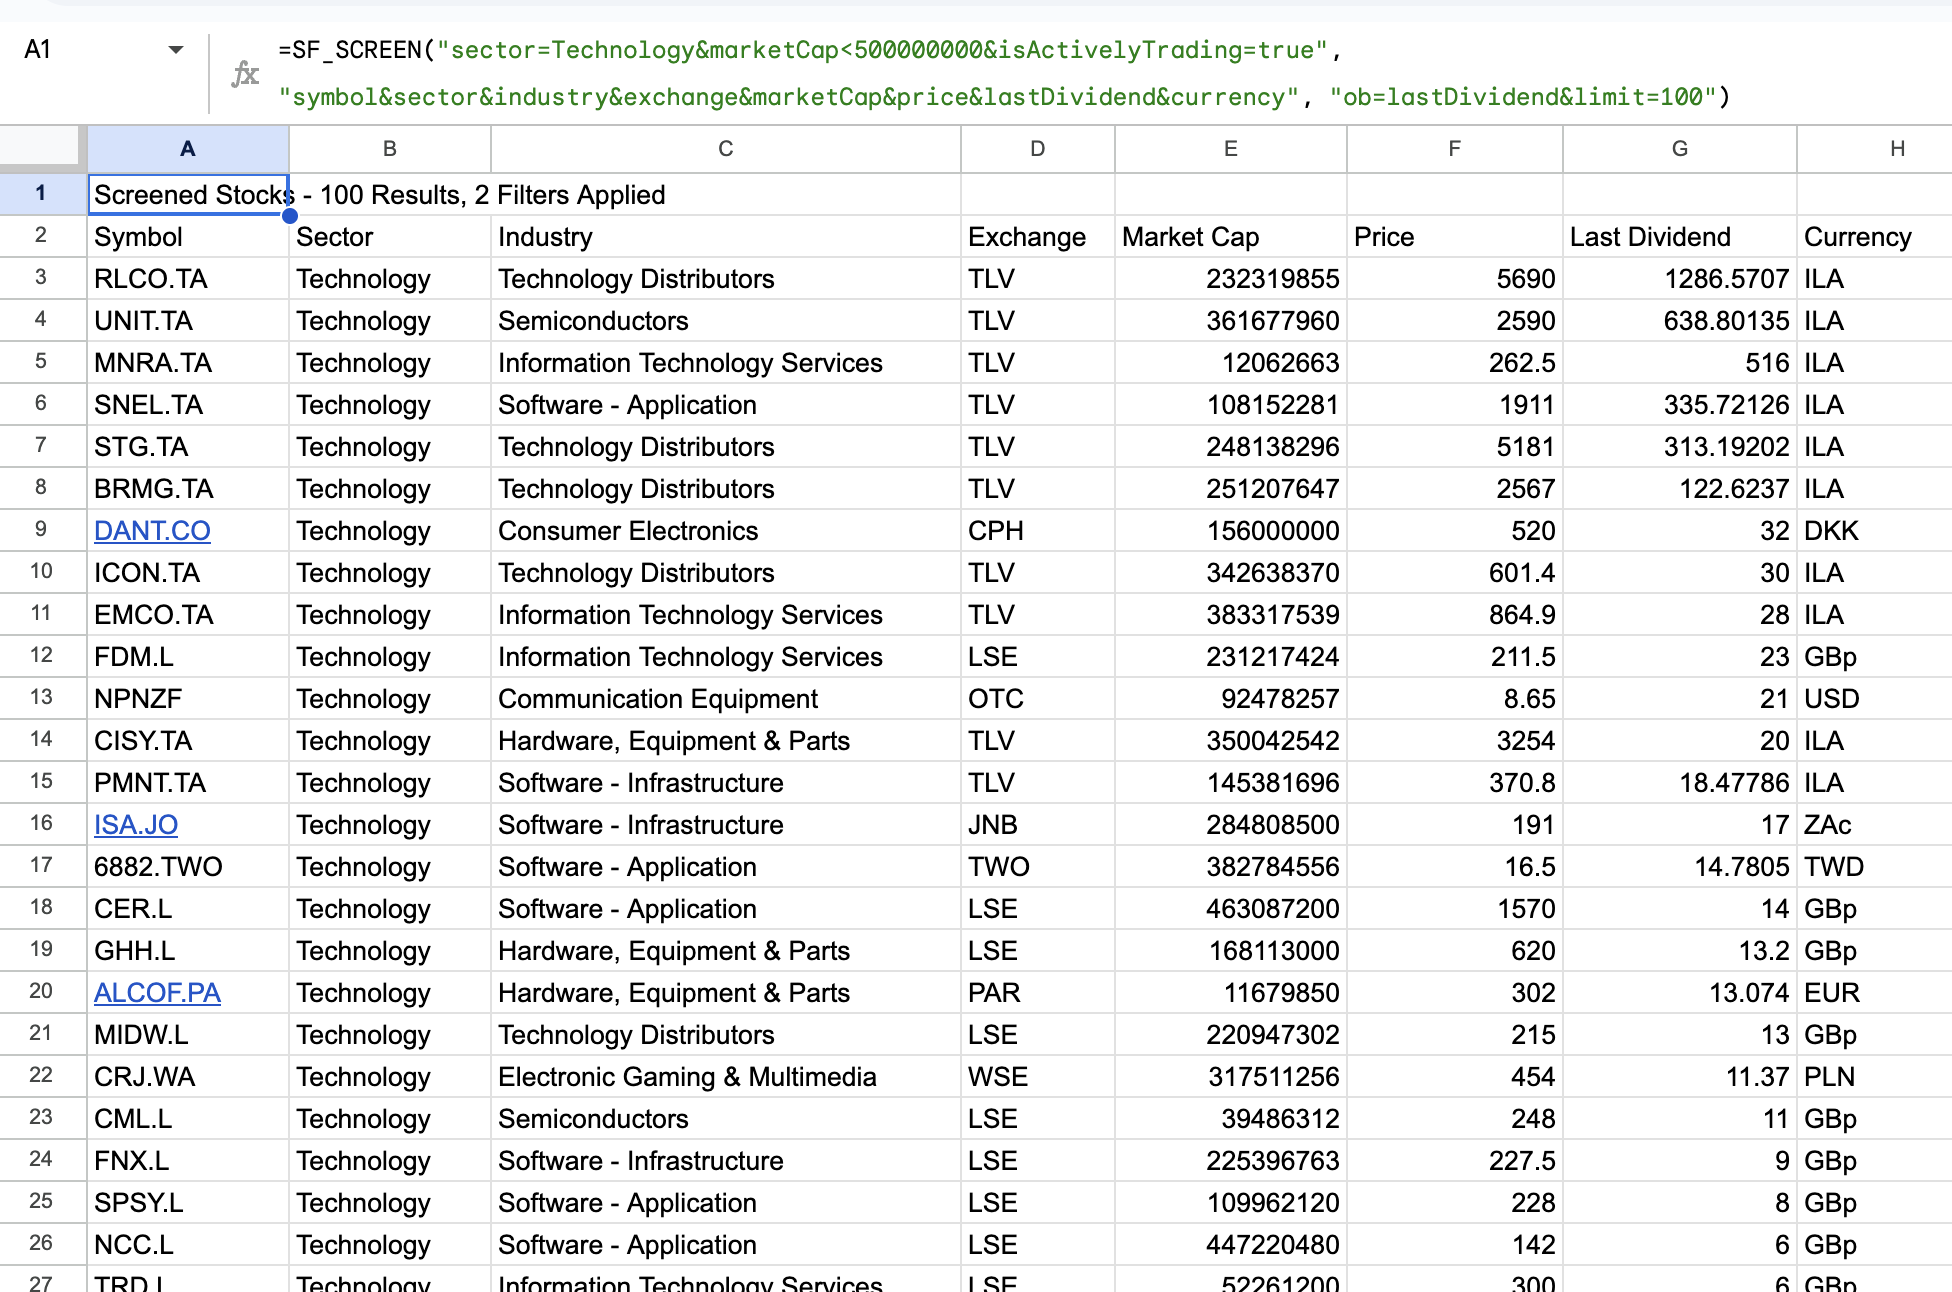
Example 3
All stocks with return on equity greater than 20% on the NASDAQ and NYSE with market caps under $1 billion, but greater than 500 million, ordered by return on equity descending and limited to the first 100 rows.
=SF_SCREEN("returnOnEquityTTM>0.2&marketCap<1000000000&marketCap>500000000&exchange=NASDAQ,NYSE", "symbol&exchange&marketCap&returnOnEquityTTM", "ob=returnOnEquityTTM&limit=100")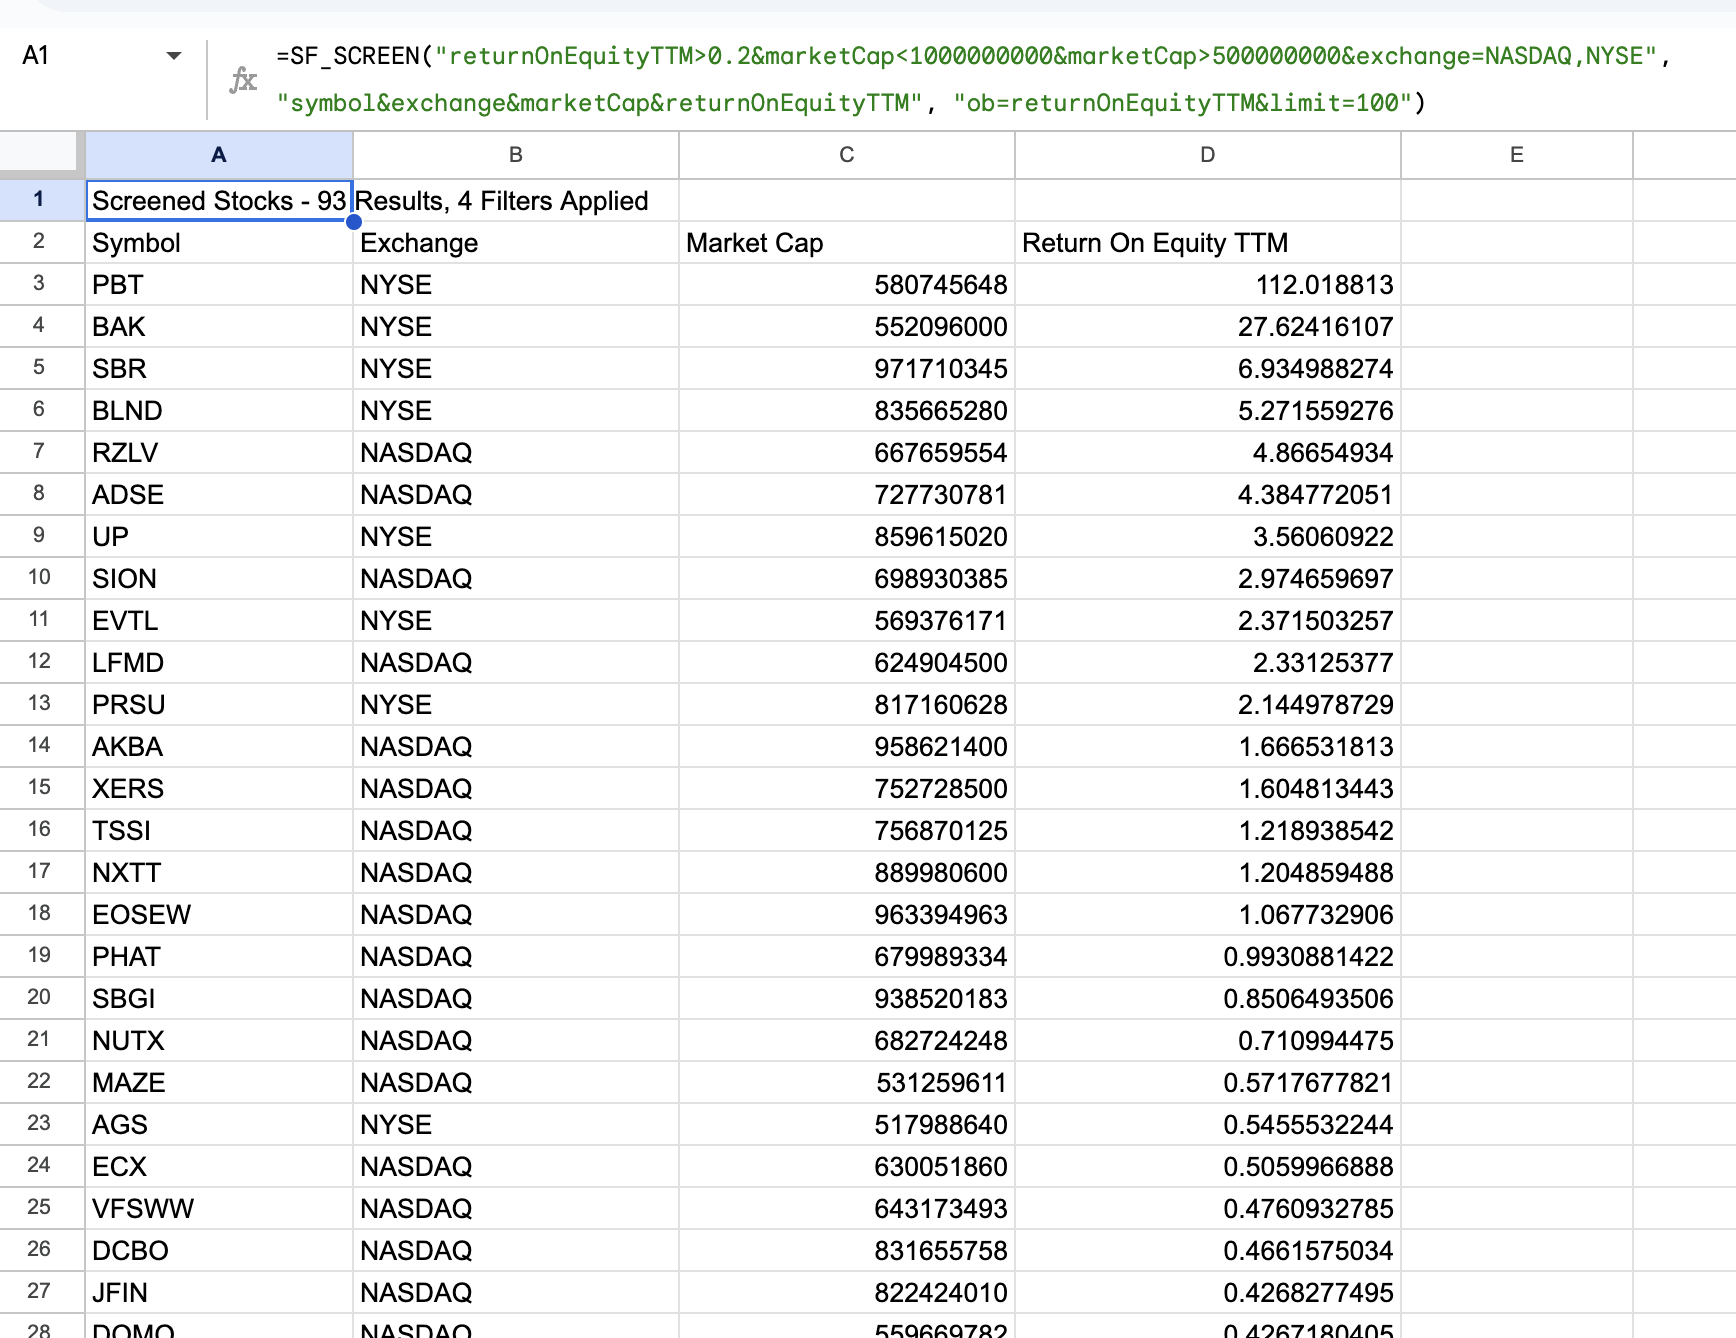
For a step-by-step guide on screening a specific sector by financial metrics like operating margin or ROE, see Screen stocks by sector and financial metrics.