Surface
🚨 Important:SF_OPTIONS_PRO() requires an active Options subscription. If you don't have an active subscription, upgrade on our Pricing page.
The "surface"dataType returns the implied volatility surface for an underlying. This gives you expiration-level surface data such as ATM IV, earnings effect, confidence, and the full delta-based volatility grid from vol0 through vol100.
For a complete function overview, parameter guide, and dataset map, see Options.
=SF_OPTIONS_PRO(symbol, "surface", expirationDate, "", tradeDate, "", metrics, options)symbolis the underlying ticker symbol, for example"AAPL".dataTypemust be"surface".expirationDatecan be used to target a specific expiry inYYYY-MM-DDformat or as an Excel date serial.tradeDateis optional and requests a historical surface snapshot when supplied. UseYYYY-MM-DDformat, an Excel date serial or Google Sheets date formatted cell.metricsselects which surface fields to return. Leave blank or use"all"to output the complete surface dataset. You can entergridOnlyto return only the volatility grid. Chain specific fields together with&such as"expirDate&stockPrice&atmiv&calVol&earnEffect&confidence". See the full list of available metrics in the Metrics section below.optionsallows additional output formatting or sorting options. Options can be chained together with&.
Parameters
Symbol (symbol)
Use the underlying ticker symbol you want to analyze, for example "AAPL". This function does not accept OCC contract symbols because surface data is only available at the underlying level.
Data Type (dataType)
Use "surface" to return the volatility surface for the selected underlying.
Expiration Date (expirationDate)
Use expirationDate when you want the surface view aligned to a particular expiry. Enter it in YYYY-MM-DD format or as an Excel date serial.
Trade Date (tradeDate)
tradeDate is the historical moment-in-time date for the surface snapshot when you want historical surface data. Use YYYY-MM-DD format, an Excel date serial or Google Sheets date formatted cell.
Metrics (metrics)
To output only the volatility grid (Expiration Date and Vol 0 - Vol 100) enter gridOnly. This is useful for charting purposes.
The available surface metrics are:
All (
"all")Ticker (
"ticker")Expiration Date (
"expirDate")Stock Price (
"stockPrice")Spot Price (
"spotPrice")ATM IV (
"atmiv")Smoothed ATM Vol (
"calVol")Smoothed ATM Vol (Excld. Earnings Effect) (
"unadjVol")Earnings Effect (
"earnEffect")ATM Fit Vol (
"fit")Risk Free Rate (
"riskFreeRate")Yield Rate (
"yieldRate")Residual Yield Rate (
"residualYieldRate")Residual Rate Slope (
"residualRateSlp")Residual Rate R² (
"residualR2")Confidence (
"confidence")Market Width Vol (
"mwVol")Vol 0 (
"vol0")Vol 5 (
"vol5")Vol 10 (
"vol10")Vol 15 (
"vol15")Vol 20 (
"vol20")Vol 25 (
"vol25")Vol 30 (
"vol30")Vol 35 (
"vol35")Vol 40 (
"vol40")Vol 45 (
"vol45")Vol 50 (
"vol50")Vol 55 (
"vol55")Vol 60 (
"vol60")Vol 65 (
"vol65")Vol 70 (
"vol70")Vol 75 (
"vol75")Vol 80 (
"vol80")Vol 85 (
"vol85")Vol 90 (
"vol90")Vol 95 (
"vol95")Vol 100 (
"vol100")Trade Date (
"tradeDate")Quote Date (
"quoteDate")Expiry Time of Day (
"expiryTod")Updated At (
"updatedAt")
Options (options)
Use options for output formatting modifiers. Chain multiple options together with &.
Formatting options:
"NH"removes the header row."-"reverses the output order.
Examples
Example 1 - Pull the current surface for all expirations
=SF_OPTIONS_PRO("AAPL", "surface", "", "", "", "", "gridOnly")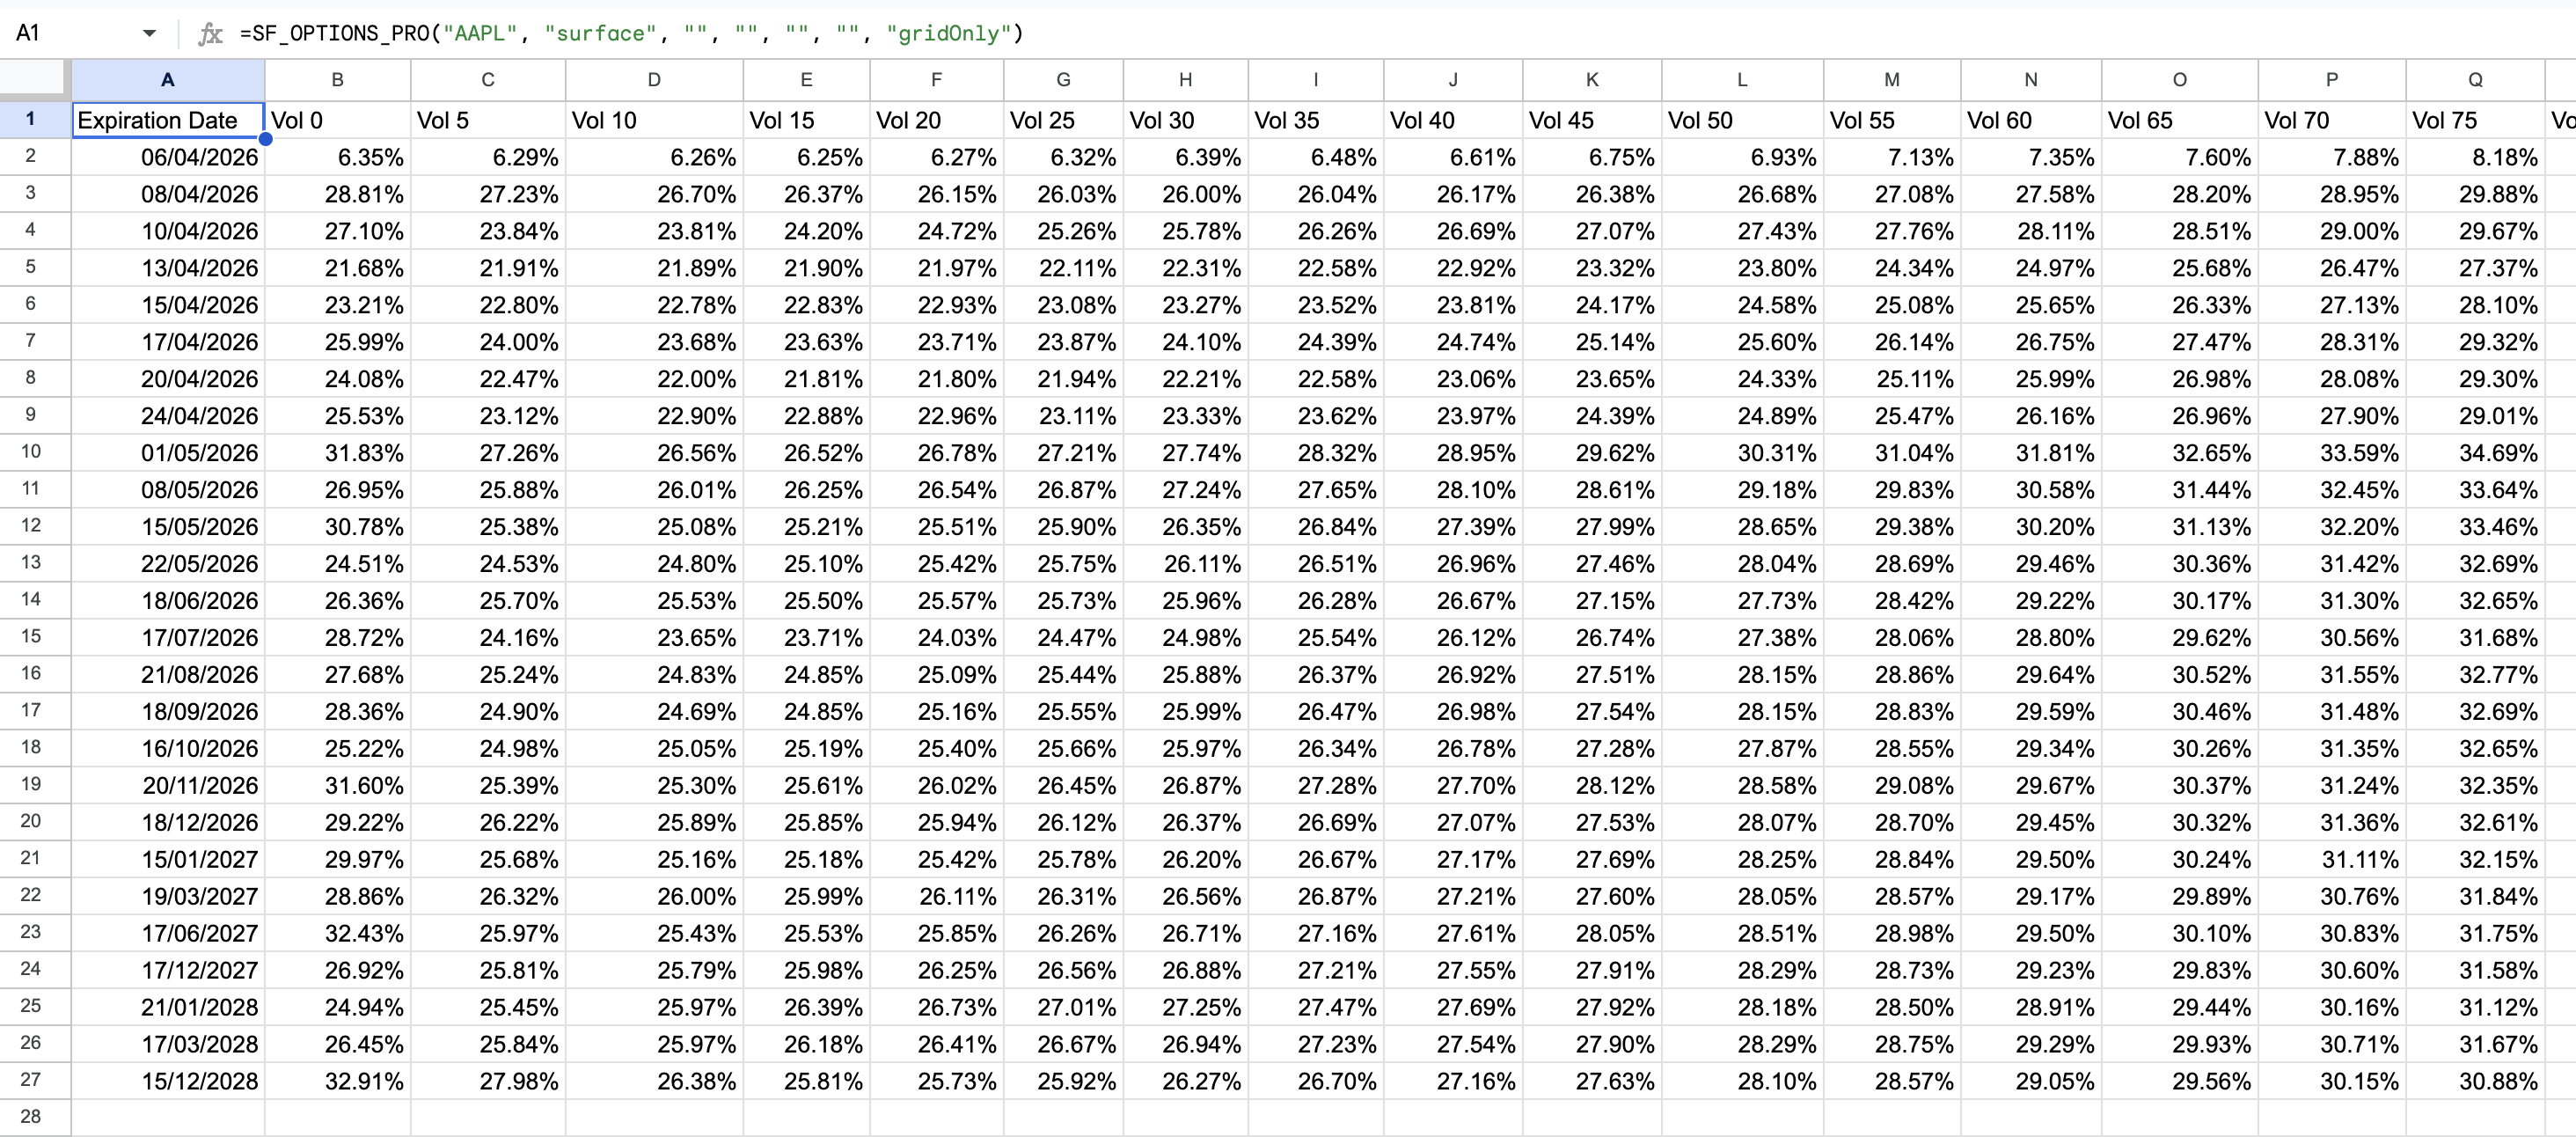
Example 2 - Pull the current surface for a specific expiration with all metrics
=SF_OPTIONS_PRO("AAPL", "surface", "2026-10-16")
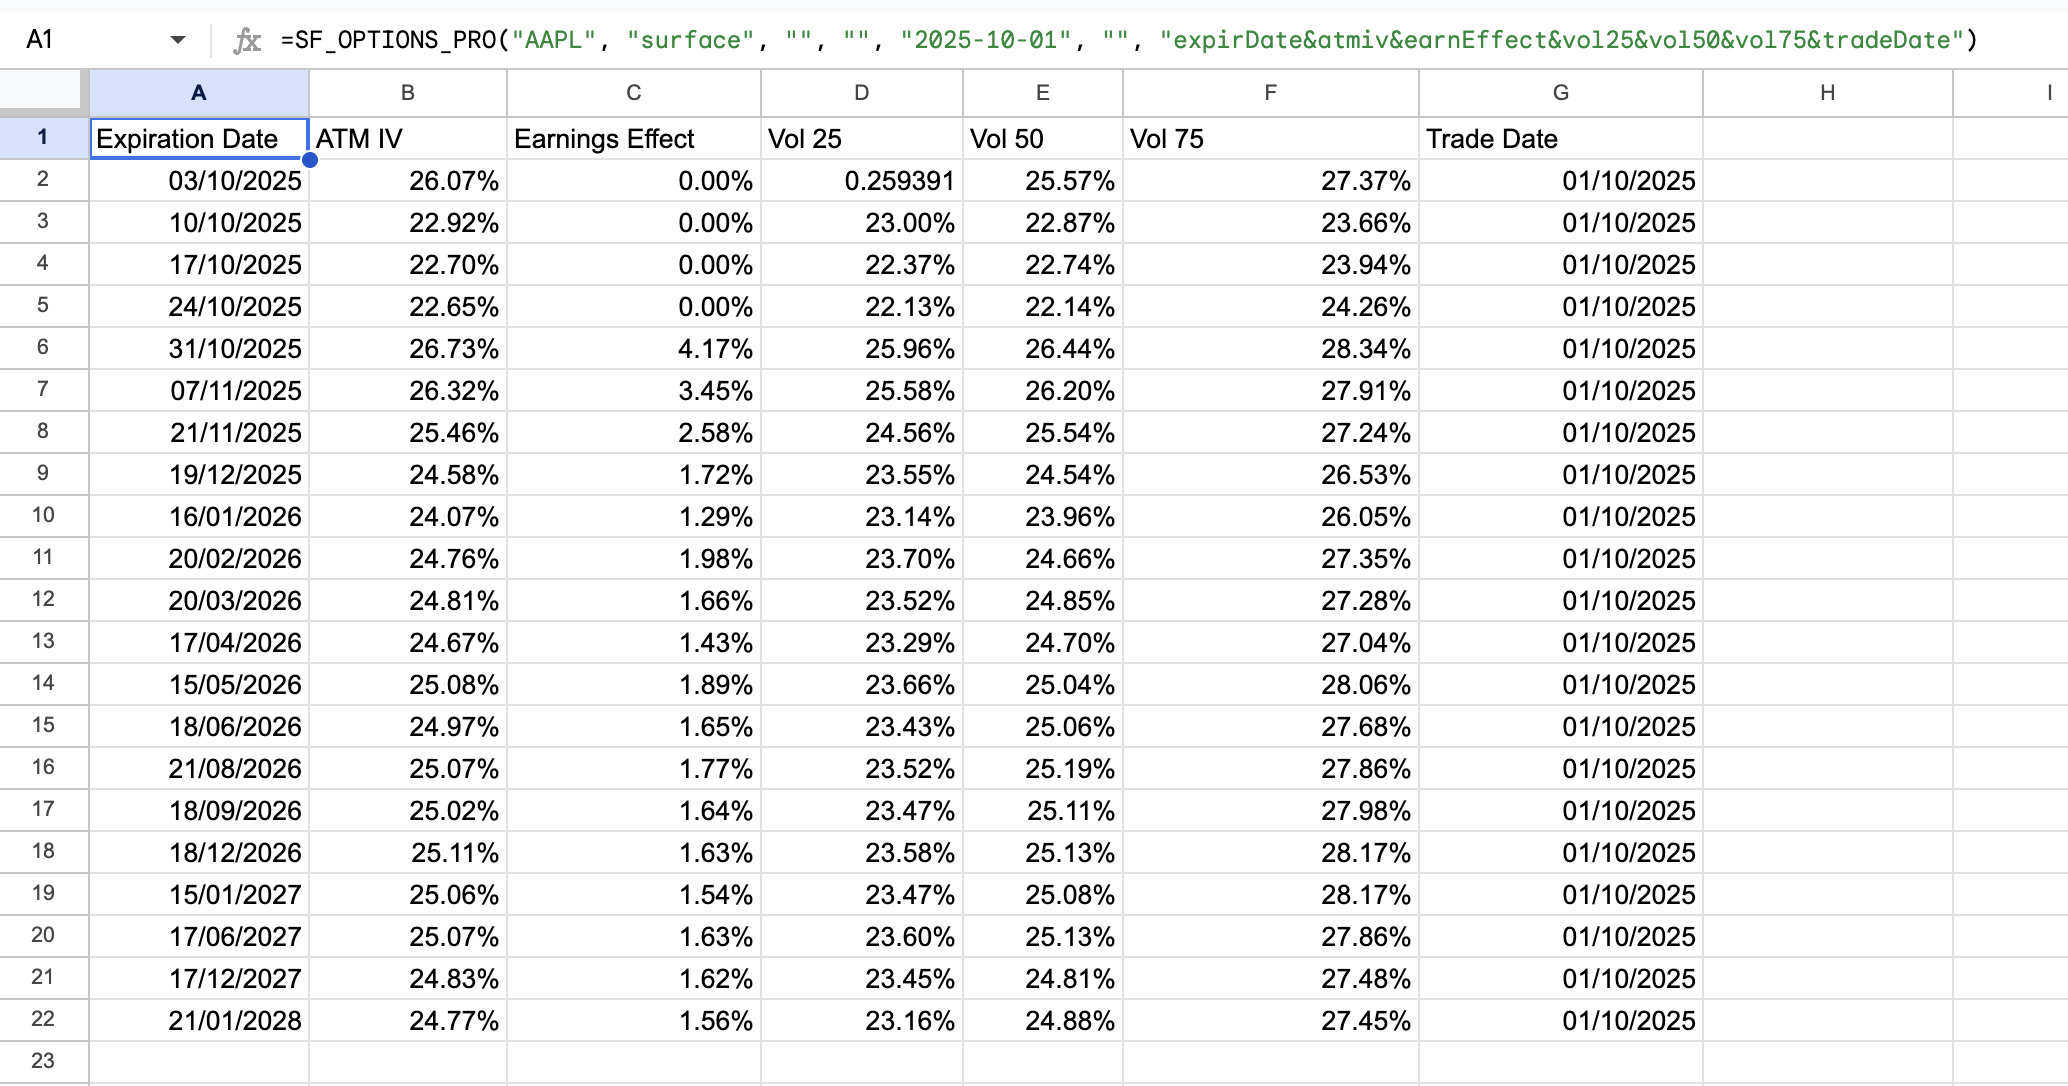
Example 3 - Pull a historical surface snapshot for all expirations as of a specific date with select metrics
=SF_OPTIONS_PRO("AAPL", "surface", "", "", "2025-10-01", "", "expirDate&atmiv&earnEffect&vol25&vol50&vol75&tradeDate")