How to Get Analyst Estimates and Price Targets in Google Sheets and Excel
You can pull analyst estimates and price targets into Google Sheets or Microsoft Excel with the SF() function. One formula returns the consensus revenue and EPS forecast for the next few fiscal years, another lists every price target published for a US stock in recent months, and two more return the buy/hold/sell count and the individual rating changes behind it.
Put those together and you have a consensus dashboard that updates itself: the average price target, the implied upside from today's price, the forward P/E, and how analysts are split, all in a few cells instead of a tab full of copied numbers.
Start a 15-day free trial of SheetsFinance Market Data (no payment details required) to reproduce every example in this guide. Analyst estimates and price targets are available from the Investor plan upward. The trial includes Analyst-level feature access with a limit of 1,000 data calls per day.
What Analyst Data You Can Pull
SheetsFinance has four analyst data types. All of them use the same SF() function and the same syntax in Google Sheets and Excel:
| Data type | What it returns | Use it for |
|---|---|---|
estimates / estimatesQ |
Annual or quarterly consensus revenue, EBITDA, EBIT, net income, SG&A and EPS, each as a low, average and high, plus analyst counts | Forward P/E, growth expectations, DCF revenue inputs |
priceTargets |
Each published price target with the date, firm, analyst and the share price when it was posted | Average, high and low targets and implied upside |
ratings |
Month-end totals of strong buy, buy, hold, sell and strong sell ratings | How sentiment has shifted over time |
analysts |
Individual grade changes: date, firm, previous grade, new grade and the action taken | Spotting upgrades and downgrades |
All four take one symbol per formula. Price target data is only available for US markets.
1. Get Consensus EPS and Revenue Estimates
The estimates formula follows the standard SF() pattern:
=SF(symbol, "estimates", metrics, year, options)symbolis a ticker as text or a cell reference, such as"NVDA"orA2.- Use
"estimates"for annual figures or"estimatesQ"for quarterly ones. metricscan be blank or"all", or a list joined with&, such as"revenueAvg&epsAvg". Every forecast line comes as aLow,AvgandHigh, for exampleepsLow,epsAvgandepsHigh.numAnalystsEpsandnumAnalystsRevenuecount the analysts behind each figure.yearpicks the period. Leave it blank for the next fiscal year. Relative periods are easier to maintain than fixed years:"LY"is the latest fiscal year that has ended, so"LY+1"is the next estimate and"LY+1:LY+3"returns the next three.optionsaccepts"NH"(no header row),"NLI"(no line item labels),"-"(reverse the order),"pad"and"calYear", joined with&.
Enter this in A3 to see the next three years of NVIDIA revenue and EPS forecasts:
=SF("NVDA","estimates","revenueAvg&epsLow&epsAvg&epsHigh&numAnalystsEps","LY+1:LY+3")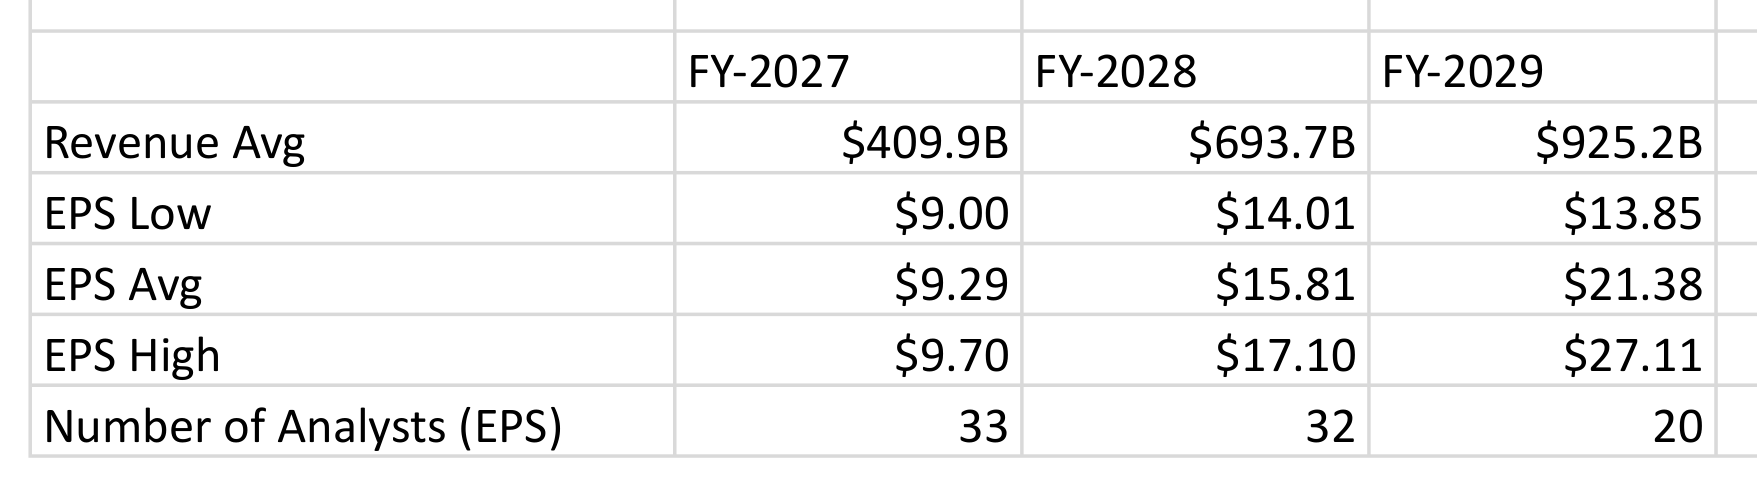
The fiscal years run across the top and the metrics down the side. When this guide was written, 33 analysts expected NVIDIA to earn between $9.00 and $9.70 a share in fiscal 2027, with an average of $9.29. By fiscal 2029 only 20 analysts were contributing and the range had widened to $13.85 to $27.11. Fewer analysts and a wider range are a reminder that later years are much less certain.
Ask for one metric and one period and the formula returns a single number, which is what you want inside another calculation:
=SF("NVDA","estimates","epsAvg")For the next four quarters instead, switch to estimatesQ and use LQ:
=SF("NVDA","estimatesQ","revenueAvg&epsAvg","LQ+1:LQ+4")Revenue estimates are large numbers. Format them in billions with a custom number format such as $#,##0.0,,,"B", as in the screenshot. See Years, ranges, and relative periods for every period format.
2. Pull Analyst Price Targets
Price targets list each target published in a window, newest first:
=SF(symbol, "priceTargets", metrics, months, options)The fourth argument is a number of months. Leave it blank for the last 12 months, or enter 3 for the last three. The metrics are publishedDate, analystCompany, analystName, priceTarget and priceWhenPosted.
=SF("NVDA","priceTargets","publishedDate&analystCompany&priceTarget&priceWhenPosted",3)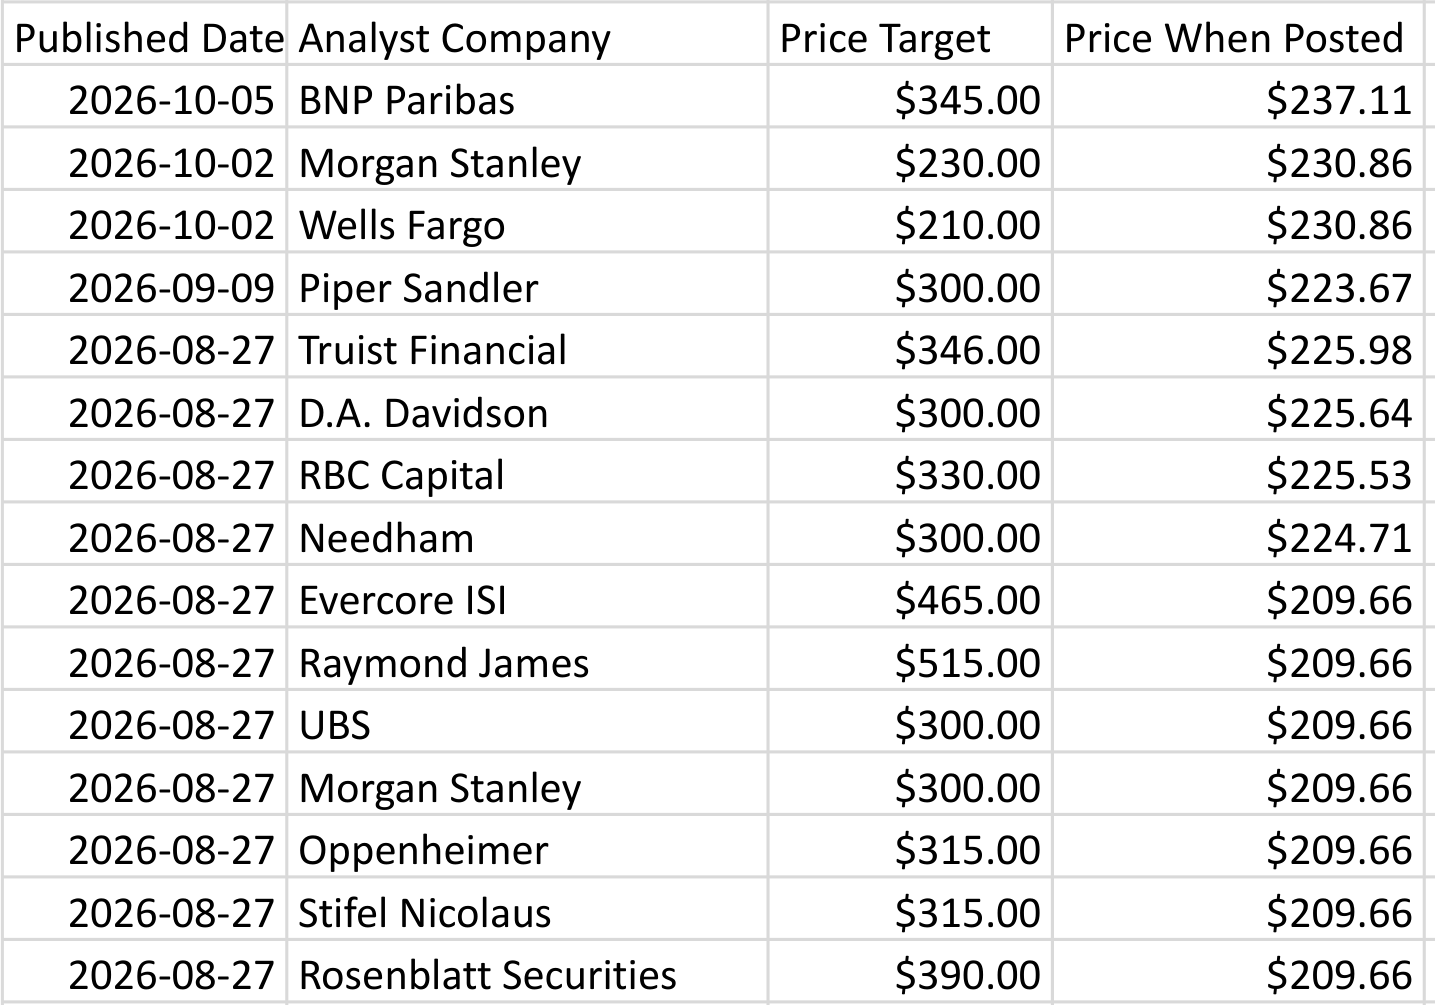
The output has a header row and one row per target. priceWhenPosted is worth keeping: it shows how far above the share price each analyst set their target on the day, and lets you spot targets set when the stock was trading somewhere very different from today.
A firm can appear more than once. In this window Morgan Stanley published a $300 target in August and a $230 target in October, and both rows are returned. Sort by firm or filter on the latest date per firm if you only want each firm's current view.
3. Build a Consensus Dashboard with Implied Upside
The most useful view combines the two data types with the live price. Lay out the sheet like this:
- Type the ticker in
B1. - Type
Targets (3 months)inD1, then enter this inD2.NHremoves the header so the column holds only numbers:
=SF(B1,"priceTargets","priceTarget",3,"NH")- Add the labels in column A and these formulas in column B:
| Cell | Label | Formula |
|---|---|---|
B3 | Current price | =SF(B1) |
B4 | Average price target | =AVERAGE(D2:D200) |
B5 | Highest target | =MAX(D2:D200) |
B6 | Lowest target | =MIN(D2:D200) |
B7 | Targets published | =COUNT(D2:D200) |
B8 | Implied upside | =B4/B3-1 |
B10 | Next fiscal year EPS (avg.) | =SF(B1,"estimates","epsAvg") |
B11 | Analysts covering EPS | =SF(B1,"estimates","numAnalystsEps") |
B12 | Forward P/E | =B3/B10 |
B14 | Strong buy + buy | =SF(B1,"ratings","strongBuy","latest")+SF(B1,"ratings","buy","latest") |
B15 | Hold | =SF(B1,"ratings","hold","latest") |
B16 | Sell + strong sell | =SF(B1,"ratings","sell","latest")+SF(B1,"ratings","strongSell","latest") |
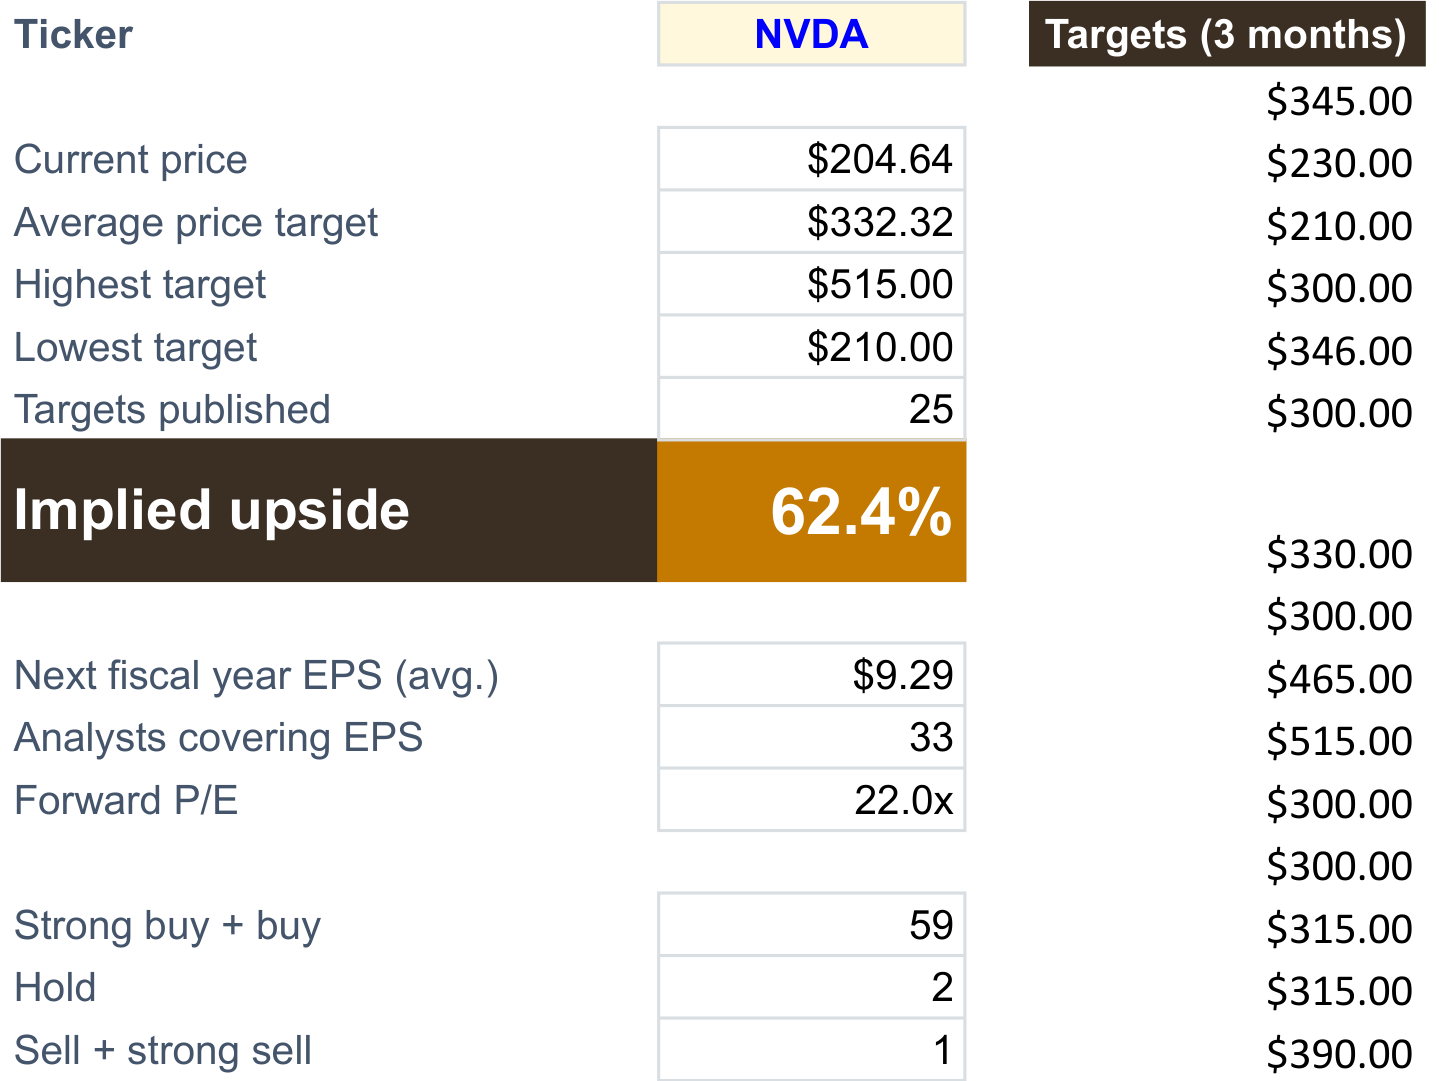
Format B8 as a percentage and B12 with a custom format such as 0.0"x". With NVIDIA trading at $204.64 when the sheet was calculated, the 25 targets published over the previous three months averaged $332.32, an implied upside of 62.4%. The targets ranged from $210 to $515, and the stock traded on 22.0 times the $9.29 consensus EPS for fiscal 2027.
The targets spill into column D once and the average, high, low and count all read that range, so the dashboard makes one price target call instead of four. Change the ticker in B1 to rebuild the whole view for any US stock. The ratings rows use "latest", which returns the most recent month's total as a single number.
For more on the forward P/E calculation, see the Calculate forward P/E from estimates guide.
4. Track Buy, Hold and Sell Ratings
The ratings data type returns month-end totals for every rating category. Leave the metrics blank to get them all, and use the fourth argument to pick a year or month:
=SF("NVDA","ratings","","2026")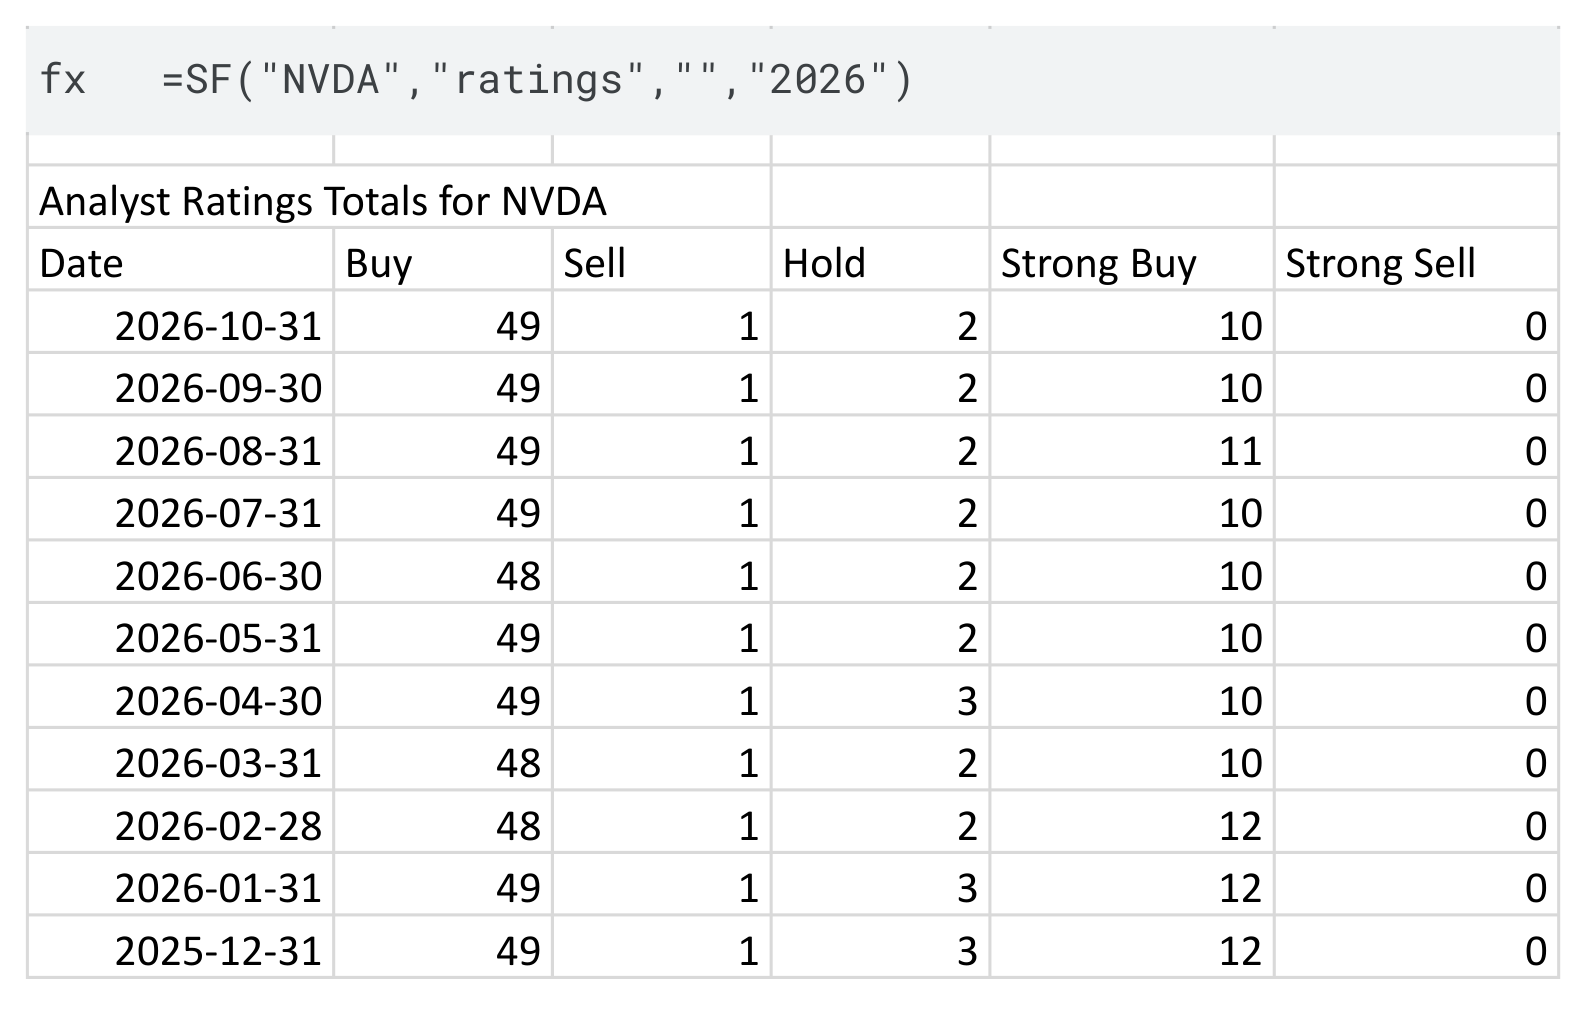
The output starts with a title row and a header row, then one row per month-end, newest first. The columns come back in the order Date, Buy, Sell, Hold, Strong Buy and Strong Sell, so check the headers before you point a formula at a column. In this example the 2026 request also returned the 31 December 2025 snapshot.
NVIDIA's split barely moved through 2026: 58 to 61 buy-side ratings every month against two or three holds and a single sell. Strong buys slipped from 12 to 10 over the year. To chart the trend, select the date column and the rating columns and insert a stacked column chart.
5. See Individual Upgrades and Downgrades
The analysts data type shows the rating changes behind those totals. With no other arguments it returns the latest year:
=SF("NVDA","analysts")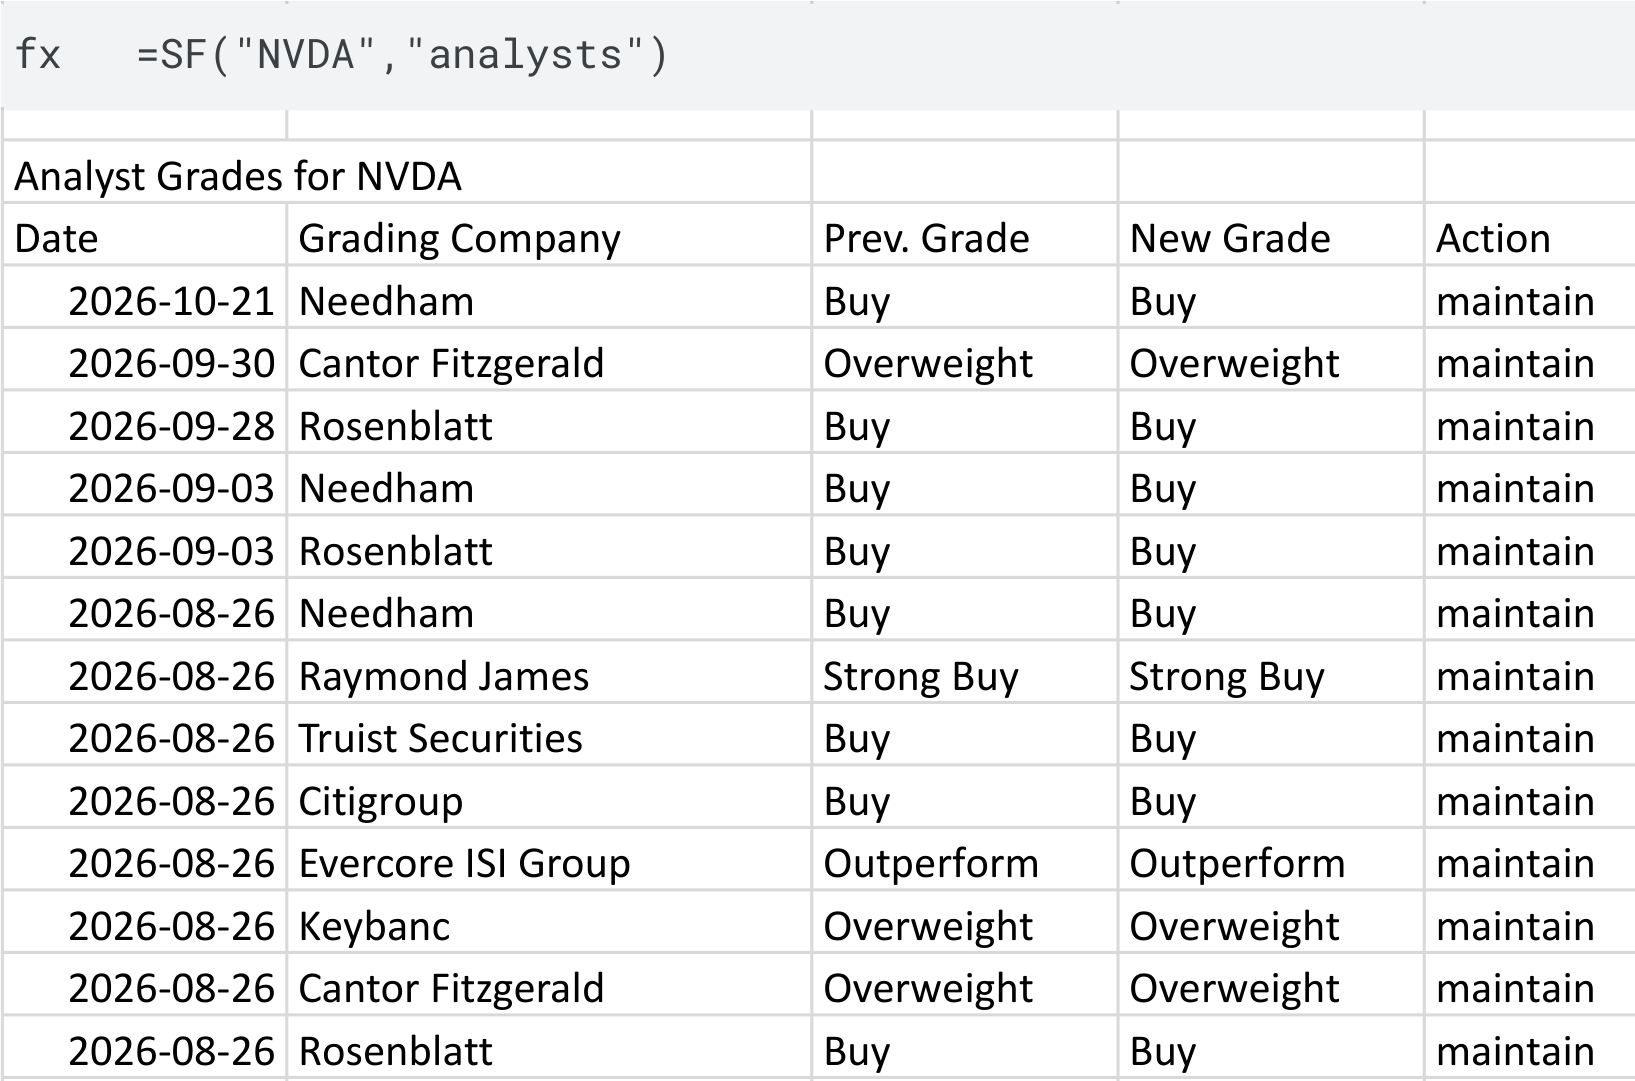
Each row is one rating action with the firm, the previous grade, the new grade and an action such as maintain. Firms re-rate often, so the same firm can appear several times, as Needham and Rosenblatt do here. Filter the action column to find genuine upgrades and downgrades rather than reiterations.
Pass a year such as "2025", or a month such as "2025-11", as the fourth argument to look further back. The data goes back to January 2012.
How to Read Analyst Data
| Measure | Calculation | What to watch |
|---|---|---|
| Implied upside | Average target ÷ current price − 1 | Moves every time the price moves, even if no target changes |
| Target spread | Highest target − lowest target | A wide spread means analysts disagree, so the average says less |
| Forward P/E | Current price ÷ next fiscal year epsAvg |
Compare with the trailing P/E and with peers, not in isolation |
| Estimate range | epsHigh − epsLow |
Widens with distance into the future and as analyst coverage thins |
Analyst targets and estimates are opinions with a 12-month horizon at best, and they tend to follow the share price. Use them to understand what the market already expects, alongside fundamentals and price history, rather than as a forecast of where the stock will go.
Common Mistakes to Avoid
- Expecting price targets for non-US stocks:
priceTargetscovers US markets only. - Averaging every target in the last year: Old targets set at a very different share price drag the average. A three-month window is more current.
- Counting a firm twice: A firm that revised its target appears once per revision. Deduplicate by firm if you want one view per firm.
- Using a fixed year for estimates:
"2027"will eventually become a past year."LY+1"always points to the next estimate. - Assuming the ratings column order: The
ratingsoutput is Buy, Sell, Hold, Strong Buy, Strong Sell, not strongest to weakest. - Passing a range of tickers: All four analyst data types take one symbol per formula. Fill the formula down for a watchlist.
Frequently Asked Questions
How do I get analyst price targets in Google Sheets?
Use =SF("NVDA","priceTargets","publishedDate&analystCompany&priceTarget",3) for the last three months of targets, or wrap a single-metric, no-header version in AVERAGE() for the consensus target.
Can I get analyst estimates in Excel?
Yes. SF() uses the same syntax in Excel and Google Sheets, so every formula in this guide works in both.
How do I get the consensus EPS estimate for next year?
=SF("NVDA","estimates","epsAvg") returns the average EPS estimate for the next fiscal year. Add "LY+2" as the fourth argument for the year after.
How do I calculate implied upside from analyst price targets?
Divide the average price target by the current price and subtract one: =AVERAGE(D2:D200)/SF(B1)-1, using the targets spilled into column D.
Can I see historical analyst ratings?
Yes. ratings returns monthly buy, hold and sell totals for any year you request, and analysts returns individual rating changes back to January 2012.
Build Your Own Analyst Consensus Sheet
Start with the single-stock dashboard, then copy the tab for each company you follow, or fill the estimates and ratings formulas down a watchlist. Every formula reads the ticker from a cell, so one sheet covers any supported US stock.
Review the Analyst Estimates, Price Targets, Analyst Ratings Totals and Analyst Ratings function references, or start a 15-day Market Data trial to build the dashboard in Google Sheets or Excel. To turn the revenue estimates into a valuation, continue with How to Build a DCF Model in Excel and Google Sheets.