Analyst Estimates
Calendar years: The estimates datafeed is date-based, so the year or date string you enter searches by calendar years, not company fiscal years.
The estimates data type returns historical and 2-5 years of forecast annual and quarterly estimates from a sample of professional analysts. The estimates include revenue, EBIT, EBITDA, net income, S&GA expenses and EPS.
=SF(symbol, type, metric, year, options)symbolis the ticker symbol of the financial asset (e.g.,"AAPL"). You can use our Symbol Search to find the correct ticker symbol.typespecify which type of estimates data you are after, leave it as just"estimates"for annual estimates data, or"estimatesQ"for quarterly estimates data.metricselects what metrics to display (see options below), display all metrics by leaving blank or using"all". Chain together as many metrics as you'd like using&, e.g.,"revenueAvg&epsAvg".yearis the year or range of years for which you want to retrieve the data. For annual estimates, you can enter a single year (e.g.,2025) or a range of years (e.g.,2023-2025). For quarterly estimates, you can enter a single year, range of years or a specific quarter in a year (e.g.,2024-03for Q3 2024). If omitted, the function defaults to next year's estimates.optionsadjusts the formatting of the output. There are currently three available options. Set this field to"NH"for no header rows,"NLI"for no line item labels and"-"to reverse the year ordering. These options can be chained together with the&operator, for example"NH&NLI&-".
Data Source: Analyst estimates are compiled and collated by FMP.
The estimates metric options are:
All (
"all")Date (
"date")Revenue Low (
"revenueLow")Revenue High (
"revenueHigh")Revenue Average (
"revenueAvg")EBITDA Low (
"ebitdaLow")EBITDA High (
"ebitdaHigh")EBITDA Average (
"ebitdaAvg")EBIT Low (
"ebitLow")EBIT High (
"ebitHigh")EBIT Average (
"ebitAvg")Net Income Low (
"netIncomeLow")Net Income High (
"netIncomeHigh")Net Income Average (
"netIncomeAvg")S&GA Expense Low (
"sgaExpenseLow")S&GA Expense High (
"sgaExpenseHigh")S&GA Expense Average (
"sgaExpenseAvg")EPS Low (
"epsLow")EPS High (
"epsHigh")EPS Average (
"epsAvg")Number of analysts covering Revenue (
"numAnalystsRevenue")Number of analysts covering EPS (
"numAnalystsEps")
Tip: Omitting the year returns next year's estimate by default.
Examples
Example 1 - All annual estimates for 2025, no options
=SF("AAPL", "estimates", "all", "2025")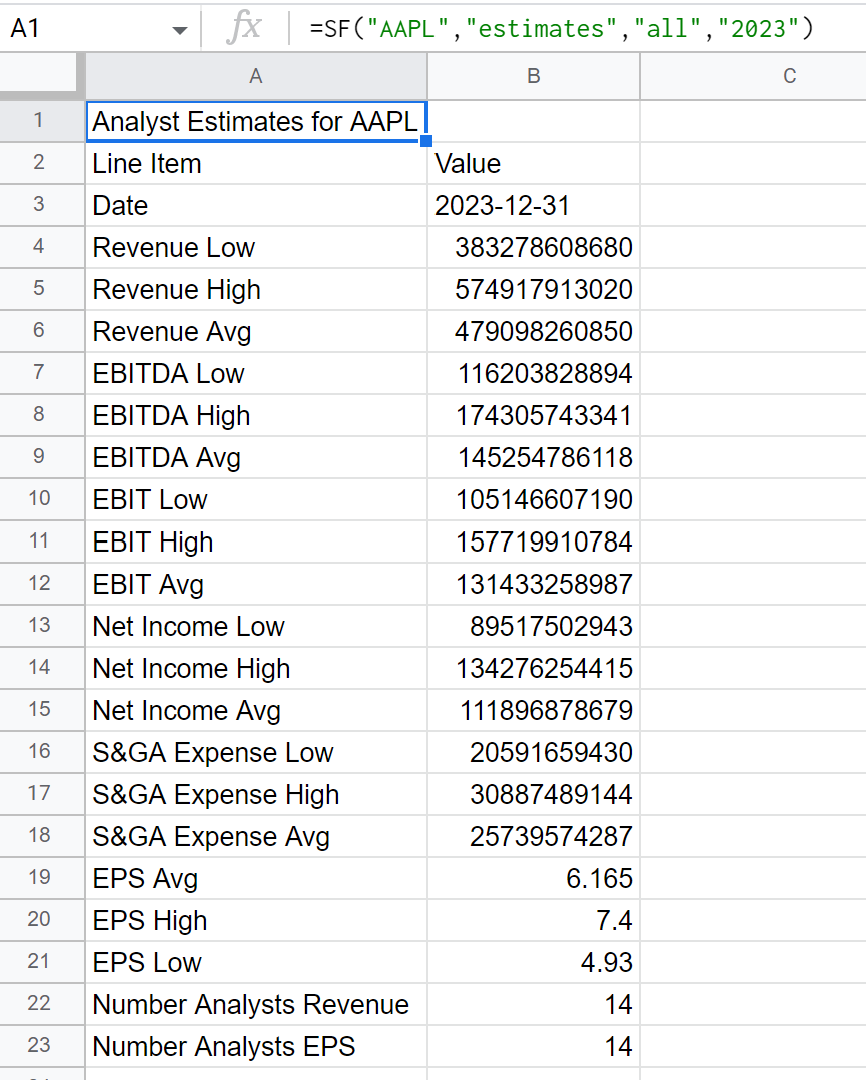
Example 2 - Several selected annual metrics, no options
=SF("AAPL", "estimates", "revenueAvg&epsAvg&numAnalystsRevenue&numAnalystsEps", "2025")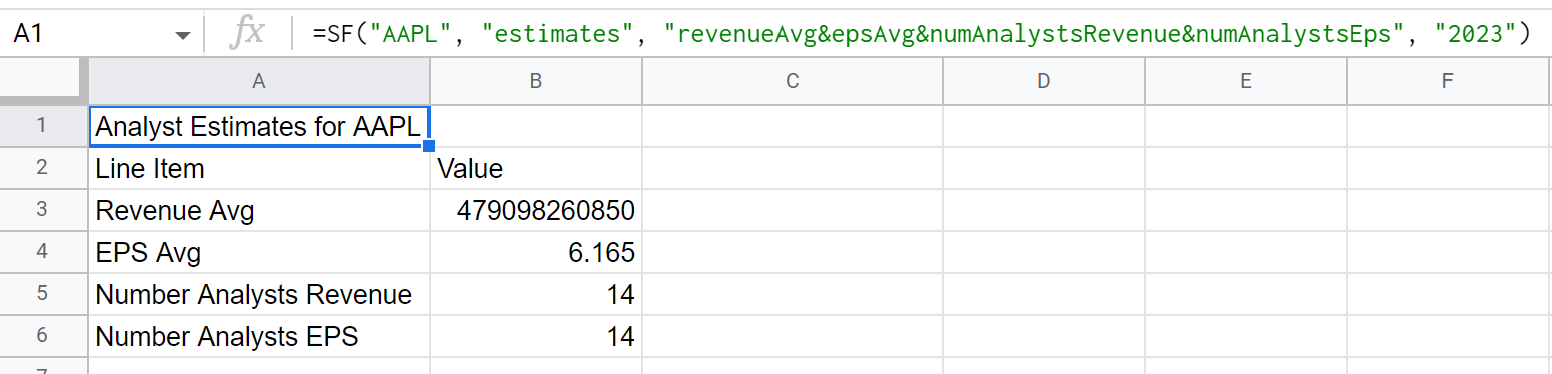
Example 3 - All with options selected (no header and no line item labels)
=SF("AAPL", "estimates", "all", "2025", "NH&NLI")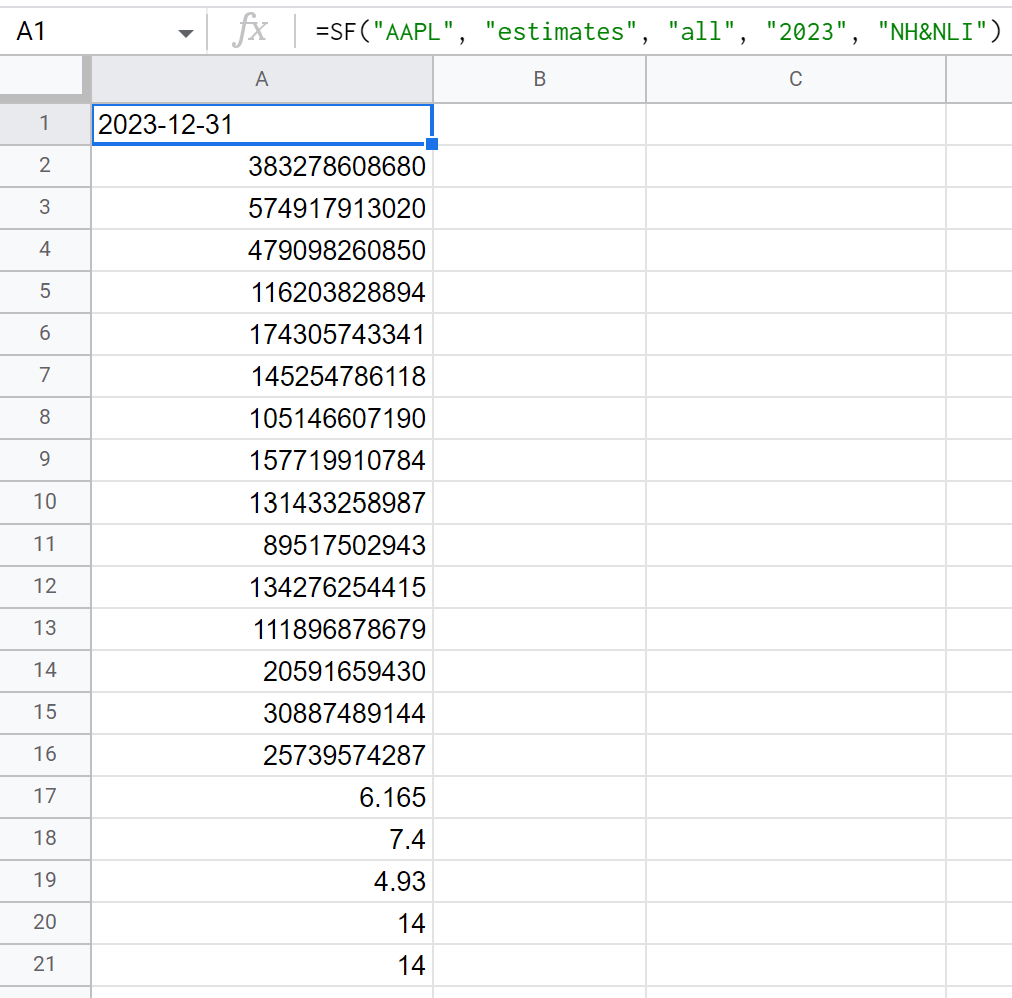
Example 4 - Multiple years of annual estimates (both historical and forecast)
=SF("AAPL", "estimates", "all", "2019-2025")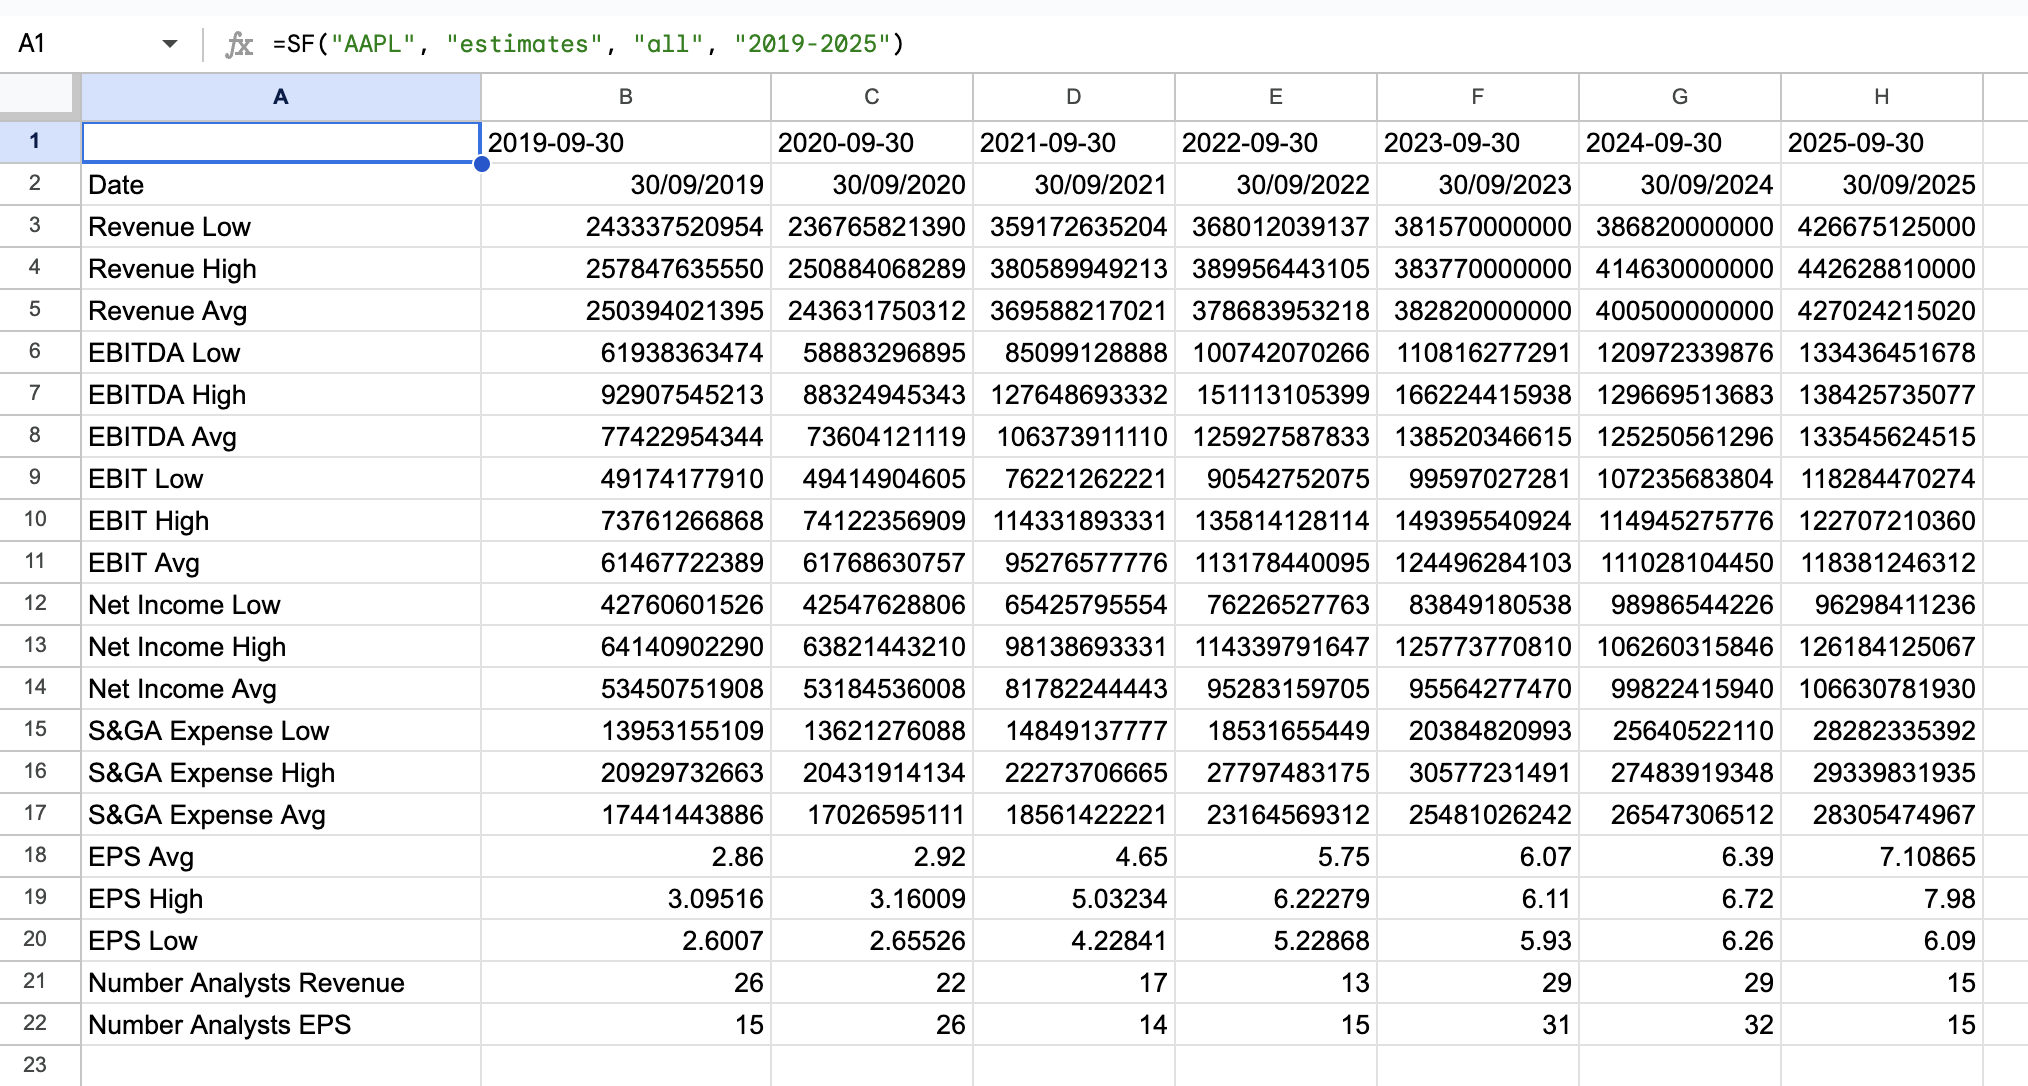
Example 5 - Quarterly estimates between two years
=SF("AAPL", "estimatesQ", "all", "2023-2024")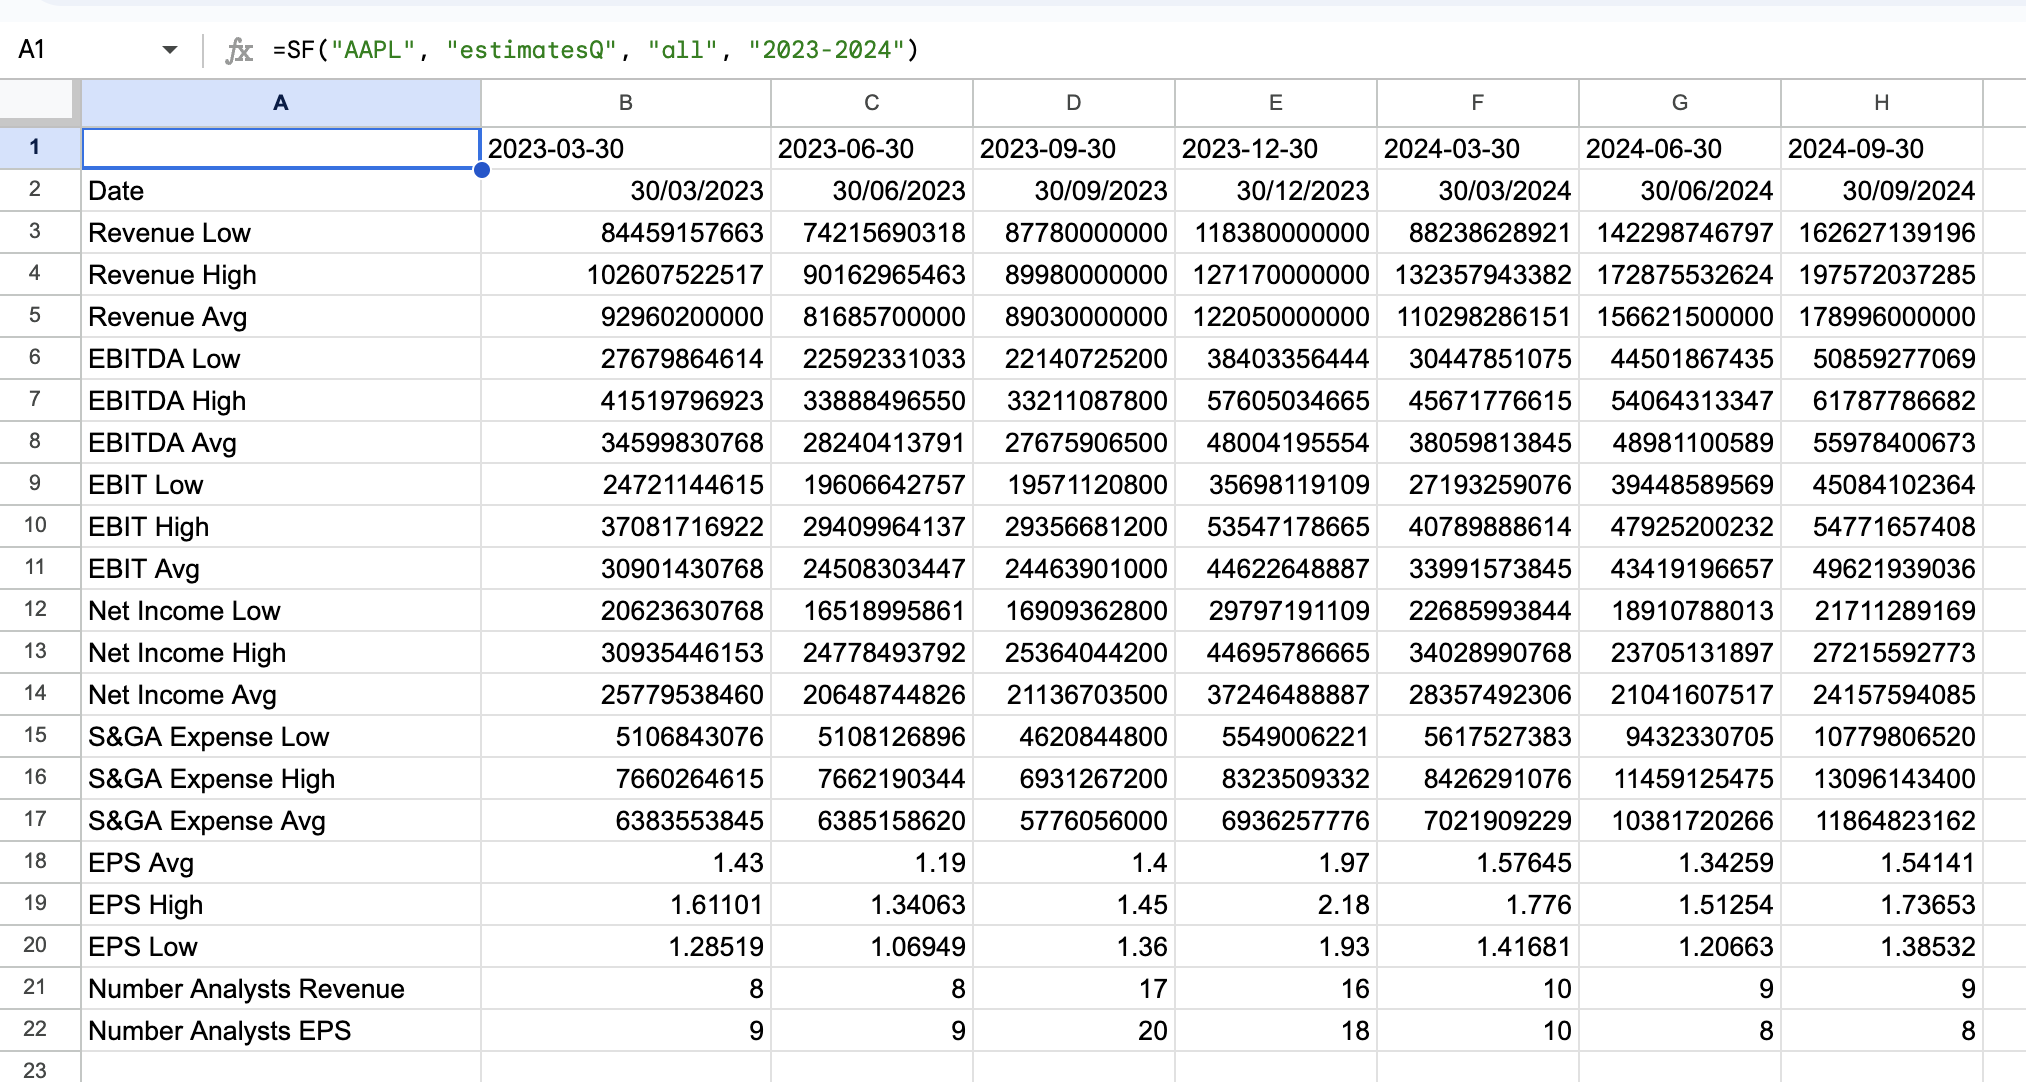
Example 6 - Quarterly estimates on a certain month and year
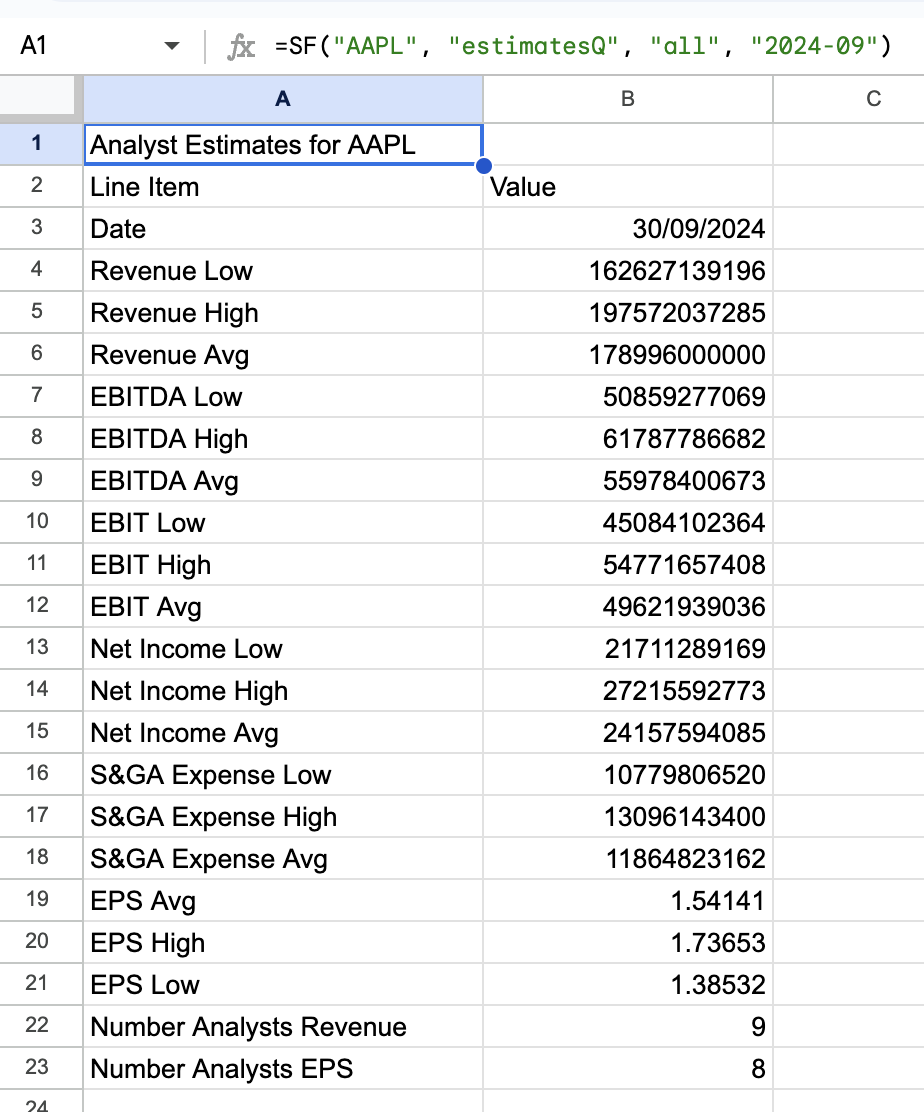
=SF("AAPL", "estimatesQ", "all", "2024-09")