How to Get IV Rank and IV Percentile in Google Sheets and Excel
IV rank and IV percentile help put a stock's current implied volatility into context. Instead of looking at an IV figure in isolation, you can compare it with the same underlying's recent volatility history.
With SheetsFinance Options, you can pull the current 30-day IV level, one-month and one-year IV rank, and one-month and one-year IV percentile directly into Google Sheets and Microsoft Excel using SF_OPTIONS_PRO().
You can request one symbol, batch an entire watchlist from a cell range, retrieve a historical point-in-time snapshot, or follow IV rank through time.
Start a 15-day free trial of SheetsFinance Options (no payment details required) to follow the examples in this guide. An active Options subscription is required for IV rank data.
What You Can Build
By the end of this guide, you will be able to:
- Pull current IV rank and IV percentile for one stock
- Compare one-month and one-year readings
- Screen a watchlist with one spreadsheet formula
- Reconstruct the watchlist on a historical date
- Chart IV rank and percentile for one symbol over time
- Avoid common mistakes when interpreting relative volatility measures
IV Rank vs IV Percentile
IV rank and IV percentile both compare current implied volatility with its own history, but they answer different questions.
| Measure | What it tells you |
|---|---|
| Current IV | The underlying's current 30-day implied volatility level. |
| IV rank | Where current IV sits within the high-to-low range observed over the selected lookback period. |
| IV percentile | How frequently historical IV observations were below the current reading over the selected lookback period. |
Conceptually, IV rank is sensitive to the highest and lowest observations in the window. IV percentile considers the distribution of observations throughout that window. This is why the two values can differ even though they use the same current IV level.
SheetsFinance provides both measures over one-month and one-year lookbacks, allowing you to compare recent conditions with a broader historical range.
Important: A high or low IV rank is context, not a trade signal by itself. It does not tell you whether future realised volatility will be higher or lower, whether an option is mispriced, or which strategy to use.
The SF_OPTIONS_PRO() IV Rank Function
The IV rank workflow uses the standard options function signature:
=SF_OPTIONS_PRO(symbol, "ivRank", "", "", tradeDate, endDate, metrics, options)For IV rank requests:
symbolcan be one ticker or a spreadsheet range containing multiple tickers.dataTypemust be"ivRank".expirationDateandstrikeremain blank because this is an underlying-level dataset.tradeDaterequests a historical snapshot or starts a time series.endDatecompletes a time series for one symbol but is unavailable for batch requests.metricscontrols which fields appear in the result.optionssupports output modifiers such as"NH"and"-".
1. Pull Current IV Rank for One Stock
The simplest request returns every available IV rank field for AAPL:
=SF_OPTIONS_PRO("AAPL", "ivRank")For a cleaner table, select the exact metrics you want:
=SF_OPTIONS_PRO("AAPL", "ivRank", "", "", "", "", "tradeDate&iv&ivRank1m&ivPct1m&ivRank1y&ivPct1y")This returns:
tradeDate: the date represented by the resultiv: current 30-day implied volatilityivRank1m: one-month IV rankivPct1m: one-month IV percentileivRank1y: one-year IV rankivPct1y: one-year IV percentile

The short and long lookbacks are useful together. A stock can be elevated relative to the past month while remaining ordinary relative to the past year, or the reverse.
Read the complete metric reference in the IV Rank documentation.
2. Screen an Entire IV Rank Watchlist
ivRank is the only SF_OPTIONS_PRO() data type that supports a range of symbols. If your tickers are in cells A2:A12, use:
=SF_OPTIONS_PRO(A2:A12, "ivRank", "", "", "", "", "tradeDate&iv&ivRank1m&ivPct1m&ivRank1y&ivPct1y")One formula returns the same IV fields for every symbol in the range, making it practical to create:
- IV rank watchlists
- Relative volatility screens
- Pre-trade research tables
- Event-monitoring dashboards
- Shortlists for deeper options-chain analysis
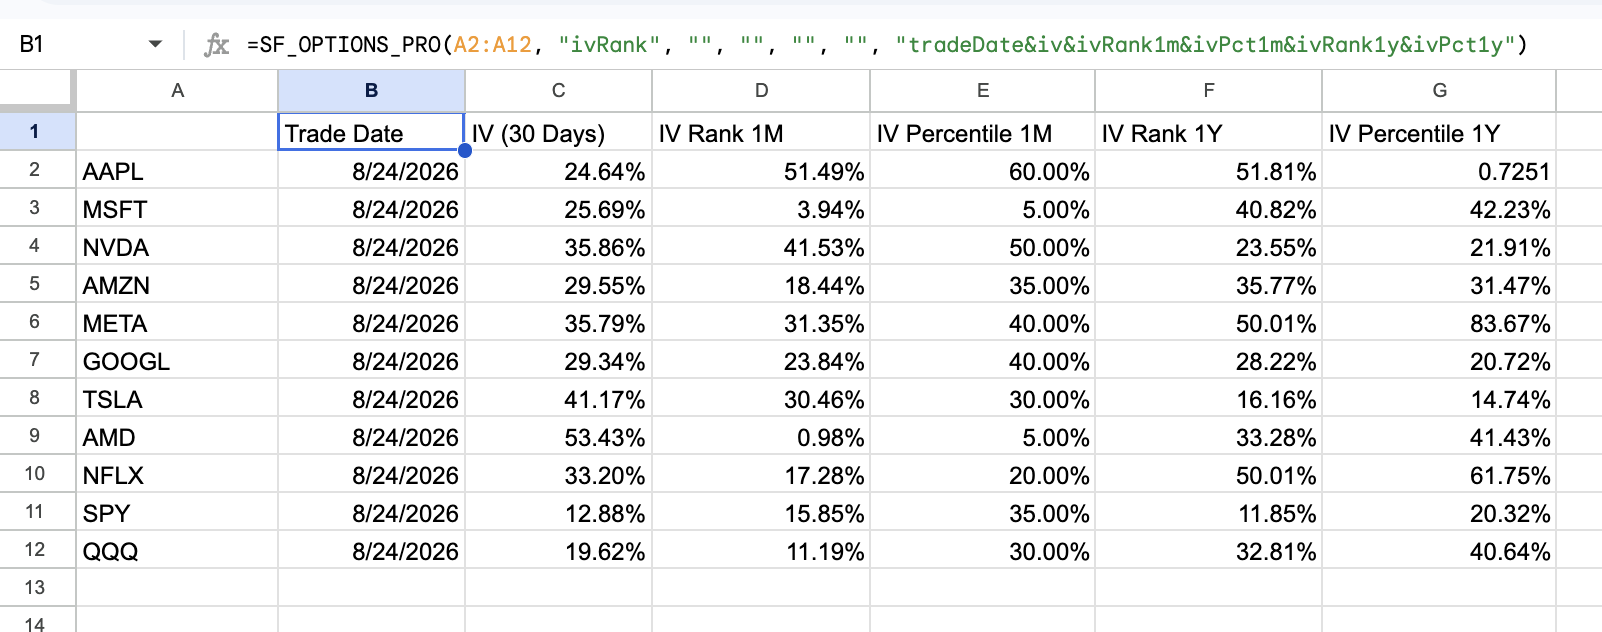
If you want to place your own headings above the result, add "NH" as the final argument to remove the generated header row:
=SF_OPTIONS_PRO(A2:A12, "ivRank", "", "", "", "", "tradeDate&iv&ivRank1m&ivPct1m&ivRank1y&ivPct1y", "NH")When using "NH", place the formula beside the first ticker so each output row aligns with the corresponding symbol. With headers included, place the formula one row above the first ticker.
See IV Rank Batch for the full batch parameter guide.
3. Reconstruct a Historical Watchlist Snapshot
Current readings tell you what the watchlist looks like today. Adding tradeDate lets you retrieve the same comparison as it stood on a past date:
=SF_OPTIONS_PRO(A2:A12, "ivRank", "", "", "2026-02-03", "", "tradeDate&iv&ivRank1m&ivPct1m&ivRank1y&ivPct1y")This is useful when reviewing an old trade, studying volatility around an event, or avoiding today's information when researching a historical decision.
Batch mode returns one current or historical snapshot for every ticker. It does not support endDate, so it cannot return a multi-date time series for an entire range in one request.
If you need to compare several historical dates across a watchlist, create a separate batch snapshot for each decision date. If you need a continuous range, use the single-symbol time-series workflow below.
4. Track IV Rank Through Time
For a single symbol, tradeDate becomes the start of the historical range and endDate becomes its end.
The following formula tracks AAPL from January 1 through March 31, 2026:
=SF_OPTIONS_PRO("AAPL", "ivRank", "", "", "2026-01-01", "2026-03-31", "tradeDate&iv&ivRank1m&ivPct1m&ivRank1y&ivPct1y", "-")The "-" option reverses the output order. Remove it if you prefer the default ordering.
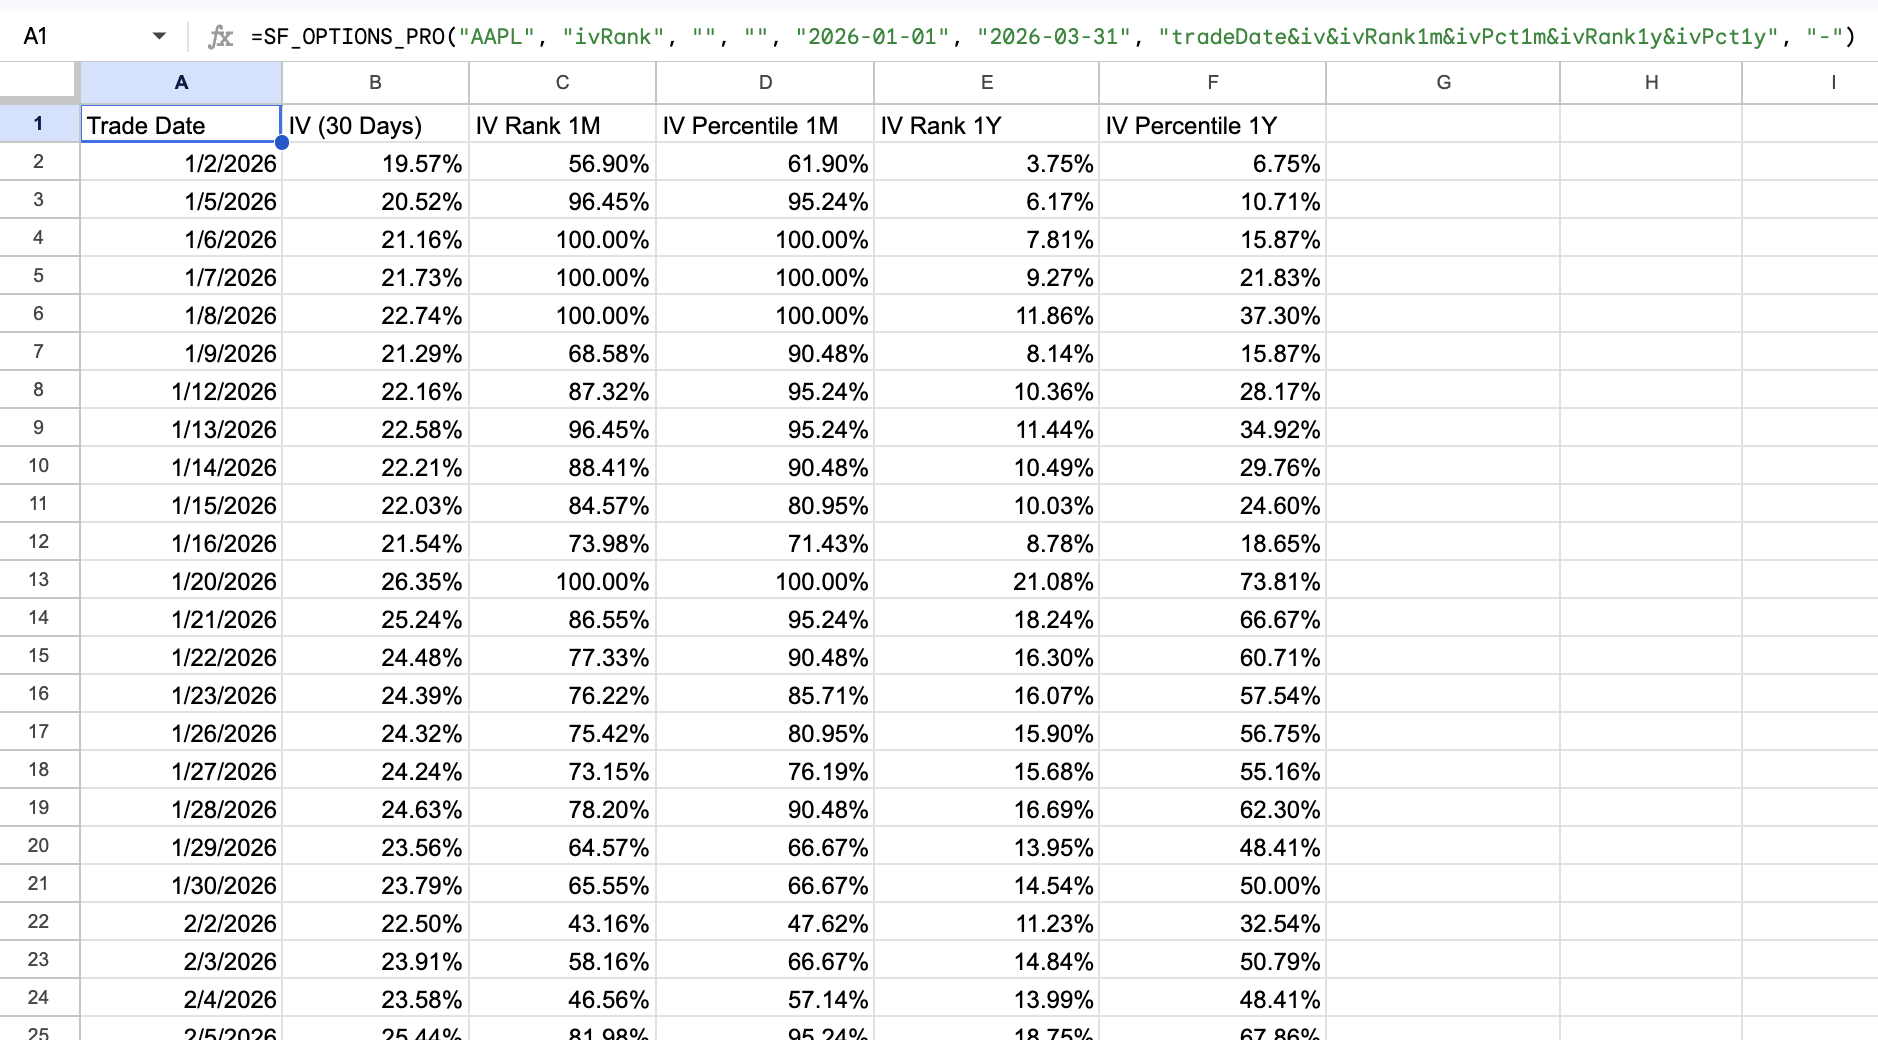
A time series makes it easier to study:
- How quickly IV conditions changed around an event
- Whether a high reading was brief or persistent
- Differences between one-month and one-year context
- How IV rank and percentile diverged during unusual observations
- Which thresholds would have triggered a historical screen
Time-series mode accepts one underlying at a time. For details, see IV Rank Time-series.
Available IV Rank Metrics
The complete set of fields is compact:
| Metric | Returned value |
|---|---|
ticker | Underlying symbol |
tradeDate | Current or historical observation date |
iv | 30-day implied volatility |
ivRank1m | One-month IV rank |
ivPct1m | One-month IV percentile |
ivRank1y | One-year IV rank |
ivPct1y | One-year IV percentile |
updatedAt | Dataset update timestamp |
Leave metrics blank or enter "all" to retrieve everything. To keep the output compact, join only the required field names with &.
A Practical IV Rank Screening Workflow
- Create the universe. Place the stocks you follow in one column and use the batch formula to retrieve their current readings.
- Choose the comparison window. Use the one-month fields for recent regime changes and the one-year fields for broader context. Looking at both usually gives a more complete picture.
- Apply transparent filters. For example, flag symbols above a chosen one-year IV-rank threshold while retaining current IV and IV percentile for context.
- Inspect the underlying chain. Use the screen as a shortlist, then review actual expirations, strikes, Greeks, liquidity, and bid-ask spreads before drawing conclusions.
- Review historical behaviour. Pull a time series for shortlisted names to see whether the current condition is persistent or unusual.
The spreadsheet should make the screening rule visible. Avoid manually selecting only the names that support a conclusion after seeing the result.
Common Interpretation Mistakes
- Treating rank and percentile as interchangeable: They describe different aspects of the historical distribution and can diverge substantially.
- Comparing raw IV across unrelated stocks: A 40% IV level may be unusual for one underlying and normal for another. Rank and percentile add security-specific context.
- Using a high reading as an automatic sell signal: Elevated IV does not guarantee that options are overpriced or that realised volatility will fall.
- Ignoring the lookback window: One-month metrics react to recent conditions, while one-year metrics reflect a much broader range.
- Ignoring liquidity and the chain itself: IV rank is an underlying-level screen. It does not replace contract-level analysis of spreads, size, Greeks, and expiration.
- Introducing look-ahead bias: Historical research should use the IV-rank snapshot that was available on the decision date, not today's reading.
Frequently Asked Questions
Can Google Sheets calculate IV rank for a stock?
Yes. With SheetsFinance Options, SF_OPTIONS_PRO("AAPL", "ivRank") returns current IV together with one-month and one-year IV rank and percentile directly in Google Sheets. The same function works in Microsoft Excel.
Can I screen multiple stocks with one formula?
Yes. Pass a cell range such as A2:A12 as the first argument. Batch support is specific to the ivRank data type.
Can I get historical IV rank?
Yes. Supply tradeDate for a historical snapshot. For one symbol, add endDate to retrieve a time series over a date range.
Can I retrieve a time series for an entire watchlist?
Not in one batch request. A range of symbols supports current or historical point-in-time snapshots, but endDate is unavailable in batch mode. Historical ranges are single-symbol requests.
Does high IV rank mean an option is expensive?
It means the underlying's current IV is high relative to its own selected historical window. Whether a particular option is attractive also depends on realised volatility expectations, skew, term structure, liquidity, spreads, events, and the trade structure.
Should I use one-month or one-year IV rank?
They answer different questions. One-month readings emphasise the recent regime, while one-year readings provide broader context. Comparing both can show whether a move is locally unusual or exceptional across a longer period.
Start Building an IV Rank Watchlist
The fastest workflow is to place your symbols in one column and pass the entire range to SF_OPTIONS_PRO():
=SF_OPTIONS_PRO(A2:A12, "ivRank", "", "", "", "", "tradeDate&iv&ivRank1m&ivPct1m&ivRank1y&ivPct1y")From there, you can sort or filter the results, retrieve historical snapshots, and open a single-symbol time series for the names that need deeper investigation.
Start a 15-day free trial, explore the IV Rank, IV Rank Batch, and IV Rank Time-series documentation, or use the Function Generator to build the formula interactively.
For the wider options toolkit, read How to Get Options Data in Google Sheets and Excel. If you are building a point-in-time options backtest, continue with How to Get Historical Options Data for Backtesting.