How to Get Stock Split History in Google Sheets and Excel
You can pull a company's complete recorded stock split history into Google Sheets or Microsoft Excel with one SF_TIMESERIES() formula. The result gives you one row per split with its effective date, numerator, denominator, numeric split ratio, and split type.
That makes it straightforward to answer questions such as when a company last split its shares, whether an event was a forward or reverse split, and how several splits compound over time. You can also filter the output to a specific research window without downloading and cleaning corporate-action files by hand.
Start a 15-day free trial of SheetsFinance Market Data (no payment details required) to reproduce every example in this guide. Stock split history is available from the Basic plan upward, and the Market Data trial includes Analyst-level feature access with a limit of 1,000 data calls per day.
What Stock Split History Returns
Set the fourth SF_TIMESERIES() argument to "splits" and SheetsFinance returns a two-dimensional table with one row for each recorded split:
| Metric | What it means | How to use it |
|---|---|---|
date |
The effective date of the split | Align the event with a price series or portfolio record |
numerator |
The number of new shares in the stated relationship | Read the first number in a 4-for-1 or 1-for-10 split |
denominator |
The number of old shares in the stated relationship | Read the second number in the relationship |
splitRatio |
A numeric value calculated as numerator divided by denominator | Calculate cumulative split factors or theoretical share counts |
splitType |
The recorded classification of the split | Separate or label event types in your analysis |
The numeric splitRatio is particularly useful in a spreadsheet. A 4-for-1 split has a numerator of 4, a denominator of 1, and a split ratio of 4. A 1-for-10 reverse split has a numerator of 1, a denominator of 10, and a split ratio of 0.1.
A conventional stock split increases the share count without changing the shareholder's ownership interest. A reverse split converts existing shares into a smaller number of shares. Investor.gov explains the basic stock-split mechanics and notes in its reverse-split guidance that some transactions may pay cash instead of issuing a fractional share. That distinction matters when you use the ratio to reconstruct an actual brokerage position.
The SF_TIMESERIES() Stock Split Formula
The stock split workflow uses the standard time-series signature:
=SF_TIMESERIES(symbol, startDate, endDate, period, metrics, options)For split history, the arguments work as follows:
symbolis the stock ticker as a cell reference or text value, such asA2or"AAPL".startDateandendDateoptionally filter the history. UseYYYY-MM-DDwhen you enter dates as text. Leave both blank for the full available history.periodmust be"splits".metricscan be"all", blank, or a list joined with&, such as"date&splitRatio".optionscontrols output formatting. Results are newest first by default. Use"-"to reverse them into oldest-first order,"NH"to remove the header, or combine them as"-&NH".
The same function and arguments work in Google Sheets and Excel.
1. Pull Apple's Complete Stock Split History
Enter this formula in A1 to return every recorded Apple split and all five available fields:
=SF_TIMESERIES("AAPL","","","splits","all","")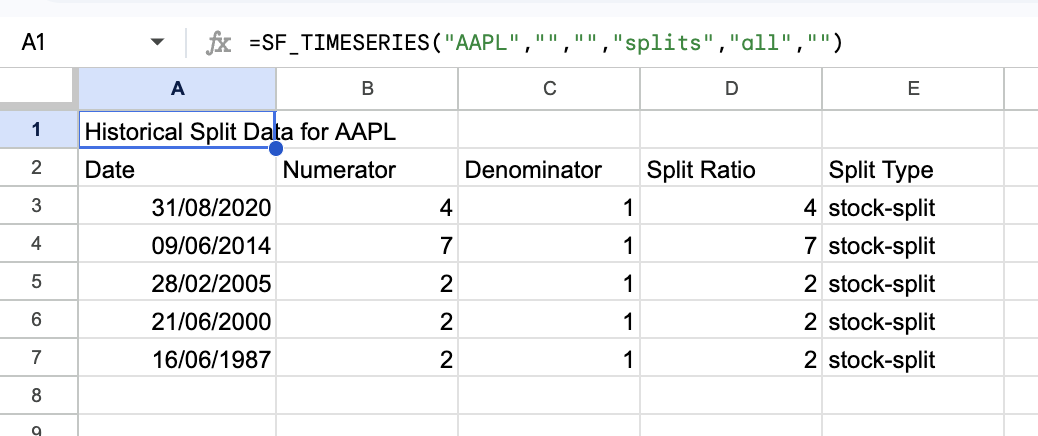
The two empty date arguments tell SheetsFinance not to restrict the history. The final empty string keeps the default headers and ordering. Because the result spills into several rows and columns, clear the surrounding cells before entering the formula; otherwise Google Sheets may show #REF! and Excel may show #SPILL!.
You can replace "AAPL" with a cell reference to create a reusable lookup. Put a ticker in B1, then use:
=SF_TIMESERIES(B1,"","","splits","all","")Changing B1 to another supported stock symbol refreshes the event table without changing the formula.
2. Filter the History and Put the Oldest Split First
For a focused research window, provide a start date, end date, and only the metrics you need. This example returns Microsoft's recorded splits from 1990 through the end of 2025, then uses "-" to reverse the default order so the oldest event appears first:
=SF_TIMESERIES("MSFT","1990-01-01","2025-12-31","splits","date&numerator&denominator&splitRatio&splitType","-")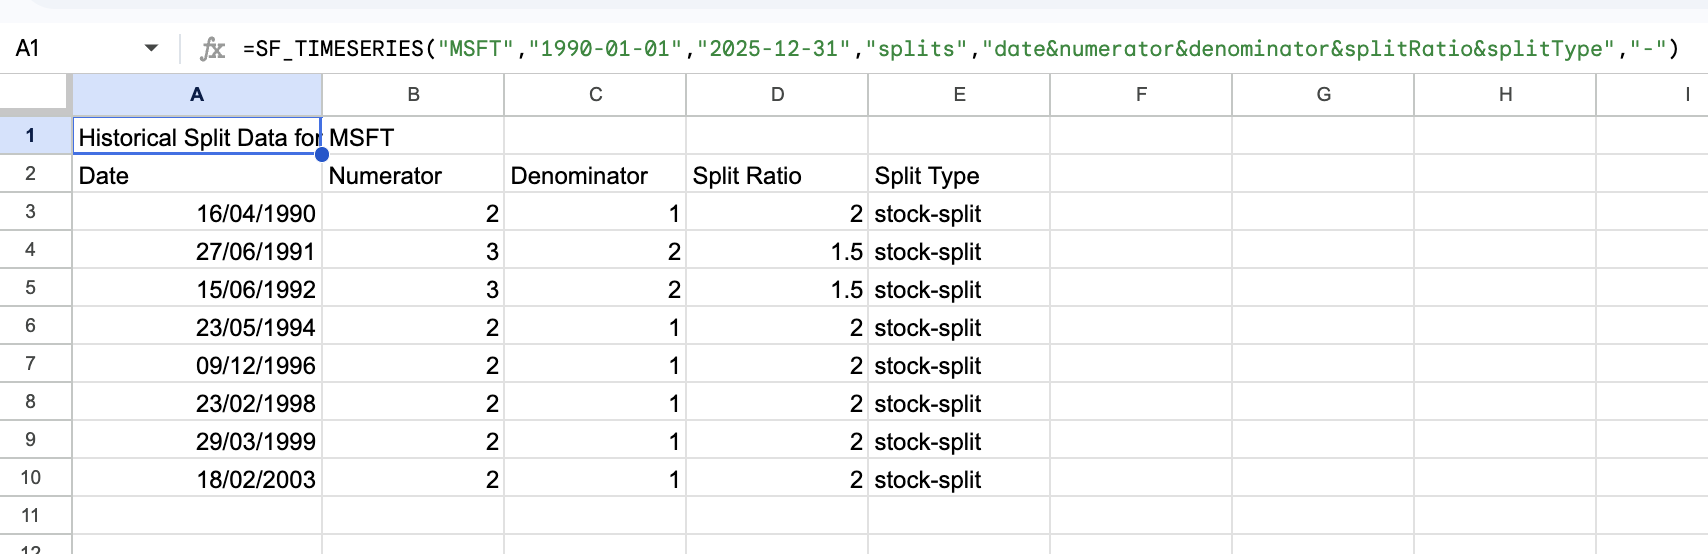
Either date can be supplied independently. That is useful when you want every event after an investment date or every split up to a historical portfolio snapshot.
If no recorded split exists within the requested range, the function returns an empty result or the standard no-data message. That does not mean the formula failed; check the symbol and date window before changing the syntax.
3. Calculate a Cumulative Split Factor and Share Count
A single ratio describes one event. To see how several splits compound, use "-" to return the history from oldest to newest and calculate the running product of splitRatio.
Start the split history in A1:
=SF_TIMESERIES("AAPL","","","splits","date&numerator&denominator&splitRatio&splitType","-")The output title occupies row 1, the column headers occupy row 2, and the first split appears in row 3. Add the label Cumulative split factor in F2. In F3, enter the following standard spreadsheet formula and fill it down beside the split rows:
=PRODUCT($D$3:D3)Next, put Starting shares in I2 and a hypothetical starting value such as 100 in I3. Add Shares after split in G2, then enter this formula in G3 and fill it down:
=$I$3*F3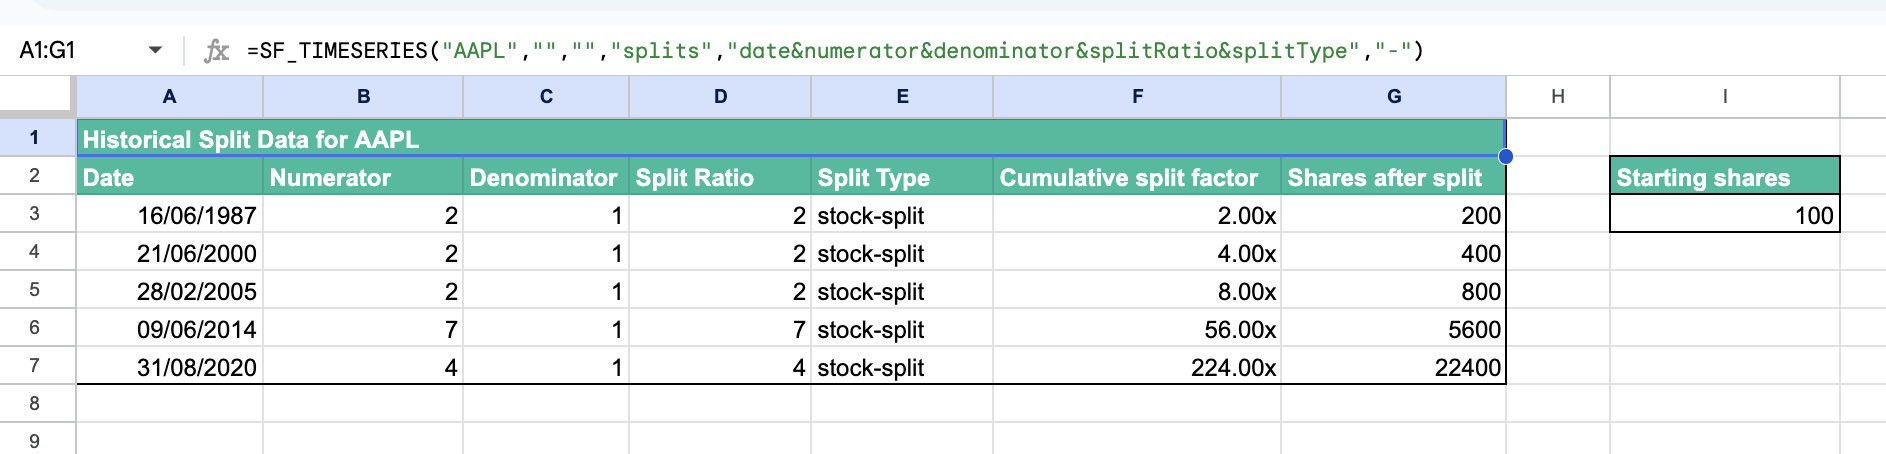
This calculates the mechanical effect of the recorded ratios. It is not a brokerage ledger. The result does not model purchases, sales, symbol changes, fractional-share policies, fees, or cash-in-lieu payments that may occur around a reverse split. Use actual account records when reconciling a real holding.
Do not use the cumulative factor to adjust SheetsFinance price history. The standard daily SF_TIMESERIES() output is already split-adjusted, while the "dailyAdj" period provides a dividend-adjusted daily series. Applying the split ratios again would adjust the price data twice. If you are measuring long-run total-return performance, use the dividend-adjusted series or an appropriate total-return calculation rather than treating additional shares from a split as an investment gain.
For more on historical price data, continue with Historical and Intraday Stock Data in Google Sheets. For a dividend-aware return workflow, see Calculating the Daily Total Return of a Stock in Google Sheets.
Stock Split History vs the Splits Calendar
SheetsFinance offers two related workflows. Choose the one that matches the question you are asking:
| Question | Use | Best for | Important limit |
|---|---|---|---|
| What splits has this company recorded? | SF_TIMESERIES(...,"splits",...) |
One symbol's full or date-filtered history | The selected symbol must have recorded split data |
| Which stocks split during this market window? | SF_CALENDAR(...,"splits",...) |
Historic or upcoming events across symbols or exchanges | Maximum 90-day range per call |
Use the calendar when the date window is the starting point and you want to discover events across a market. Use stock split history when a particular company is the starting point and you want its recorded event timeline.
The existing financial calendars guide shows how to monitor splits across several symbols or exchanges. The complete Stock split history function reference documents the company-specific workflow used in this article.
A Practical Research and Backtesting Workflow
- Confirm the symbol. Use the SheetsFinance Symbol Search when the security needs an exchange suffix.
- Pull the full split history. Start with
"all"metrics so you can inspect every recorded field. - Choose the relevant window. Add start and end dates that match the portfolio, event study, or backtest.
- Keep the numeric ratio. Include
splitRatiowhen you need calculations; numerator and denominator make the relationship easier to audit. - Use adjusted price data. Do not create an artificial price jump by combining raw assumptions with a split-adjusted price series.
- Validate unusual events. Check the event against company filings or another authoritative source when a corporate action materially affects your analysis.
- Document assumptions. Record whether a share-count calculation is theoretical or reconciled to actual brokerage activity.
Common Mistakes to Avoid
- Using
"daily"instead of"splits": Daily returns price history, not a corporate-action table. - Putting
"splits"in the metrics argument: It belongs in the fourthperiodargument. - Reading a reverse split as a forward split: A ratio below 1 indicates fewer new shares per old share; inspect numerator, denominator, and split type together.
- Using the
ratiocalendar metric in the history formula: Stock split history uses the numeric metric namesplitRatio. - Applying split factors twice: The standard daily time series is already split-adjusted.
- Leaving occupied cells in the spill range: Clear the target area before inserting a multi-row result.
- Assuming a split created an investment return: A split changes the share relationship and per-share price mechanically; it does not by itself increase the shareholder's proportional ownership.
- Treating a theoretical share count as an account record: Fractional-share handling and cash-in-lieu can make an actual reverse-split outcome differ from a simple multiplication.
Frequently Asked Questions
How do I find Apple's stock split history in Google Sheets?
Use =SF_TIMESERIES("AAPL","","","splits","all",""). It returns Apple's full recorded split history with the effective date, numerator, denominator, numeric split ratio, and split type. The same formula works in Excel.
Can I find reverse stock splits?
Yes. The history includes numerator, denominator, splitRatio, and splitType. A 1-for-10 relationship produces a numeric ratio of 0.1. Review the recorded classification and the ratio together rather than relying on formatting alone.
Can I use a date from another cell?
Yes. Replace a quoted date with a cell reference, such as =SF_TIMESERIES(A2,B2,C2,"splits","all",""), where A2 contains the symbol and B2:C2 contain spreadsheet dates.
What happens when a company has no split history?
If the selected symbol has no recorded splits in the requested range, the function returns an empty result or the standard no-data message. Check the ticker format and dates before concluding that data is unavailable.
Is historical price data already adjusted for stock splits?
Yes. The standard daily SF_TIMESERIES() output is split-adjusted. Use "dailyAdj" when you need a dividend-adjusted daily series. Do not multiply an adjusted price history by the split factors again.
Can I pull stock split history into Microsoft Excel?
Yes. Stock split history is available in SheetsFinance for both Google Sheets and Microsoft Excel with the same SF_TIMESERIES() syntax.
Start Building a Reusable Split-History Sheet
Begin with the full-history formula, replace the ticker with a cell reference, and add only the calculations your research requires. You will have a reusable corporate-action worksheet that can move from Apple to Amazon, Microsoft, or another supported stock without a manual data import.
Review the official Stock split history documentation, or start a 15-day Market Data trial to build the workflow in Google Sheets or Excel.