How to Build an Options Implied Volatility Surface in Google Sheets and Excel
An implied volatility surface shows how the options market prices volatility across both expiration dates and delta levels. It brings volatility skew, smile, and term structure into one view instead of reducing an entire options chain to a single IV number.
With SheetsFinance Options, you can pull a complete delta-based volatility surface directly into Google Sheets or Microsoft Excel using SF_OPTIONS_PRO(). You can retrieve the current market surface, isolate one expiration, reconstruct a historical snapshot, or compare observed values with a modelled surface forecast.
Start a 15-day free trial of SheetsFinance Options (no payment details required) to follow the examples in this guide. An active Options subscription is required for surface data.
What You Can Build
By the end of this guide, you will be able to:
- Pull the current implied volatility surface for every available expiration
- Inspect volatility smile and skew for one expiration
- Return only the surface metrics required for your analysis
- Reconstruct the surface as it appeared on a historical date
- Compare the observed market surface with a forecast surface
- Interpret the result without treating it as a standalone trading signal
What Is an Implied Volatility Surface?
A single option's implied volatility reflects the volatility implied by its market price. An underlying has many listed options, however, and those contracts differ by strike, delta, and time to expiration.
A volatility surface organises those observations across two dimensions:
- Expiration: how implied volatility changes from shorter-dated to longer-dated options
- Delta: how implied volatility changes across different parts of the option distribution
The volatility value at each point becomes the third dimension. Looking across one expiration reveals the smile or skew. Looking down comparable delta points across expirations reveals the term structure.
SheetsFinance returns the surface on a standard delta grid from vol0 through vol100, with vol50 near the centre of the grid. This makes different expirations easier to compare even when their listed strikes do not line up.
Important: A surface describes the options market's current or historical pricing. It does not predict realised volatility, guarantee that an option is mispriced, or determine which strategy to use.
The SF_OPTIONS_PRO() Surface Function
Surface requests use the standard options function signature:
=SF_OPTIONS_PRO(symbol, "surface", expirationDate, "", tradeDate, "", metrics, options)For this workflow:
symbolis the underlying ticker, such as"AAPL".dataTypeis"surface"for the observed market surface or"surfaceForecast"for the modelled forward surface.expirationDateis optional and restricts the output to one expiry.strikeremains blank because surfaces are returned at the underlying level.tradeDateis optional and requests a historical point-in-time snapshot.endDateremains blank because surfaces are snapshots rather than time-series requests.metricscontrols the fields returned. Use"gridOnly"for a chart-ready delta grid.optionssupports formatting modifiers such as"NH"and"-".
Read the complete parameter and metric reference in the Surface documentation.
1. Pull the Current Surface for Every Expiration
The fastest way to inspect the complete current surface is to request only the volatility grid:
=SF_OPTIONS_PRO("AAPL", "surface", "", "", "", "", "gridOnly")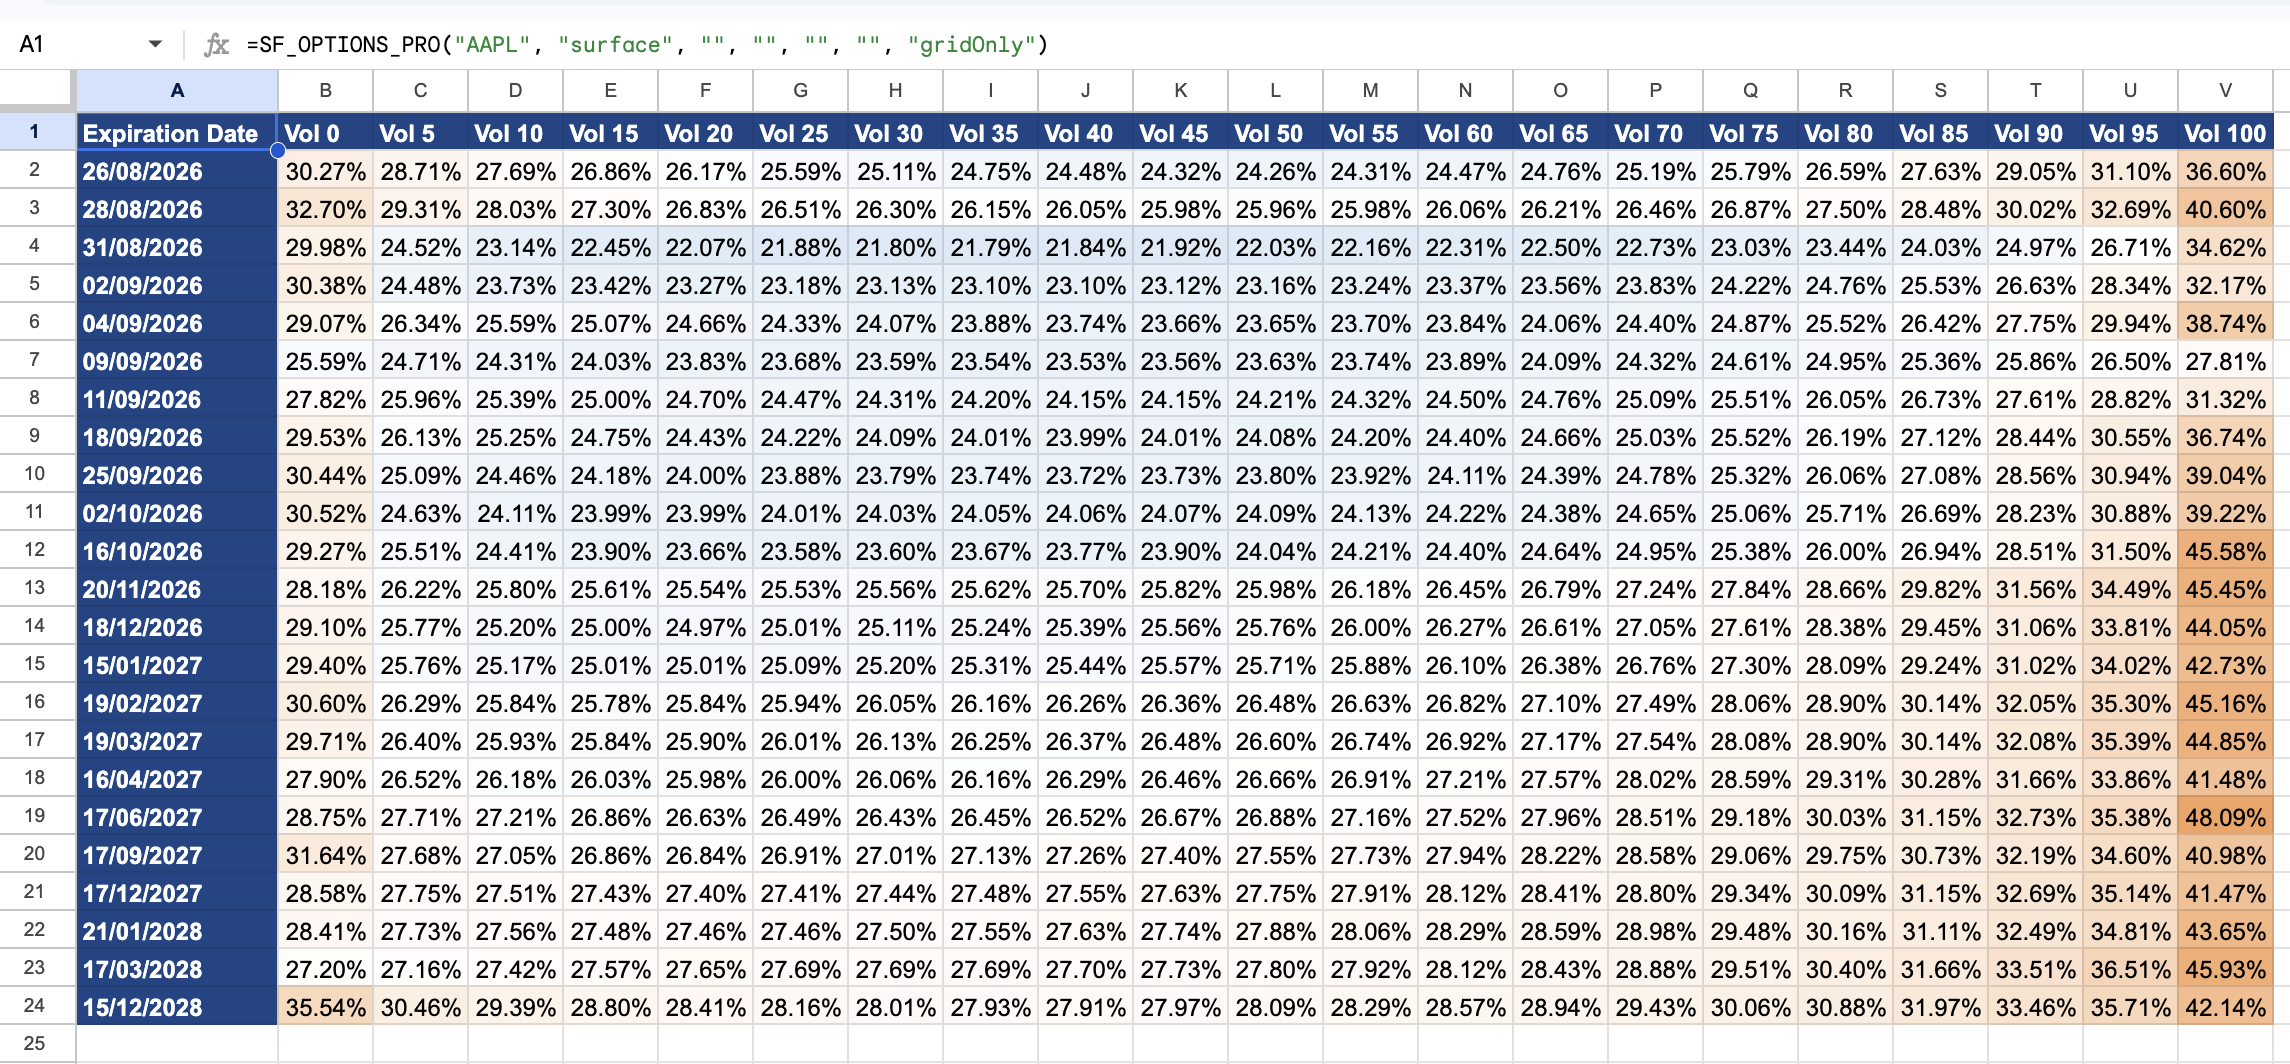
Each row represents an expiration date and each vol column represents a point on the delta grid. This compact output is useful for:
- Comparing volatility across expirations
- Identifying where the curve is elevated or depressed
- Reviewing how the wings differ from the centre of the grid
- Creating conditional-formatting heatmaps
- Feeding the grid into spreadsheet charts or further calculations
The grid is already structured consistently across expirations, so you do not need to download separate chains, match strikes, calculate contract IV, and reshape the result manually.
Tip: Create the heatmap in Google Sheets
- Select only the volatility cells—for example
B2:Vwhen the formula begins inA1. Do not include the headings or expiration dates.- Open Format → Conditional formatting.
- In the conditional-formatting panel, select the Colour scale tab.
- Set Min value to pale blue (
#DCEAF7).- Set the Midpoint to 50th percentile with white (
#FFFFFF).- Set Max value to warm orange (
#F4A261), then click Done.Apply one rule across the complete grid. Cooler cells then represent lower implied volatility and warmer cells represent higher implied volatility without suggesting that either is inherently good or bad. Avoid applying a separate scale to each row because the colours would no longer be comparable across expirations.
2. Inspect the Smile or Skew for One Expiration
To focus on one expiration, enter its date as the third argument:
=SF_OPTIONS_PRO("AAPL", "surface", "2026-10-16", "", "", "", "gridOnly")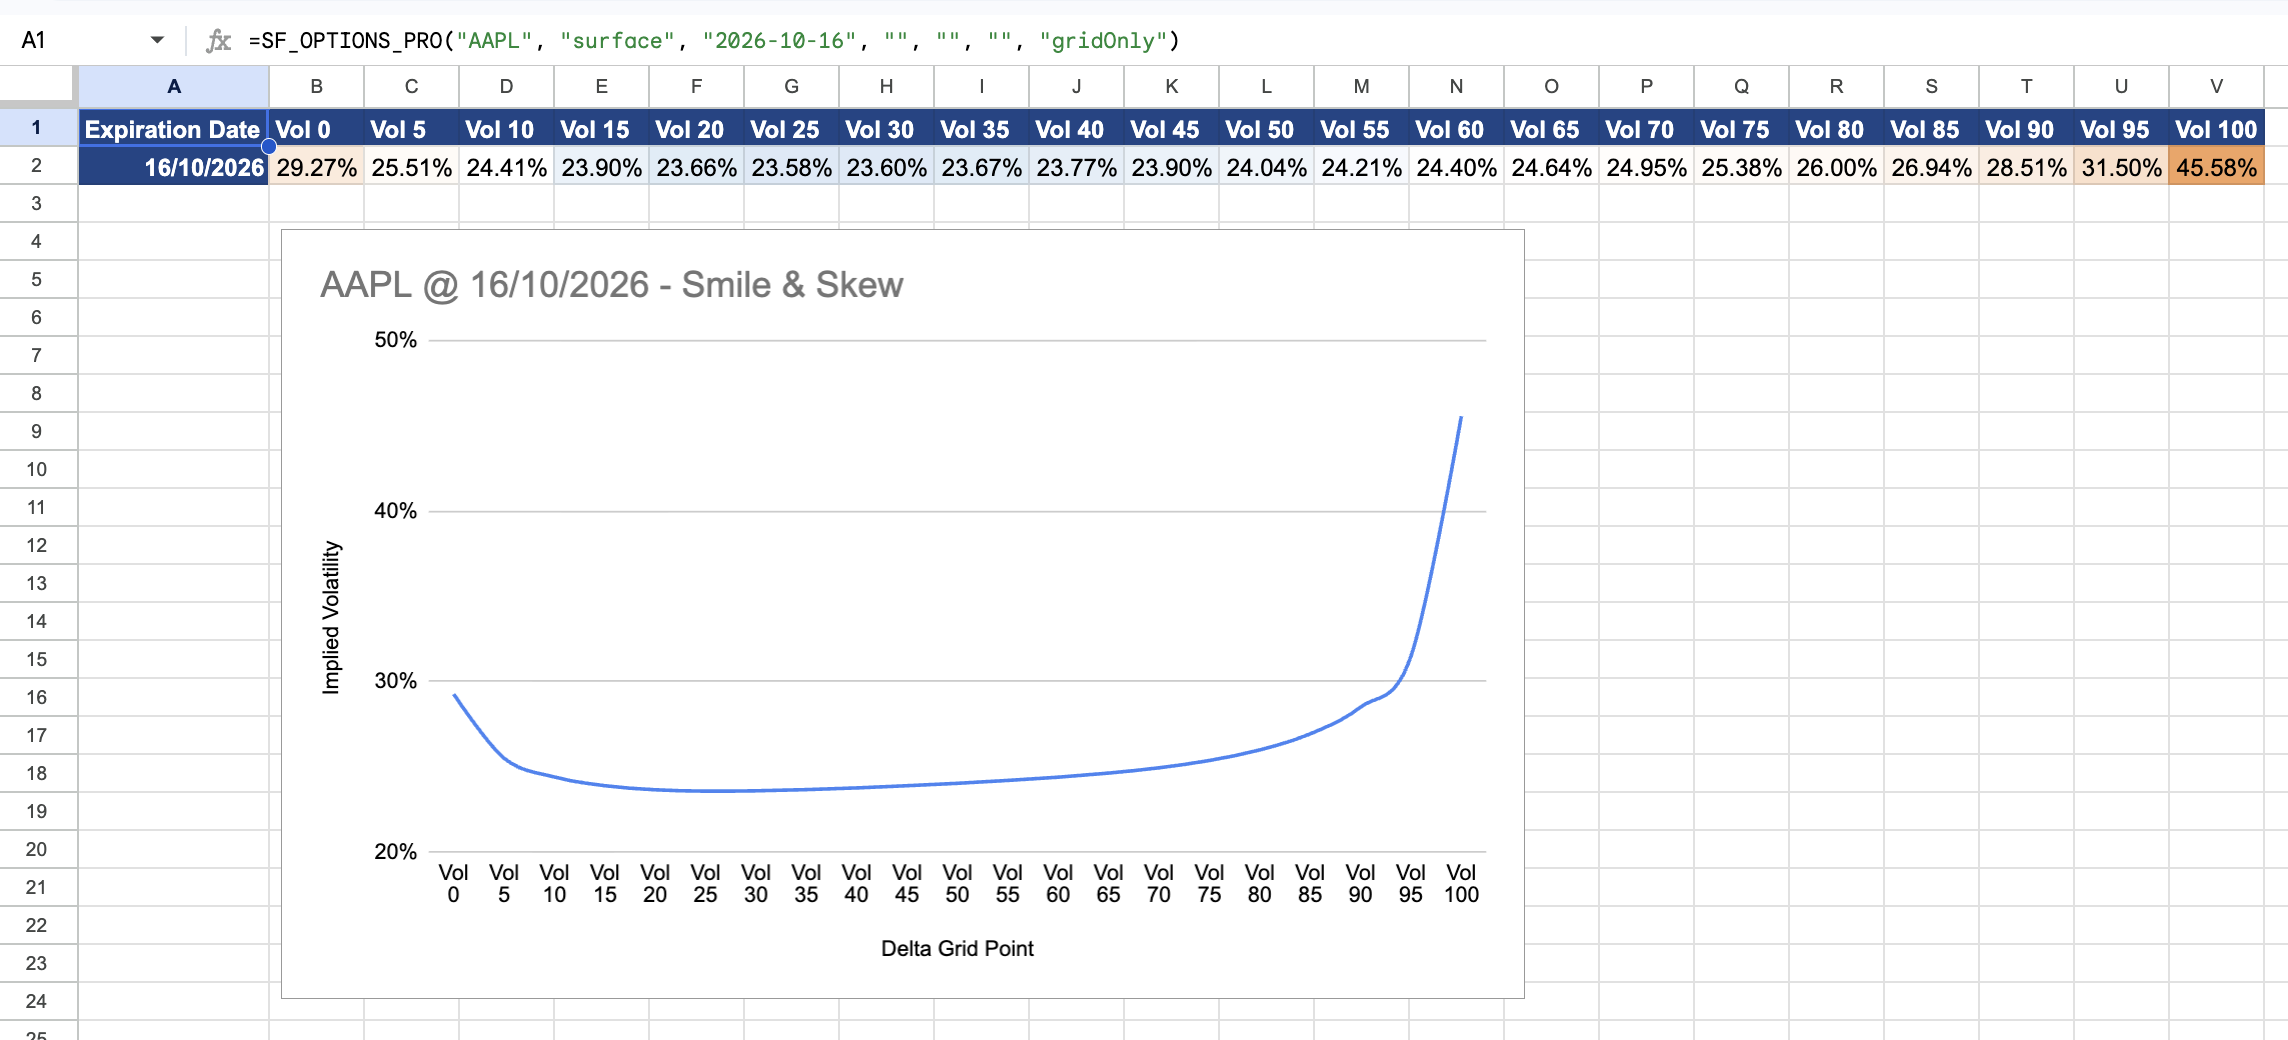
With one row of delta-based volatility values, you can create a simple line chart:
- Use the returned
vol0tovol100headings as the horizontal axis. - Use the implied volatility values as the vertical axis.
- Format the vertical axis as a percentage.
- Keep the full grid visible so the centre and both wings remain in context.
The resulting shape can help you see whether implied volatility is relatively balanced, tilted toward one side, or elevated in both wings. Compare the shape with nearby expirations before deciding whether it is persistent or specific to one date.
If you do not know which expirations are currently available, retrieve them first:
=SF_OPTIONS_PRO("AAPL", "expirationDates")You can then reference an expiration cell in the surface formula rather than typing the date manually.
3. Return Surface Context Alongside the Grid
"gridOnly" is ideal for charting, but the full surface dataset also contains expiration-level context. Select only the fields you need by joining their names with &:
=SF_OPTIONS_PRO("AAPL", "surface", "", "", "", "", "expirDate&stockPrice&atmiv&calVol&unadjVol&earnEffect&confidence&vol25&vol50&vol75")Useful fields include:
| Metric | What it provides |
|---|---|
expirDate | The option expiration represented by the row |
stockPrice | The underlying stock price associated with the surface |
atmiv | At-the-money implied volatility |
calVol | Smoothed at-the-money volatility |
unadjVol | Smoothed at-the-money volatility excluding the earnings effect |
earnEffect | The earnings effect embedded in the expiration |
confidence | The dataset's confidence field for the surface fit |
vol25, vol50, vol75 | Selected points from the delta-based volatility grid |
This narrower table is often more practical than returning every surface field. It keeps ATM volatility, event context, confidence, and representative grid points beside each expiration.
Leave metrics blank or enter "all" when you need the complete dataset. The Surface documentation lists every field from vol0 through vol100 as well as the additional fit, rate, date, and update fields.
4. Reconstruct a Historical Volatility Surface
Current data cannot tell you what the surface looked like before an old earnings release, volatility event, or trading decision. Add a historical tradeDate to request the point-in-time snapshot that was available on that date:
=SF_OPTIONS_PRO("AAPL", "surface", "", "", "2025-10-01", "", "expirDate&atmiv&earnEffect&vol25&vol50&vol75&tradeDate")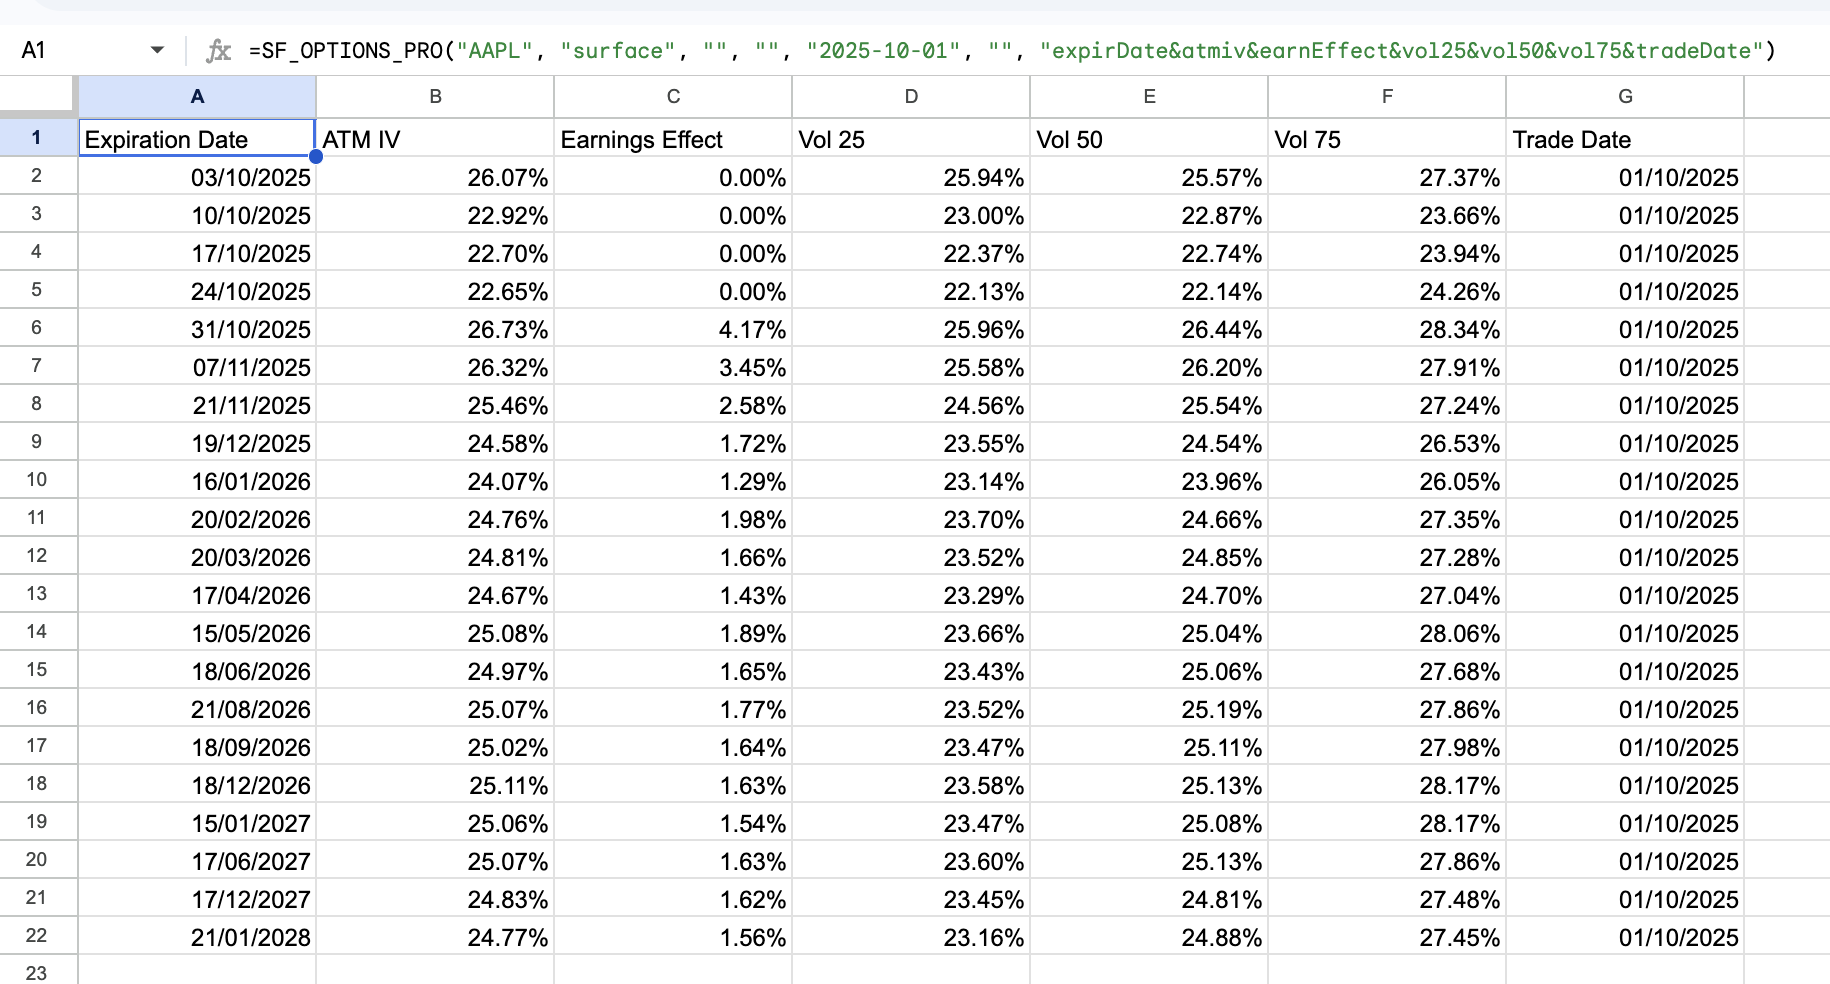
Historical surface snapshots are useful for:
- Reviewing the surface before a known event
- Comparing the market's old volatility assumptions with the subsequent outcome
- Avoiding today's surface when researching a historical decision
- Studying how skew or term structure differed across market regimes
- Comparing the same delta points on several selected dates
Surface history is snapshot-based. endDate does not produce a continuous surface time series. To compare several dates, place one snapshot formula for each chosen tradeDate and keep the symbol, expiration, and metric selection consistent.
That consistency matters. Comparing different delta points or different expiration profiles can make an apparent surface change difficult to interpret.
5. Compare the Market Surface With the Forecast Surface
SheetsFinance also provides a separate surfaceForecast dataset containing modelled forward surface values across the same delta grid:
=SF_OPTIONS_PRO("AAPL", "surfaceForecast", "", "", "", "", "gridOnly")For a direct expiration-level comparison, place the observed and forecast formulas beside one another:
=SF_OPTIONS_PRO("AAPL", "surface", "2026-10-16", "", "", "", "gridOnly")=SF_OPTIONS_PRO("AAPL", "surfaceForecast", "2026-10-16", "", "", "", "gridOnly", "NH")The "NH" option removes the forecast result's header row, allowing the two outputs to form one chart-ready table:
- Enter the observed formula in
B1. It returns the headings in row 1 and observed values in row 2. - Type
Observed SurfaceinA2. - Enter the forecast formula in
B3. With"NH", its values spill directly into row 3 without repeating the headings. - Type
Forecast SurfaceinA3. - In the Google Sheets chart editor, use the non-contiguous data range
A1:A3,C1:W3and set Combine ranges to Horizontally. Turn on Switch rows/columns, then use row 1 as the headers and column A as the series labels. This usesvol0throughvol100for the horizontal axis and the labels inA2:A3for the two series, while excluding the expiration dates in column B. If Google Sheets retained an old chart configuration, remove the chart and insert a new line chart after setting the corrected range.
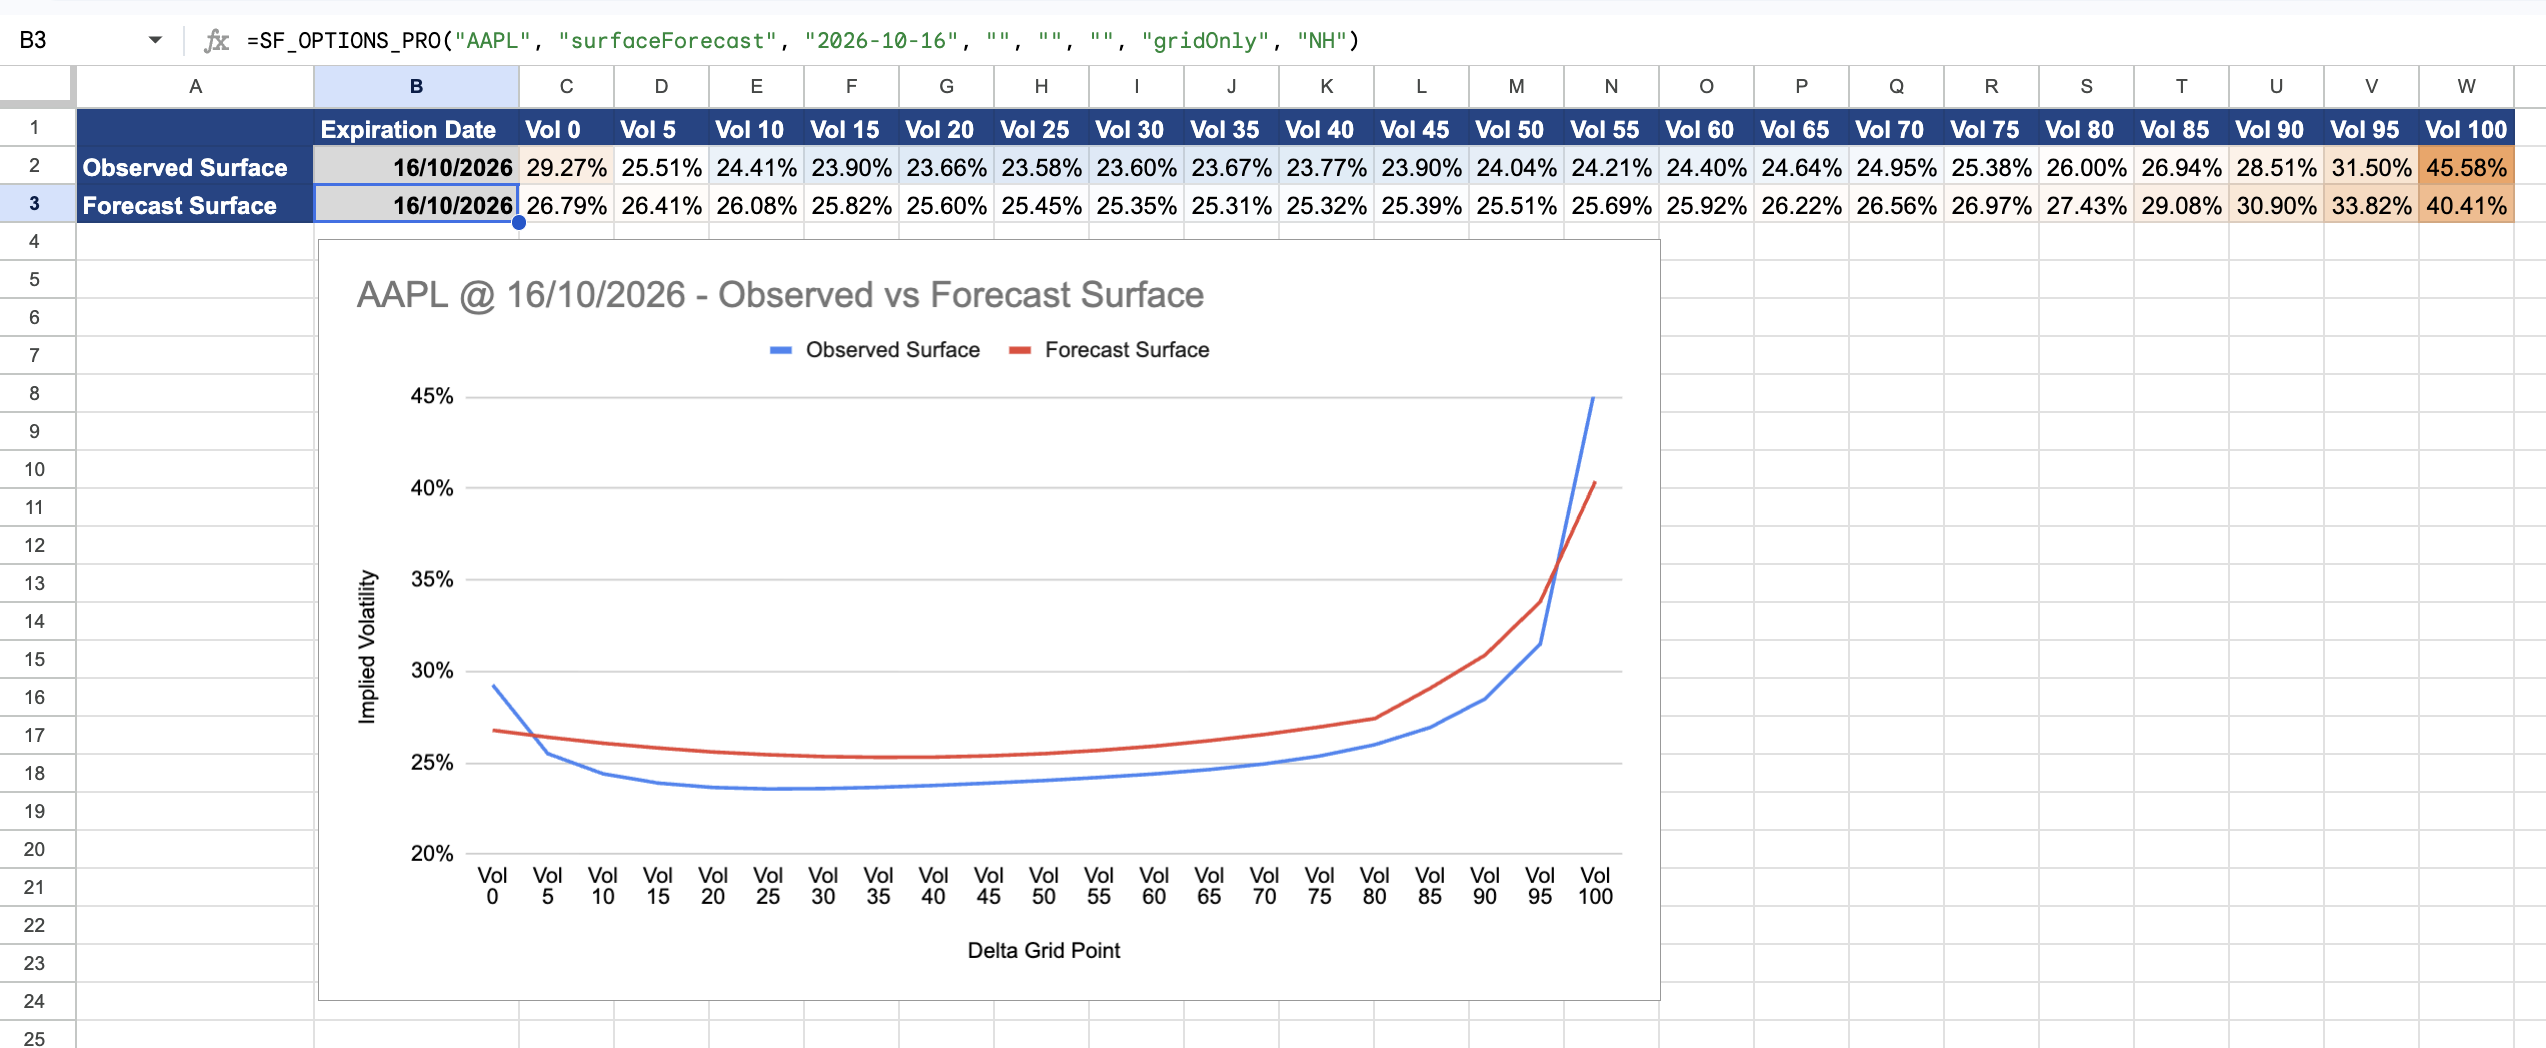
Because both datasets use the same vol0 to vol100 structure, you can compare corresponding points directly or chart the two rows as separate series.
Use this comparison as a research input rather than an automatic signal. A difference between the observed and forecast surfaces can prompt further investigation into liquidity, event timing, market width, confidence, and the underlying options chain.
The forecast dataset also supports expirationDate, historical tradeDate snapshots, selected metrics, and "gridOnly". See the full Surface Forecast documentation.
A Repeatable Surface Analysis Workflow
- Start with the complete grid. Pull the current surface for all expirations and scan the structure before isolating one row.
- Choose comparable expirations. Note earnings dates and other known events that may make one expiration structurally different.
- Inspect the centre and wings. Compare representative grid points such as
vol25,vol50, andvol75rather than relying on ATM IV alone. - Add context fields. Retain
atmiv,calVol,unadjVol,earnEffect, andconfidencewhere they help explain the shape. - Check the underlying chain. Review actual contracts, bid-ask spreads, volume, open interest, and Greeks before drawing a trading conclusion.
- Use historical snapshots fairly. Retrieve only information that would have been available on the historical decision date.
- Keep comparisons consistent. Use the same delta points, metric order, and expiration-selection rule across symbols or dates.
This process keeps the surface as a structured research dataset rather than a colourful chart without a reproducible interpretation.
Common Mistakes to Avoid
- Treating the surface as a prediction: It represents implied or modelled volatility, not a guaranteed future outcome.
- Comparing raw strikes across expirations: Strike grids change. Delta-based points provide a more consistent comparison.
- Ignoring events: Earnings and other scheduled events can create local changes in the term structure.
- Ignoring liquidity: Sparse or wide markets can affect the reliability and usability of individual contracts.
- Comparing mismatched snapshots: Keep the symbol, expiration rule, delta nodes, and metrics consistent.
- Introducing look-ahead bias: Historical research should use a historical
tradeDate, not the current surface. - Reading a single point in isolation: ATM IV alone cannot describe skew, wings, or the full term structure.
Frequently Asked Questions
Can I build an implied volatility surface in Google Sheets?
Yes. SF_OPTIONS_PRO("AAPL", "surface", "", "", "", "", "gridOnly") returns a delta-based implied volatility grid by expiration directly in Google Sheets. The same function works in Microsoft Excel.
Do I need to calculate implied volatility from every option price?
No. The surface dataset returns the prepared volatility grid and its expiration-level context. You can still retrieve the underlying options chains separately when you want to inspect individual contracts.
Can I retrieve only one expiration?
Yes. Enter the expiration date as the third argument. This produces a focused view suitable for examining smile or skew across the delta grid.
Can I get a historical volatility surface?
Yes. Add tradeDate to request the point-in-time surface snapshot for a past date. Surface history is snapshot-based rather than a continuous tradeDate to endDate time series.
What is the difference between surface and surfaceForecast?
surface returns the observed implied volatility surface dataset. surfaceForecast returns modelled forward surface values. Both can return the same delta-grid layout, making corresponding points easier to compare.
What does gridOnly do?
It limits the response to the expiration date and volatility grid from vol0 through vol100. This creates a compact output for heatmaps, line charts, and direct surface comparisons.
Does this work in both Google Sheets and Excel?
Yes. SF_OPTIONS_PRO() uses the same arguments and datasets in the SheetsFinance Google Sheets and Microsoft Excel products.
Start Exploring the Volatility Surface
Start with the complete chart-ready grid:
=SF_OPTIONS_PRO("AAPL", "surface", "", "", "", "", "gridOnly")From there, isolate an expiration, add contextual metrics, retrieve a historical snapshot, or compare the observed result with surfaceForecast.
Start a 15-day free trial, explore the Surface and Surface Forecast documentation, or use the Function Generator to build the formula interactively.
For the wider options toolkit, read How to Get Options Data in Google Sheets and Excel. To add relative-volatility context, continue with How to Get IV Rank and IV Percentile. For point-in-time contract research, see How to Get Historical Options Data for Backtesting.