The earnings implied move is the size of stock move the options market is pricing for a company's next earnings report. You can pull it into Google Sheets or Microsoft Excel with one formula: =SF_OPTIONS_PRO("NVDA","ivPeriods","","","","","impErnMv") returns NVIDIA's implied earnings move as a percentage of the share price.
On its own, that number doesn't tell you much. This guide shows how to put it in context: convert it to a dollar range, compare it with the stock's average move after its last 12 reports, check how the options market priced each of those reports, and line up a whole watchlist before earnings season.
Start a 15-day free trial of SheetsFinance Options (no payment details required) to reproduce every example in this guide. The earnings datasets use
SF_OPTIONS_PRO(), which is part of Options Pro. The trial includes Options Pro with 500 options calls a day.
What You Can Build
By the end of this guide you will be able to:
- Pull the implied earnings move for any optionable US stock
- Turn it into a dollar move and an expected price range
- List the last 12 earnings dates with the actual move and the straddle priced before each one
- Compare the implied move with what the stock has actually done
- Screen a watchlist by how rich or cheap its implied move looks
- Go back to a past date and see what the market was pricing then
The Earnings Data in SF_OPTIONS_PRO()
Two SF_OPTIONS_PRO() data types cover earnings. ivPeriods holds the forward-looking numbers for the next report, and earnings holds the history of past reports.
| Data type | Metric | What it means |
|---|---|---|
ivPeriods |
impErnMv |
Implied earnings move: the percentage stock move implied by the earnings effect in the option term structure |
ivPeriods |
absAvgErnMv |
Average absolute earnings move over the last 12 reports, ignoring direction |
ivPeriods |
ernMvStdv |
Standard deviation of those 12 absolute moves: how much the reaction size varies from report to report |
ivPeriods |
lastErn |
Date of the most recent earnings report |
earnings |
ernDate, ernMv |
Each past earnings date and the stock's actual percentage move on the report, with its sign |
earnings |
ernStraPct |
The at-the-money straddle price as a percentage of the stock price before that report |
earnings |
ernEffct |
Earnings effect: the move on the report compared with a normal, non-earnings day |
All percentages come back as decimal fractions, so 0.119 means 11.9%. Format those cells as percentages.
Implied move vs straddle %. These are two different measurements, so don't mix them up. impErnMv isolates the earnings part of implied volatility, after the normal day-to-day volatility is taken out. ernStraPct is the price of the nearest at-the-money straddle, which covers every day to that expiry, not just the report. Compare the implied move with the average past move, and each straddle with the move that followed it.
Many websites quote an "expected move" that is simply the straddle price divided by the stock price. That figure includes the ordinary days to expiry, so it won't match impErnMv exactly.
The Syntax
Both data types use the standard SF_OPTIONS_PRO() signature, with the expiration and strike arguments left blank because earnings data belongs to the underlying stock:
=SF_OPTIONS_PRO(symbol, "ivPeriods", "", "", tradeDate, endDate, metrics, options)=SF_OPTIONS_PRO(symbol, "earnings", "", "", tradeDate, "", metrics, options)symbolis one underlying ticker, such as"NVDA", or a cell holding it.tradeDateis optional. Leave it blank for the latest data, or give a past date to see the data as it stood that day.endDateturns anivPeriodsrequest into a daily time series fromtradeDatetoendDate.metricsis blank or"all"for every column, or a chain such as"ernDate&ernMv&ernStraPct".optionsaccepts"NH"(no header row) and"-"(reverse the order), chained with&.
The formulas are the same in Google Sheets and Excel.
1. Pull the Implied Earnings Move
Put this formula in A1:
=SF_OPTIONS_PRO("NVDA","ivPeriods","","","","","tradeDate&lastErn&impErnMv&absAvgErnMv&ernMvStdv")It returns a header row and one row of data:

On 13 November 2026, four days before NVIDIA's 17 November report, the options market was pricing an 11.9% move. NVIDIA's average move over its last 12 reports was 5.6%, with a standard deviation of 4.4%. The market was pricing a reaction roughly twice the size of a typical one. That snapshot came the day after NVIDIA announced that its CEO, Jensen Huang, had resigned, which is a reminder that an unusual implied move often has a reason you can find in the news.
To get the implied move alone in one cell, ask for one metric and drop the header:
=SF_OPTIONS_PRO("NVDA","ivPeriods","","","","","impErnMv","NH")2. See the Last 12 Earnings Moves
The earnings data type lists the previous 12 reports, newest first:
=SF_OPTIONS_PRO("NVDA","earnings","","","","","ernDate&ernMv&ernStraPct")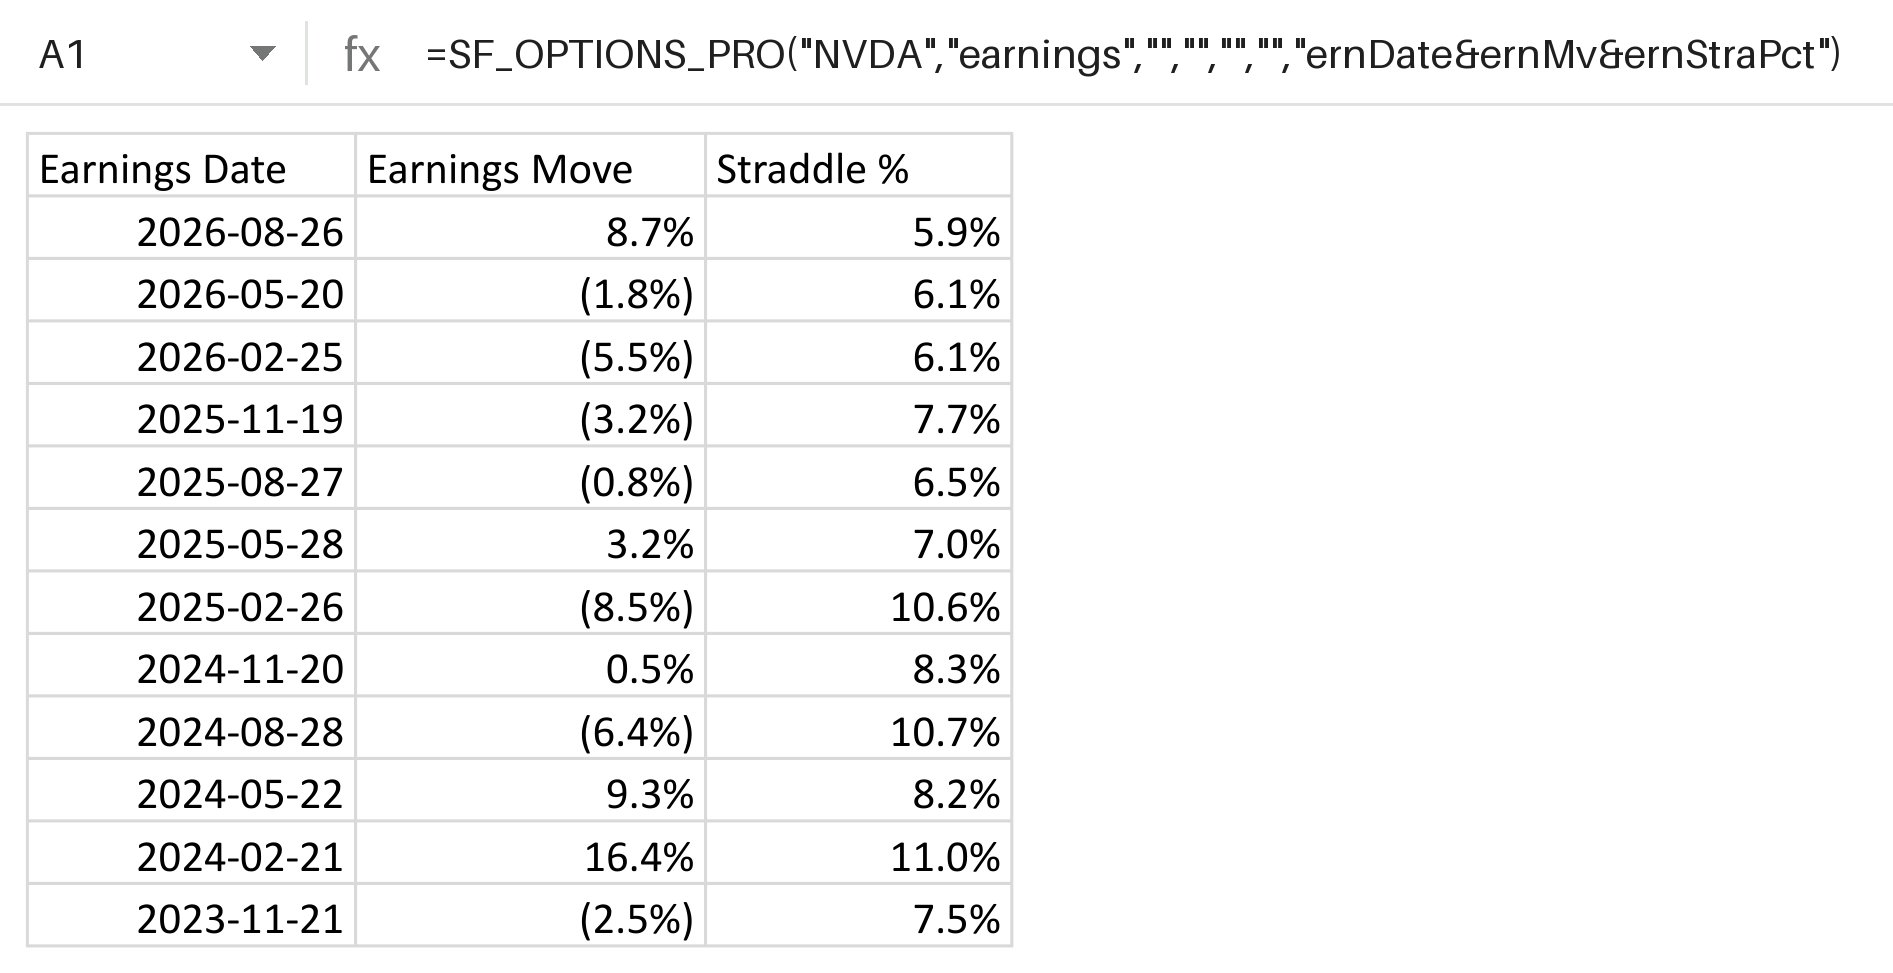
ernMv keeps its sign, so (5.5%) was a fall of 5.5% after the February 2026 report. ernStraPct is what an at-the-money straddle cost before each report. In August 2026 the straddle priced 5.9% and the stock moved 8.7%; in May 2026 it priced 6.1% and the stock moved 1.8%.
Twelve reports is about three years for a company that reports quarterly. The list is always the 12 reports before the trade date, so it moves forward one report each quarter.
3. Build an Implied Move Calculator
A percentage is easier to act on as a price range. Set up this sheet with the ticker in B1:
| Cell | Label | Formula |
|---|---|---|
| B3 | Stock price | =SF($B$1) |
| B4 | Next earnings date | =SF($B$1,"quote","earningsAnnouncement") |
| B5 | Implied earnings move | =SF_OPTIONS_PRO($B$1,"ivPeriods","","","","","impErnMv","NH") |
| B6 | Implied move in dollars | =B3*B5 |
| B7 | Expected range, low | =B3-B6 |
| B8 | Expected range, high | =B3+B6 |
| B9 | Average absolute move, past events | =SF_OPTIONS_PRO($B$1,"ivPeriods","","","","","absAvgErnMv","NH") |
| B10 | Implied move vs average | =B5/B9 |
| B11 | Past 12 moves bigger than today's implied | =SUMPRODUCT(--(ABS(SF_OPTIONS_PRO($B$1,"earnings","","","","","ernMv","NH"))>B5)) |
Format B3 and B6:B8 as currency, B5 and B9 as percentages, and B10 as a number with one decimal.
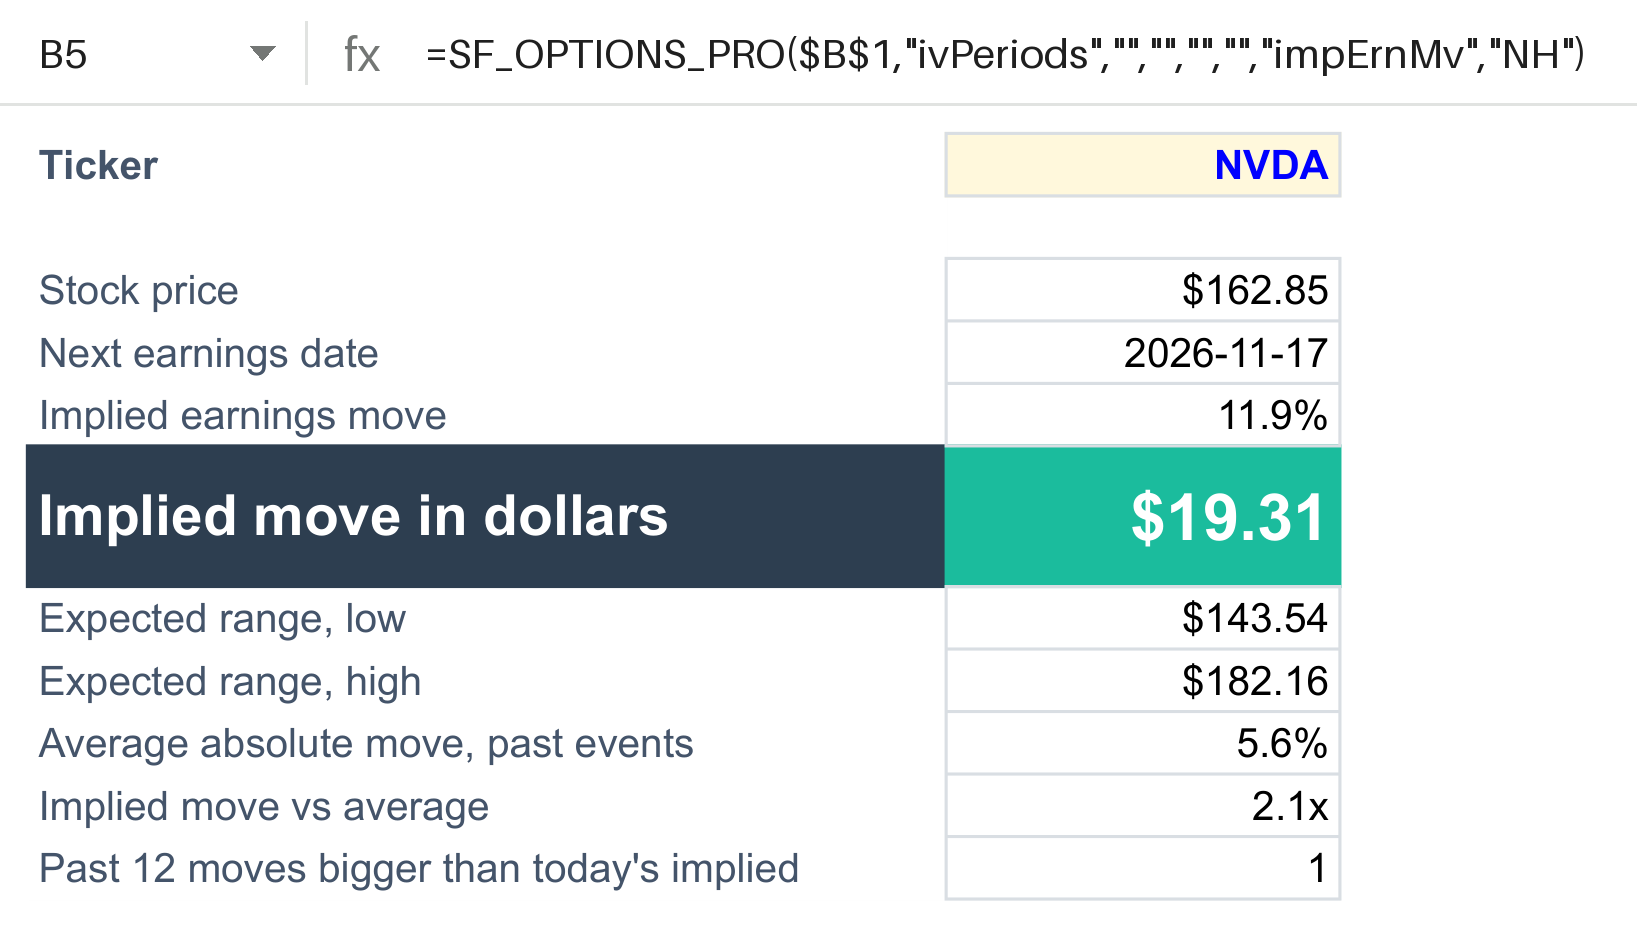
With NVIDIA at $162.85, an 11.9% implied move is about $19.31 either way, so the market was pricing a range of roughly $143.54 to $182.16. B11 shows that only one of the last 12 reports (February 2024, 16.4%) moved more than today's implied move.
Treat the range as a guide to the size of move being priced, not a limit. The stock can and sometimes does move further, and the implied move says nothing about direction.
The next earnings date in B4 comes from the quote data. Until a company confirms its date, it can be an estimate, so check it against the company's investor relations page before you rely on it.
4. Compare Implied Moves Across a Watchlist
Every formula takes a cell reference, so a watchlist is the same formulas filled down. Put tickers in A2:A9 and headers in row 1, then enter:
- B2:
=SF($A2,"quote","earningsAnnouncement") - C2:
=SF_OPTIONS_PRO($A2,"ivPeriods","","","","","impErnMv","NH") - D2:
=SF_OPTIONS_PRO($A2,"ivPeriods","","","","","absAvgErnMv","NH") - E2:
=C2/D2
Fill B2:E2 down to row 9. Format C:D as percentages and E as a multiple (0.0"x").
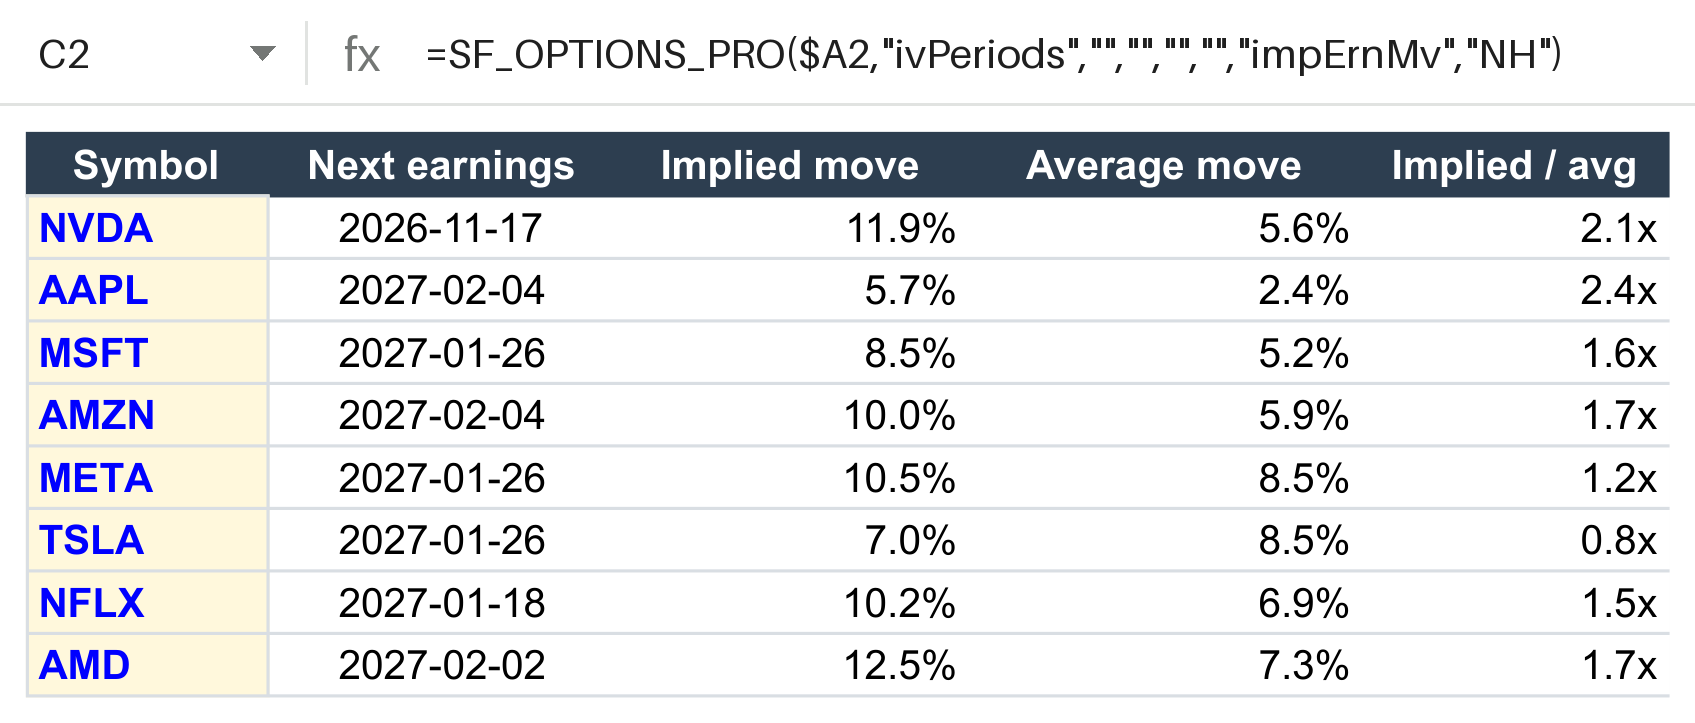
Column E shows how the move being priced compares with each stock's own history. Above 1x, the market expects a bigger reaction than usual; below 1x, a smaller one. In this snapshot NVIDIA and Apple were both priced at over twice their average move, while Tesla's implied move (7.0%) was below its 8.5% average.
The implied move is calculated for each stock's next report, however far away it is. NVIDIA was reporting within days; most of the others were two to three months out. A far-off estimate rests on longer-dated options and will change as the date gets closer, so compare stocks with reports in the same window.
5. Chart Past Straddles Against Actual Moves
To judge whether options have tended to overprice or underprice a stock's earnings, compare each past straddle with the move that followed. Start with the history, oldest first, in A1:
=SF_OPTIONS_PRO("NVDA","earnings","","","","","ernDate&ernMv&ernStraPct","-")The output has a header row in row 1 and the 12 reports in A2:C13. Build a chart table beside it, with headers in E1:G1 (Earnings date, Straddle % before, Actual move), then:
- E2:
=A2 - F2:
=C2 - G2:
=ABS(B2)
Fill E2:G2 down to row 13. ABS turns falls into positive moves, so each actual move is on the same footing as its straddle.
To chart it, select E1:G13 and choose Insert → Chart → Column chart. Use column E as the X-axis and F and G as the two series, and format the Y-axis as a percentage. If Google Sheets treats the first date as a series name, turn on Use row 1 as headers and Use column E as labels in the chart editor.
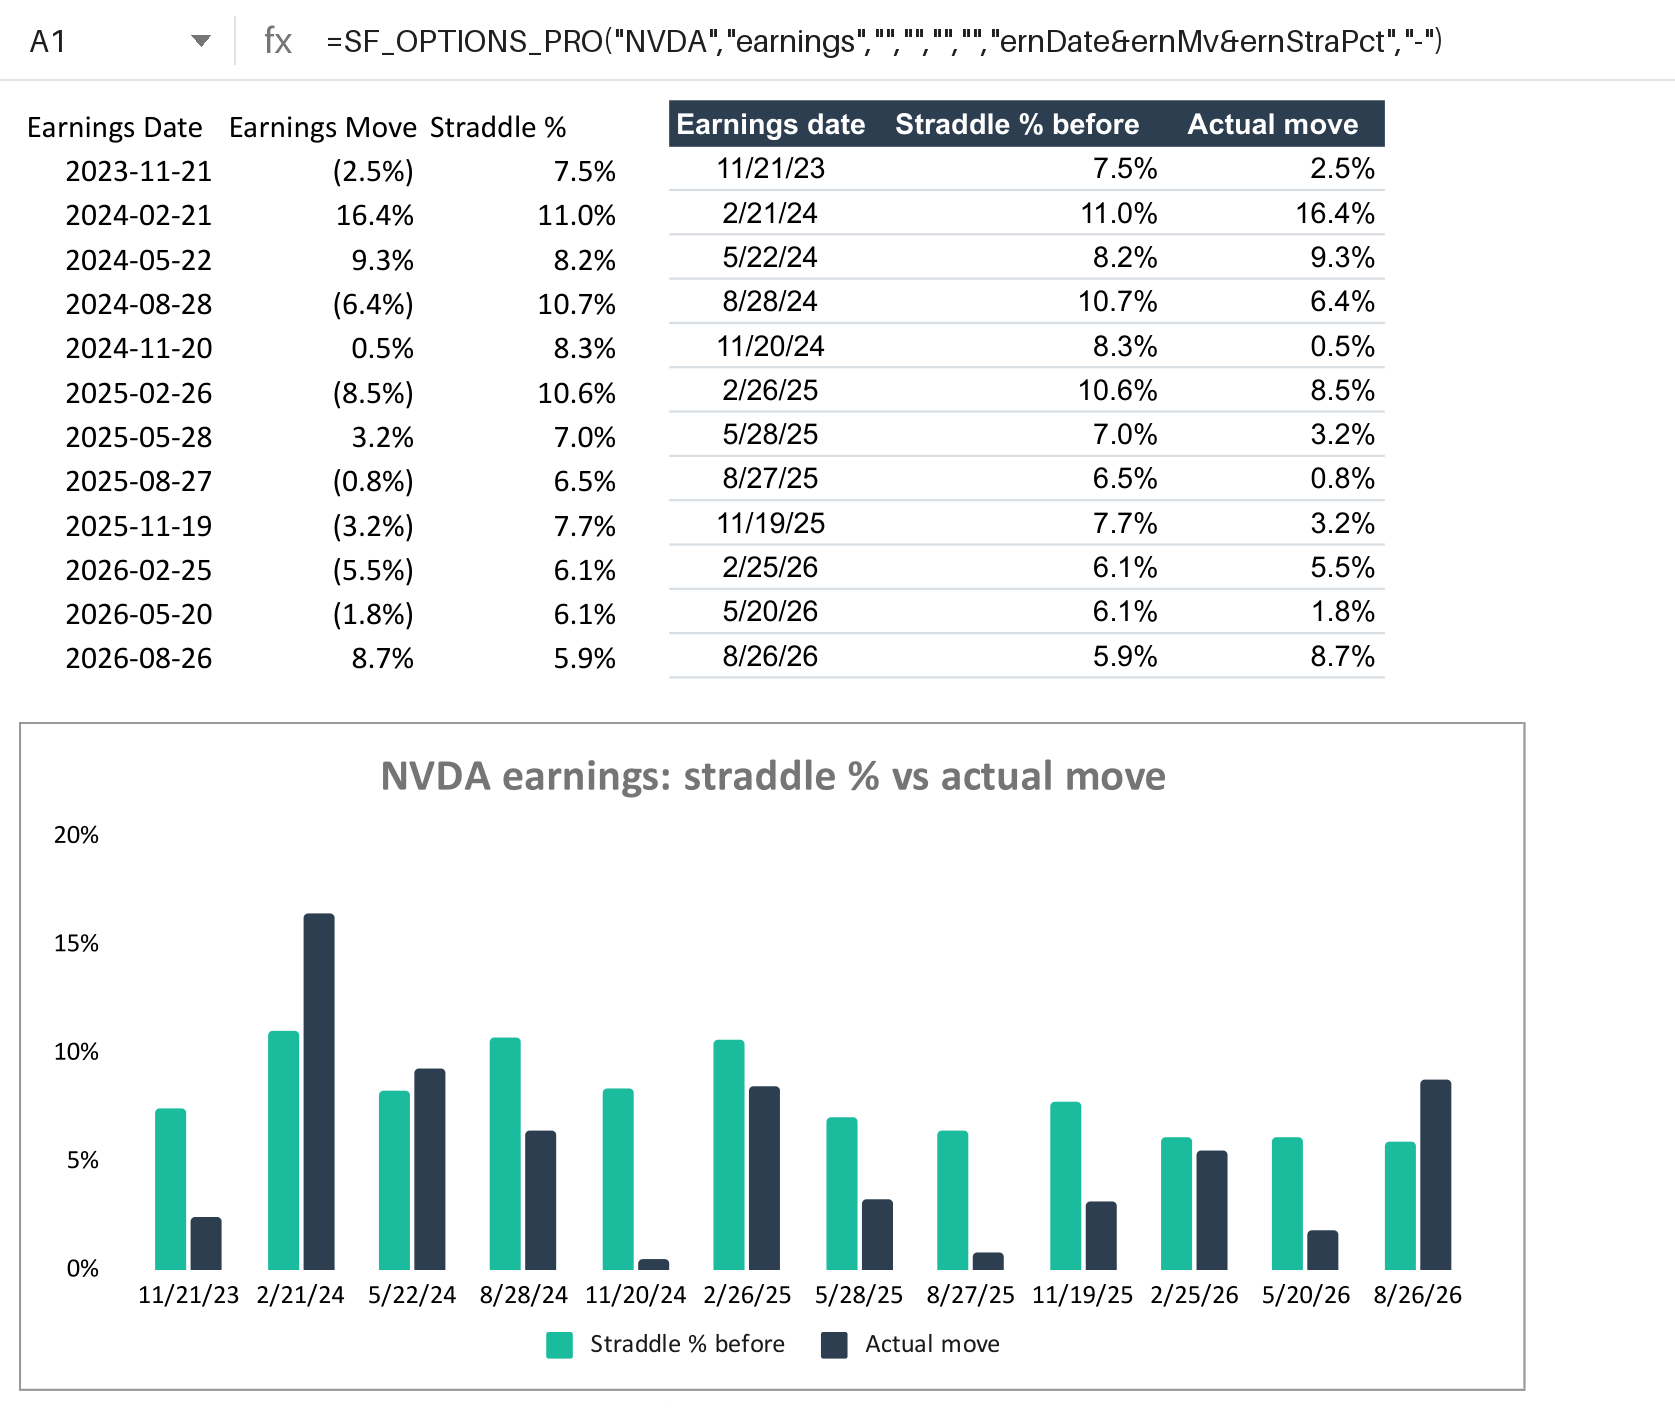
For NVIDIA, the actual move beat the straddle 3 times in 12 reports: February 2024, May 2024 and August 2026. The other nine times the straddle priced a bigger move than the stock delivered. Count it in a cell with:
=SUMPRODUCT(--(G2:G13>F2:F13))A straddle that usually prices more than the stock delivers is one reason options sellers watch earnings. Twelve reports is still a small sample, and the straddle covers more than the report day, so read this as context rather than a rule.
6. Look Back at What the Market Was Pricing
Add a tradeDate to see the data as it stood on a past day. This returns NVIDIA's implied move on 26 August 2026, the day of its last report, before the results came out after the close:
=SF_OPTIONS_PRO("NVDA","ivPeriods","","","2026-08-26","","tradeDate&lastErn&impErnMv")It returns 7.6%. The stock moved 8.7%, a little more than priced.
Add an endDate to get a daily series, which shows how the implied move built up into a report:
=SF_OPTIONS_PRO("NVDA","ivPeriods","","","2026-07-01","2026-08-26","tradeDate&impErnMv","-")For NVIDIA it rose from 4.9% on 1 July to 7.6% on the day of the report, oldest first because of "-". Chart tradeDate against impErnMv as a line to see the build-up.
The earnings history works the same way. =SF_OPTIONS_PRO("NVDA","earnings","","","2016-01-04","","ernDate&ernMv&ernStraPct") lists the 12 reports before January 2016, back to February 2013. That lets you test a rule, such as selling straddles only when the implied move is well above the average, across many years of reports.
Common Mistakes to Avoid
- Comparing the implied move with a straddle %:
impErnMvisolates the earnings effect, whileernStraPctis a straddle price that covers every day to expiry. Compare the implied move withabsAvgErnMv, and each straddle with the move after it. - Reading percentages as whole numbers:
0.119is 11.9%. Format the cells as percentages. - Forgetting the sign:
ernMvis negative when the stock fell. UseABS()before comparing moves with a straddle or an implied move. - Treating the expected range as a limit: Stocks regularly move further than the implied move. The range is the market's estimate of size, not a ceiling or floor.
- Comparing reports months apart: An implied move for a report next week and one for a report in three months aren't directly comparable.
- Trusting an estimated earnings date: Confirm the next report date before you act on it.
- Passing a range of tickers:
ivPeriodsandearningstake one symbol per formula. Fill the formula down instead. OnlyivRankaccepts a range of symbols. - Expecting data for every stock: The earnings datasets cover optionable US underlyings. A stock with no listed options, or no report history, returns nothing.
Frequently Asked Questions
What is an earnings implied move?
It is the size of stock move the options market is pricing for a company's next earnings report, expressed as a percentage of the share price. It comes from the extra implied volatility in the expirations that include the report date.
How do I calculate the expected move for earnings in Google Sheets?
Pull the implied move with =SF_OPTIONS_PRO("AAPL","ivPeriods","","","","","impErnMv","NH"), then multiply it by the share price from =SF("AAPL"). Add and subtract the result from the price for the expected range.
Does this work in Microsoft Excel?
Yes. SF_OPTIONS_PRO() uses the same syntax in Excel and Google Sheets, and the calculator, watchlist and chart formulas in this guide work in both.
How is the implied move different from the straddle price?
The straddle price is what it costs to buy an at-the-money call and put, as a percentage of the stock price. It pays for every day to expiry. The implied move takes the normal day-to-day volatility out and keeps only the earnings part, so it is a cleaner estimate of the report itself.
Can I see past implied moves?
Yes. Add a tradeDate to the ivPeriods formula for a single past day, or a tradeDate and an endDate for a daily series. The earnings data type also takes a tradeDate and returns the 12 reports before it.
Which plan do I need?
The earnings datasets use SF_OPTIONS_PRO(), which is part of Options Pro. The 15-day Options trial includes Options Pro with 500 options calls a day.
Track Earnings Season in Your Spreadsheet
Start with the calculator for one stock you follow. Then add the watchlist for the companies reporting in the next few weeks, and keep the straddle-versus-actual chart beside it to see how each stock has reacted before. Every formula takes a cell reference, so one sheet works for any optionable US stock.
Read the IV Periods, IV Periods Time-series and Options Earnings references, or start a 15-day Options trial to build it in Google Sheets or Excel. To see whether implied volatility is high or low against its own history, continue with How to Get IV Rank and IV Percentile in Google Sheets and Excel. For the full volatility picture across expirations, see How to Build an Options Implied Volatility Surface in Google Sheets and Excel.