How to Get Institutional Ownership Data in Google Sheets and Excel
You can pull institutional ownership data into Google Sheets or Microsoft Excel with one formula. =SF("NVDA","instHolders") lists the institutions that hold a stock, with the shares each one reported and how that position changed. =SF("NVDA","ownership") returns the share of the company held by institutions, insiders and undisclosed holders.
Together they answer the questions most investors ask about institutional ownership: who owns this stock, who bought and sold last quarter, how concentrated the holder base is, and whether the institutional share is rising or falling. You get the answers as spreadsheet data you can sort, chart and compare, instead of copying tables from a website.
Start a 15-day free trial of SheetsFinance Market Data (no payment details required) to reproduce every example in this guide. Institutional holders and the ownership breakdown are part of the Analyst plan. The trial includes Analyst-level feature access with a limit of 1,000 data calls per day.
What Institutional Ownership Data Returns
SheetsFinance has two data types for institutional ownership. One lists the holders, the other gives the totals.
| Data type | Metrics | Use it to |
|---|---|---|
instHolders |
holder, shares, dateReported, change |
See which institutions hold a stock for a reporting quarter and how much each one bought or sold |
ownership |
date, institutionsPercent, insidersPercent, undisclosedPercent |
Compare how much of each company institutions and insiders own, and track it through time |
Institutional holdings come from quarterly filings, so instHolders is organised by reporting quarter. ownership has its own dated history, which you read with SF_TIMESERIES(). Ownership percentages are decimal fractions, so 0.65 means 65%. Format those cells as percentages.
The Syntax
The holders list takes a symbol, the metrics you want, an optional date and formatting options:
=SF(symbol, "instHolders", metrics, date, options)metricsis blank or"all"for every column, or a chain such as"holder&shares&change".datepicks the reporting quarter. Leave it blank for the latest quarter. If the date you give is not a reporting date, you get the nearest earlier one, so quarter-end dates such as"2026-06-30"work best.optionsaccepts"NH"(no header rows),"-"(reverse the order) and"limit=X"(return only the first X holders), chained with&.
The ownership totals use SF() for the latest reading and SF_TIMESERIES() for history:
=SF(symbol, "ownership", metric)=SF_TIMESERIES(symbol, startDate, endDate, "ownership", metrics, options)Both functions take one symbol per formula and use the same syntax in Google Sheets and Excel.
1. List the Institutions That Hold a Stock
Put this formula in A1 to list the first 15 holders of NVIDIA for the quarter ending 30 June 2026:
=SF("NVDA","instHolders","all","2026-06-30","limit=15")The output starts with a title row (Institutional Holders for NVDA as of 2026-06-30) in A1 and a header row in A2. Each holder then gets one row from A3, with the holder name, shares held, date reported and the change in shares.
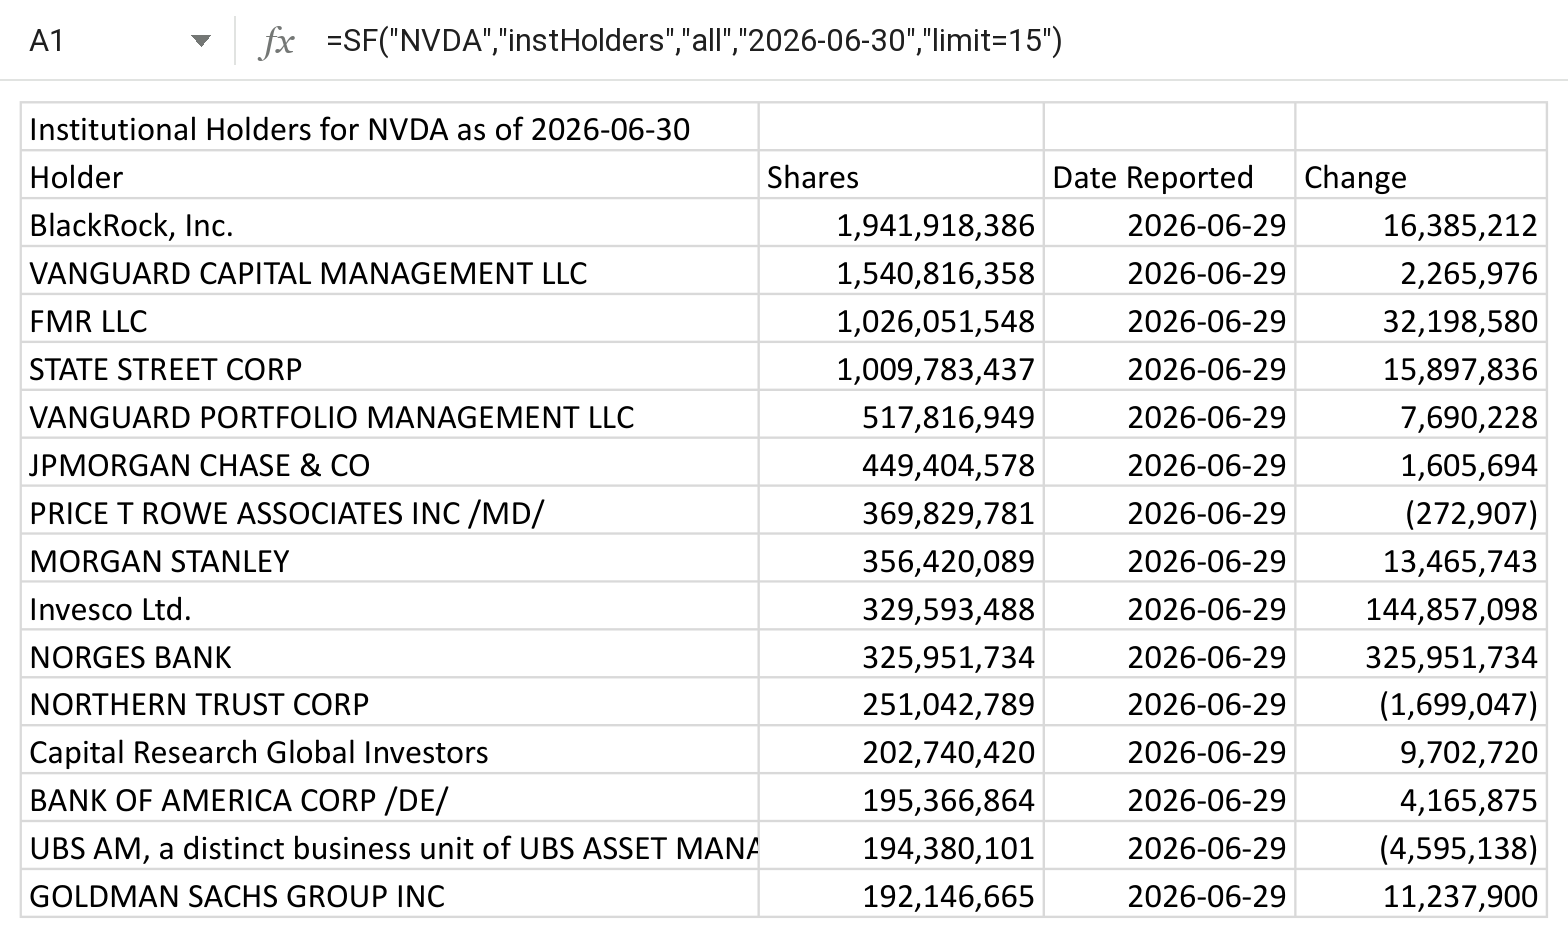
A large company can have thousands of institutional holders, so limit= keeps the output small. Drop it when you want the complete list, for example to sort or search it.
2. Find the Reporting Quarters Available
To see which quarters you can request, use "dateOptions" as the metric:
=SF("NVDA","instHolders","dateOptions")It returns one date per row, newest first, with no header row. NVIDIA's list goes back to 2015. With the formula in A1, A2 holds 2026-06-30, so =SF("NVDA","instHolders","all",A2) loads that quarter. Point the date argument at a different cell to switch quarters without editing the formula.
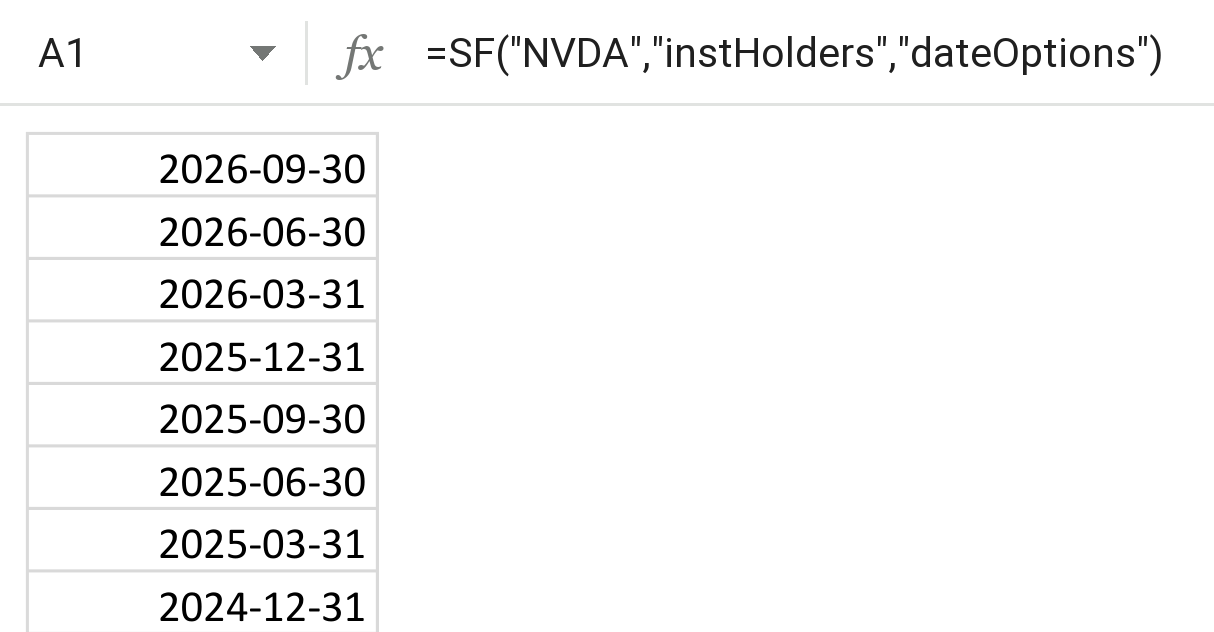
Use the last complete quarter. Institutional managers file their holdings up to 45 days after each quarter ends. For a few weeks after a quarter closes, the newest date only includes the managers who have filed early. That is why the examples here use 30 June 2026 rather than leaving the date blank.
3. Rank the Biggest Buyers and Sellers
The change column shows how many shares each holder added or removed. Sort the full holder list by that column to see who bought and who sold during the quarter.
Set up two inputs: the ticker in B1 (NVDA) and the quarter in B2 (2026-06-30). In Google Sheets, put the top ten buyers in A6:
=SORTN(SF($B$1,"instHolders","holder&shares&change",$B$2,"NH"),10,0,3,FALSE)and the top ten sellers in A19:
=SORTN(SF($B$1,"instHolders","holder&shares&change",$B$2,"NH"),10,0,3,TRUE)"NH" removes the title and header rows so only holder rows are sorted. The 3 refers to the third column (change). FALSE sorts it from largest to smallest and TRUE from smallest to largest.
Excel doesn't have SORTN, so combine SORT with TAKE:
=TAKE(SORT(SF($B$1,"instHolders","holder&shares&change",$B$2,"NH"),3,-1),10)For sellers, change -1 to 1.
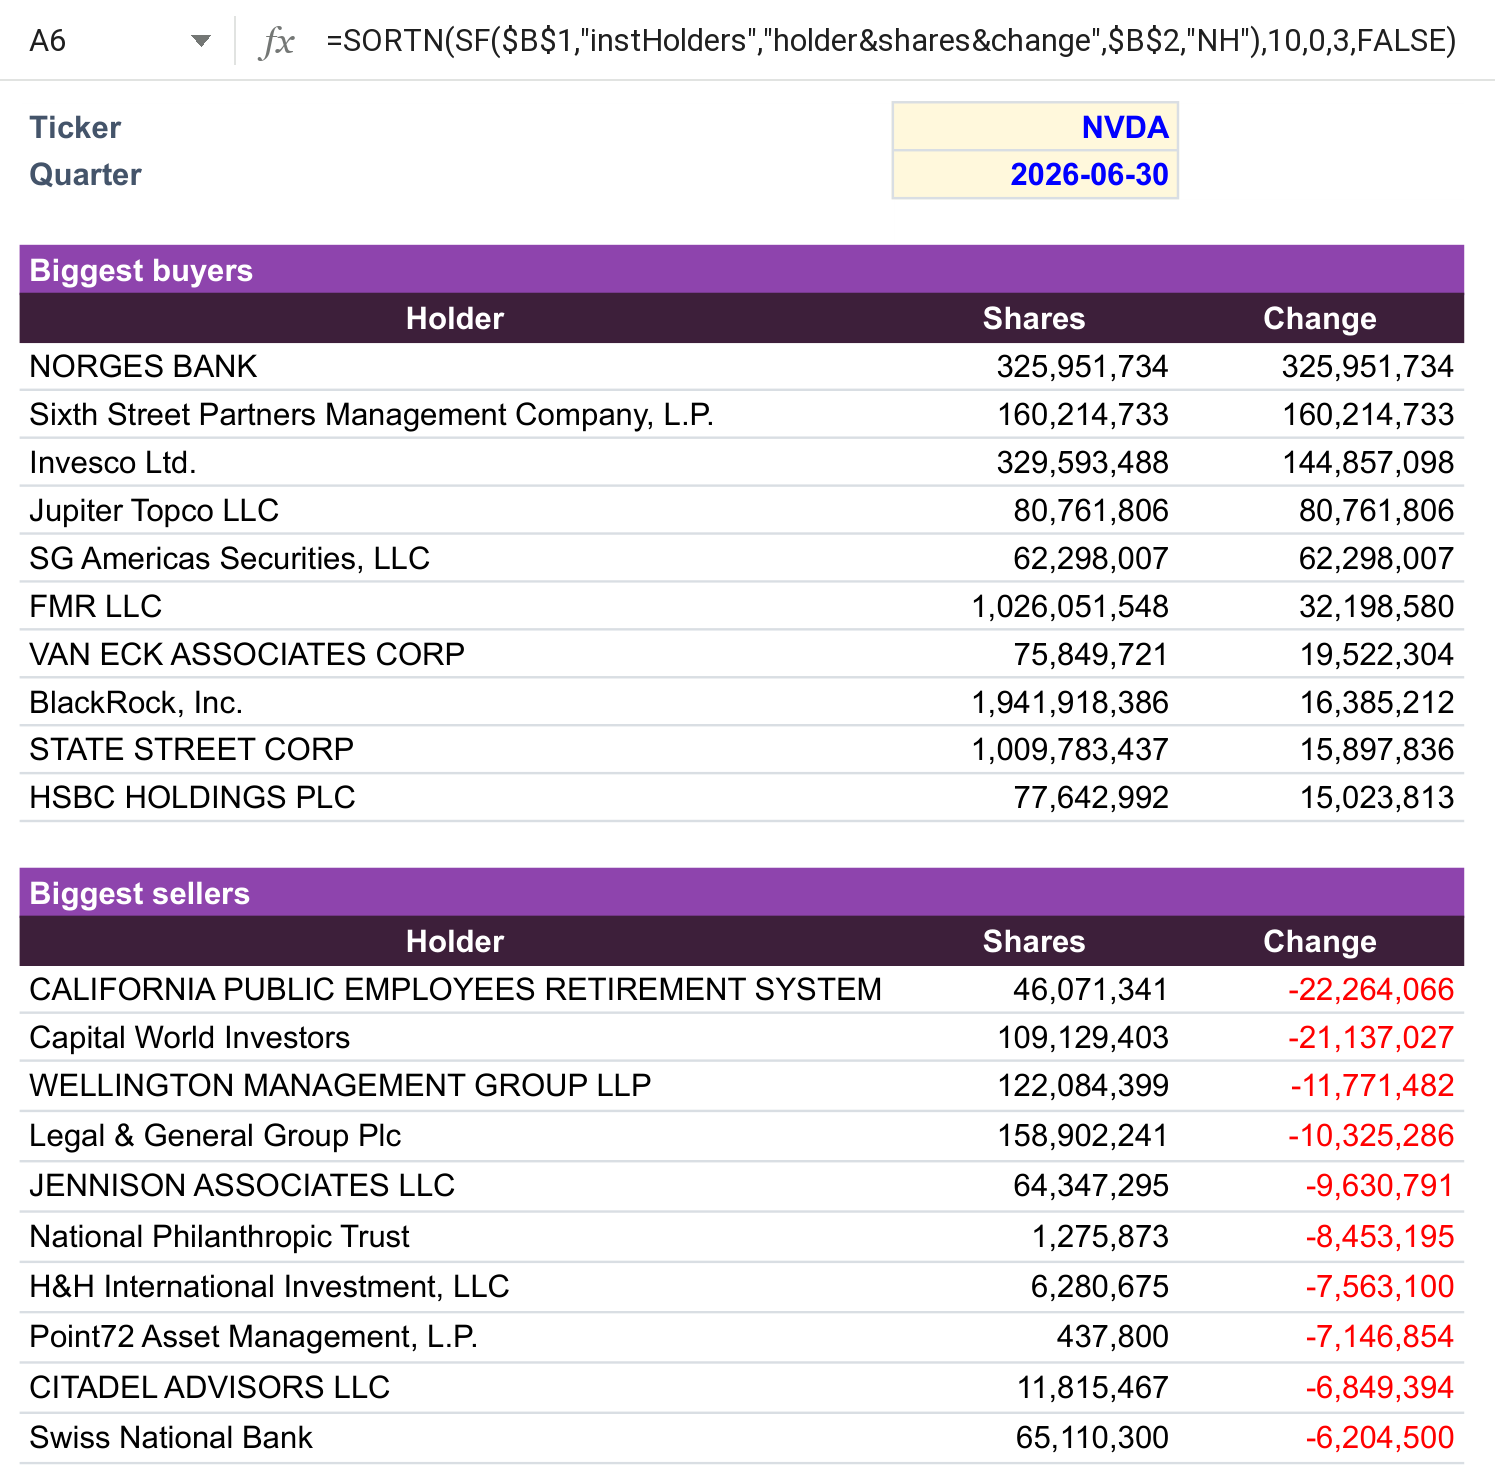
When change equals shares, the holder had no position in the previous quarter's data. That can be a genuinely new position, or a manager whose earlier filing is missing, so check the previous quarter before reading it as a fresh purchase.
A large change from a big index manager often follows index flows rather than a view on the company. Look further down the list too: active managers starting or exiting positions tell you more about sentiment.
4. Measure How Concentrated the Holder Base Is
Ownership concentration shows how much of a company a few large institutions control. With the same inputs in B1 and B2:
| Cell | Label | Formula |
|---|---|---|
| B4 | Shares outstanding | =SF($B$1,"quote","sharesOutstanding") |
| B5 | Shares held by the top 10 holders | =SUM(SORTN(SF($B$1,"instHolders","shares",$B$2,"NH"),10,0,1,FALSE)) |
| B6 | Top 10 holders' stake | =B5/B4 |
| B7 | All institutions (ownership) | =SF($B$1,"ownership","institutionsPercent") |
In Excel, write B5 as =SUM(TAKE(SORT(SF($B$1,"instHolders","shares",$B$2,"NH"),1,-1),10)).
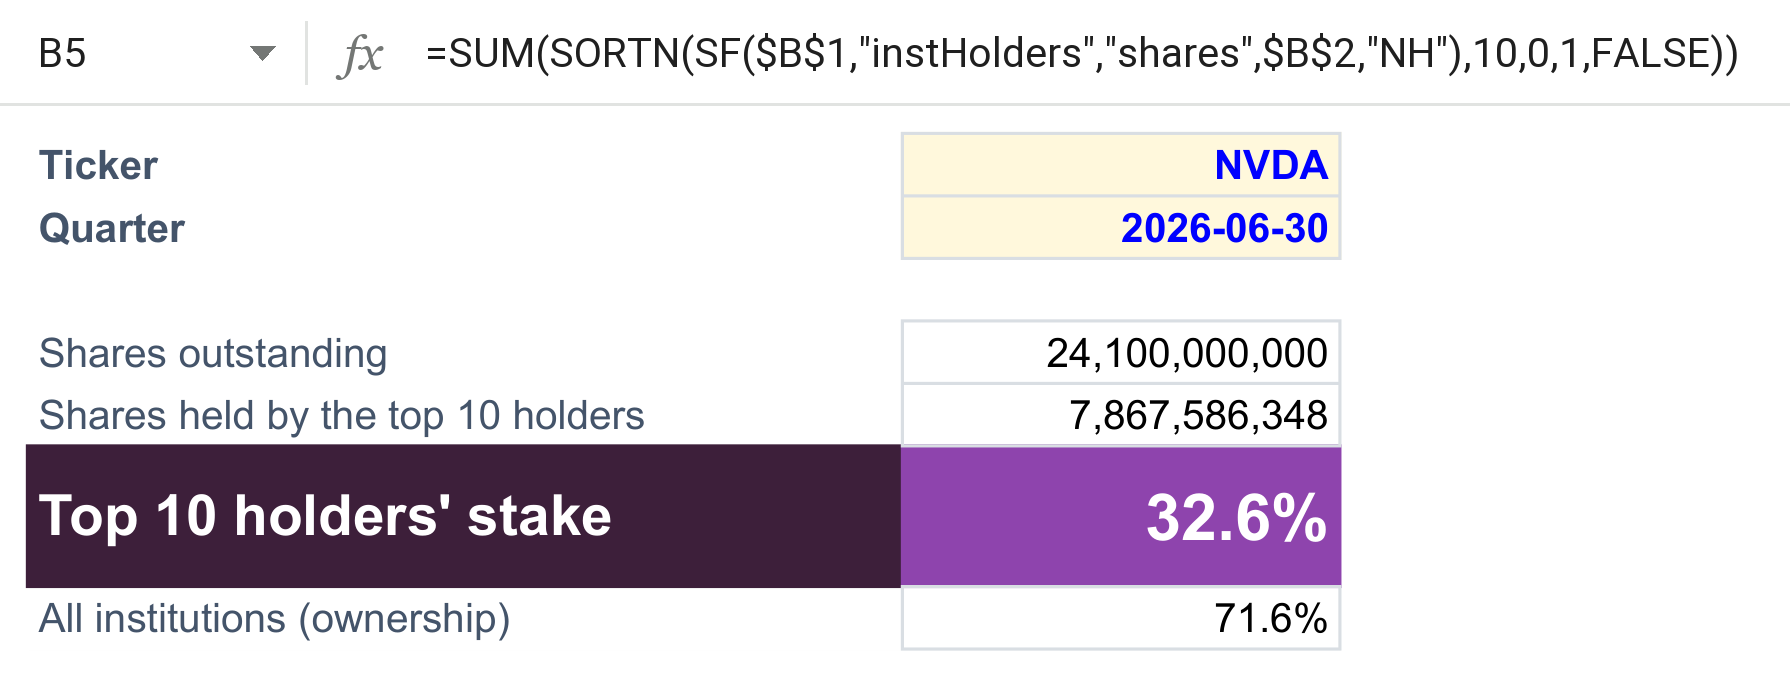
Shares outstanding is the current figure, while holdings are as of the quarter end. Treat the result as an approximation, especially after a large buyback or share issue.
5. Compare Ownership Across a Watchlist
ownership returns one value per cell when you ask for a single metric, so a watchlist is one formula filled across and down. Put tickers in A2:A9 and headers in row 1, then enter:
- B2:
=SF($A2,"ownership","date") - C2:
=SF($A2,"ownership","institutionsPercent") - D2:
=SF($A2,"ownership","insidersPercent") - E2:
=SF($A2,"ownership","undisclosedPercent")
Fill B2:E2 down to row 9 and format C:E as percentages.
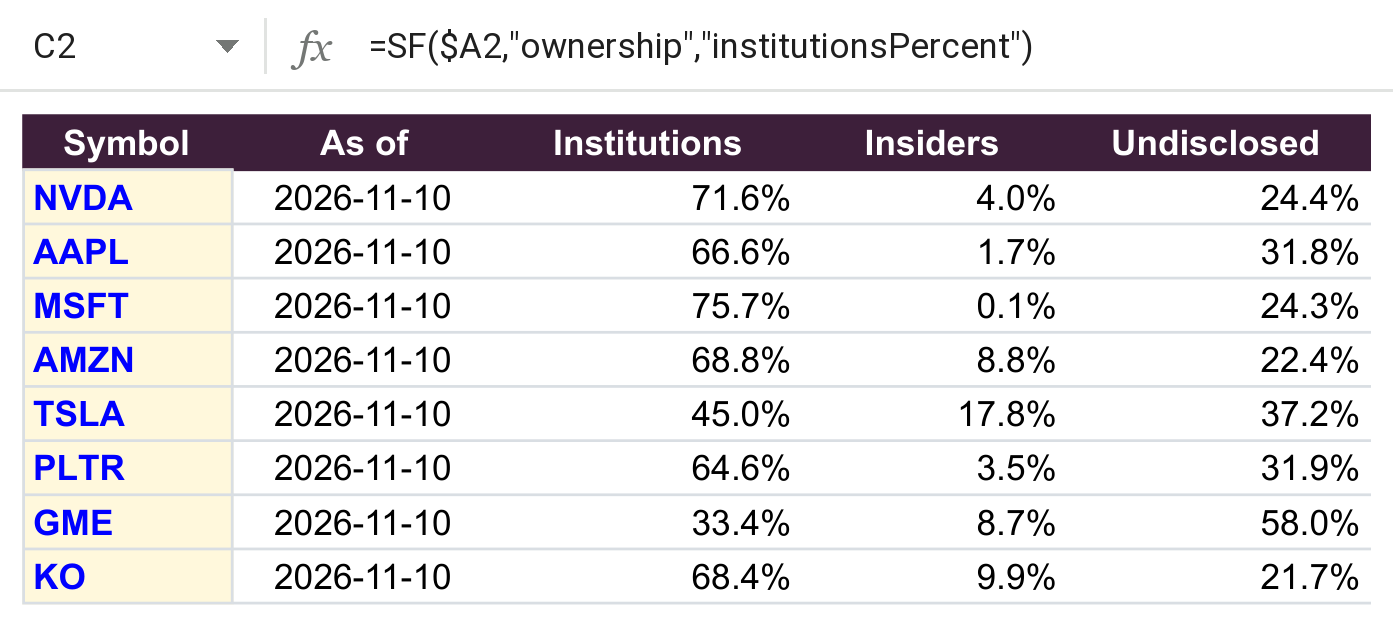
Large index constituents usually show a high institutional share. Founder-led companies show a higher insider share, and heavily traded retail names tend to have a lower institutional share. Keep the date column visible so you can tell how recent each reading is.
6. Track Institutional Ownership Over Time
Use SF_TIMESERIES() with the "ownership" period for a dated history. This formula returns twelve months of NVIDIA observations, oldest first because of "-":
=SF_TIMESERIES("NVDA","2025-06-01","2026-05-31","ownership","date&institutionsPercent&insidersPercent","-")To chart it, select the date column and the institutionsPercent column (excluding the title row), then choose Insert → Chart → Line chart. Use the dates as the X-axis and format the Y-axis as a percentage. Institutional ownership moves a few points at a time, so set the axis minimum to around 60% (in Google Sheets: Customize → Vertical axis; in Excel: Format Axis → Bounds) or the line looks flat. If Google Sheets turns the first date into a series label, untick Use row 1 as headers and set the ranges by hand.
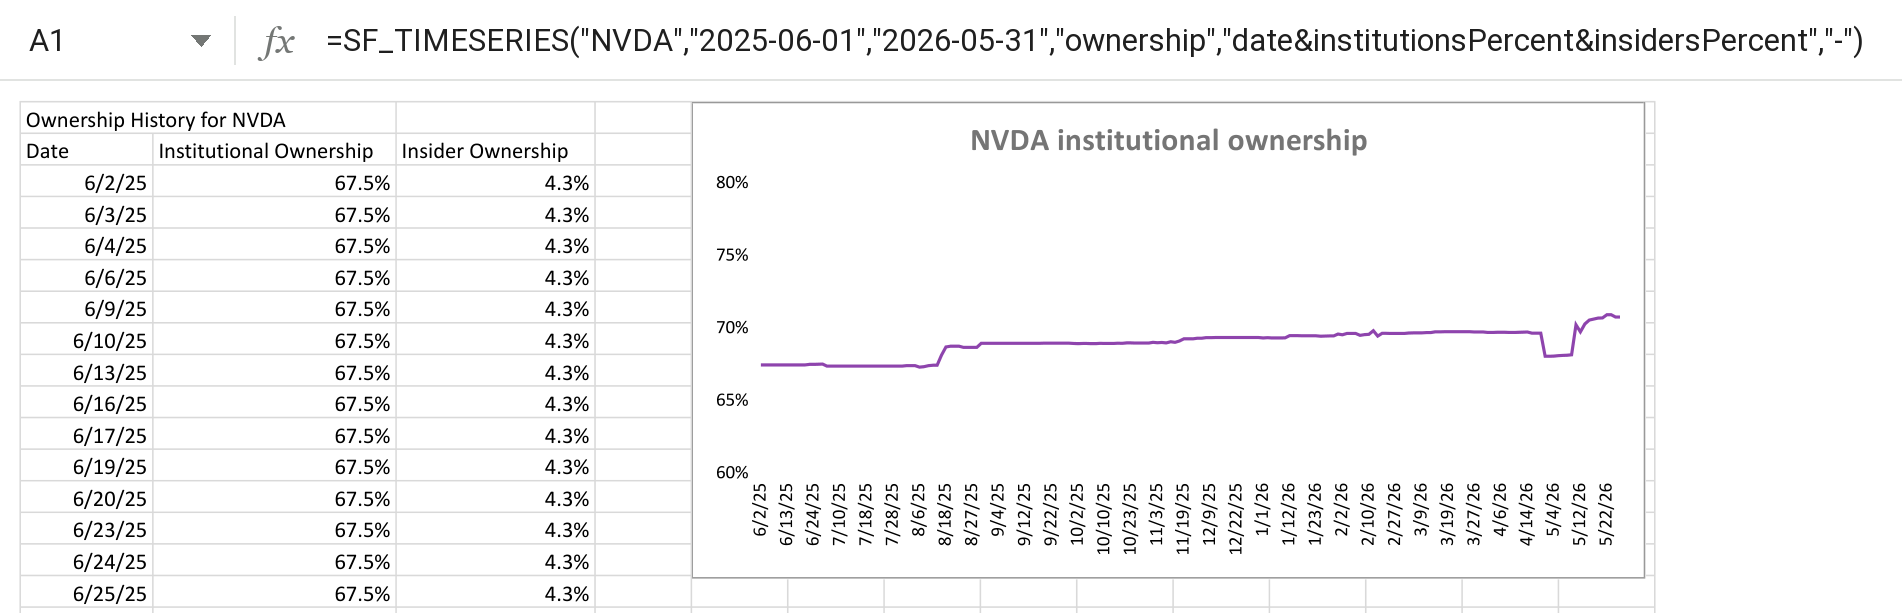
Leave out both dates to return the full available history. End dates in the future are rejected.
Common Mistakes to Avoid
- Using the newest quarter too early: For about six weeks after a quarter ends, the latest holder list is incomplete. Use the previous quarter for comparisons.
- Sorting with the headers attached: Add
"NH"before sorting withSORTorSORTN, or the title and header rows end up among the holders. - Trusting a single-day spike: The ownership history occasionally has a one-day reading far from its neighbours. Compare it with the days either side before drawing conclusions.
- Reading percentages as whole numbers:
institutionsPercentof0.68means 68%. - Assuming
limit=returns the largest holders: It keeps the first rows in the order returned. Sort the full list when you need the top holders by shares or change. - Passing a range of tickers: Both data types take one symbol per formula. Fill the formula down instead.
- Expecting global coverage: Institutional holders data covers selected major markets, not every listing.
- Treating ownership as a signal on its own: High institutional ownership shows who holds a stock, not whether it is a good investment. Read it alongside fundamentals, valuation and positioning.
Frequently Asked Questions
How do I see who owns a stock in Google Sheets?
Use =SF("AAPL","instHolders") for the latest quarter's institutional holders, or add a quarter-end date such as "2026-06-30" as the fourth argument for an earlier quarter.
How do I get the institutional ownership percentage?
=SF("AAPL","ownership","institutionsPercent") returns the share of the company held by institutions as a decimal. Format the cell as a percentage.
Does this work in Microsoft Excel?
Yes. instHolders and ownership use the same syntax in Excel and Google Sheets. Only the sorting functions differ: Google Sheets has SORTN, and in Excel you use TAKE(SORT(...)).
Can I get historical institutional ownership?
Yes. The holders list goes back by reporting quarter (use "dateOptions" to see which quarters are available), and SF_TIMESERIES() with the "ownership" period returns the dated history of the ownership percentages.
What does a high institutional ownership percentage mean?
Most of the shares are held by funds, pension plans, banks and other managers rather than individuals or insiders. That often comes with deeper liquidity and closer analyst coverage, but a few large holders can also move the stock when they rebalance.
Why can institutional ownership be more than 100%?
Shares lent to short sellers can be counted by both the lender and the buyer, and filings from different dates can overlap. A reading above 100% usually reflects heavy short selling or stale share counts rather than an error in your sheet.
Build Your Ownership Tracker
Start with the holder list for one stock. Then add the buyers and sellers ranking for the last complete quarter, and finish with the ownership watchlist and history chart for the companies you follow. Every formula accepts cell references, so one sheet works for any supported stock.
Read the Institutional Holders and Ownership function references, or start a 15-day Market Data trial to build the tracker in Google Sheets or Excel. To see how short sellers are positioned in the same stocks, continue with How to Get Short Interest Data in Google Sheets and Excel. For trades by executives and directors, see Accessing Real-time Insider Trading Data in Google Sheets.