How to Build a Stock Screener in Google Sheets and Excel
You can build a live stock screener in Google Sheets or Microsoft Excel with one SF_SCREEN() formula. Instead of maintaining a fixed ticker list, you define the market and financial conditions a company must pass, choose the fields you want returned, and let the result spill into a filterable spreadsheet table.
SheetsFinance can screen a database of more than 80,000 financial assets by exchange, country, sector, industry, market capitalisation, price, volume, dividends, and dozens of trailing-twelve-month financial ratios. Monetary values are normalised to US dollars by default, so a cross-market threshold compares like with like instead of treating a billion dollars, pounds, yen, or pence as though they were the same amount. You can change that comparison currency with the screenCurrency= option.
Start a 15-day free trial of SheetsFinance Market Data (no payment details required) to reproduce the screens in this guide. The trial includes Analyst-level feature access, subject to its daily data-call limit.
What You Can Build
By the end of this guide, you will be able to:
- Screen stocks across selected exchanges, countries, sectors, or industries
- Compare monetary filters, ordering, and output in one unified screener currency
- Separate the conditions that select companies from the fields shown in the output
- Rank and limit the result before it reaches the spreadsheet
- Build quality, dividend, and valuation screens with TTM financial metrics
- Format percentages and large values consistently
- Turn a ranked shortlist into a chart without copying data manually
The SF_SCREEN() Function
The stock screener uses three arguments:
=SF_SCREEN(filters, metrics, options)| Argument | What it controls | Example |
|---|---|---|
filters |
Which assets pass the screen | marketCap>1000000000&exchange=NYSE,NASDAQ |
metrics |
Which columns appear in the result | symbol§or&marketCap&price |
options |
How the result is ordered, limited, converted, or formatted | screenCurrency=AUD&ob=marketCap&limit=25 |
Each filter combines a metric, an operator, and a value. The supported operators are >, <, and =. Join multiple conditions with &, and separate several accepted values for one filter with commas.
For example, exchange=NYSE,NASDAQ accepts either exchange, while marketCap>1000000000&isEtf=false requires both conditions to be true.
Filters Select Rows; Metrics Select Columns
This distinction prevents many screener mistakes:
- A filter decides whether an asset is included.
returnOnEquityTTM>0.20removes companies with ROE at or below 20%. - A metric decides whether a field is visible. Adding
returnOnEquityTTMto the second argument shows the value for every company that passed.
The two lists do not need to match. You can filter by debt and profitability, then return price, market cap, dividend yield, or any other available metric for the surviving companies.
Compare Global Stocks in One Screener Currency
Currency normalisation is essential when a screen spans markets. Without it, a raw marketCap>1000000000 test could compare values denominated in USD, GBP, JPY, AUD, and quoted minor units such as British pence as if they were equivalent.
SF_SCREEN() now uses USD as the default screener currency. Before applying a monetary threshold or ranking, SheetsFinance converts supported monetary fields into that common currency. Returned monetary columns are converted as well and identify the currency in their headings. Percentage and ratio metrics—such as ROE, dividend yield, payout ratio, and debt to equity—remain dimensionless and are not currency-converted.
This cross-market screen therefore interprets the market-cap threshold as USD 1 billion, orders the converted market caps in USD, and returns both the unified currency and each security's original profile currency:
=SF_SCREEN("marketCap>1000000000&exchange=NYSE,NASDAQ,LSE,ASX&isEtf=false", "symbol&exchange&marketCap&price¤cy&sourceCurrency", "ob=marketCap&limit=20")currencyreports the screener currency—in this caseUSD.sourceCurrencyreports the security's original profile currency, such asUSD,GBP,GBp, orAUD.
To run the comparison in Australian dollars, add screenCurrency=AUD to the third argument. The monetary threshold, ordering, and returned monetary values are then all interpreted in AUD:
=SF_SCREEN("marketCap>2000000000&exchange=NYSE,NASDAQ,LSE,ASX&isEtf=false", "symbol&exchange&marketCap&price¤cy&sourceCurrency", "screenCurrency=AUD&ob=marketCap&limit=20")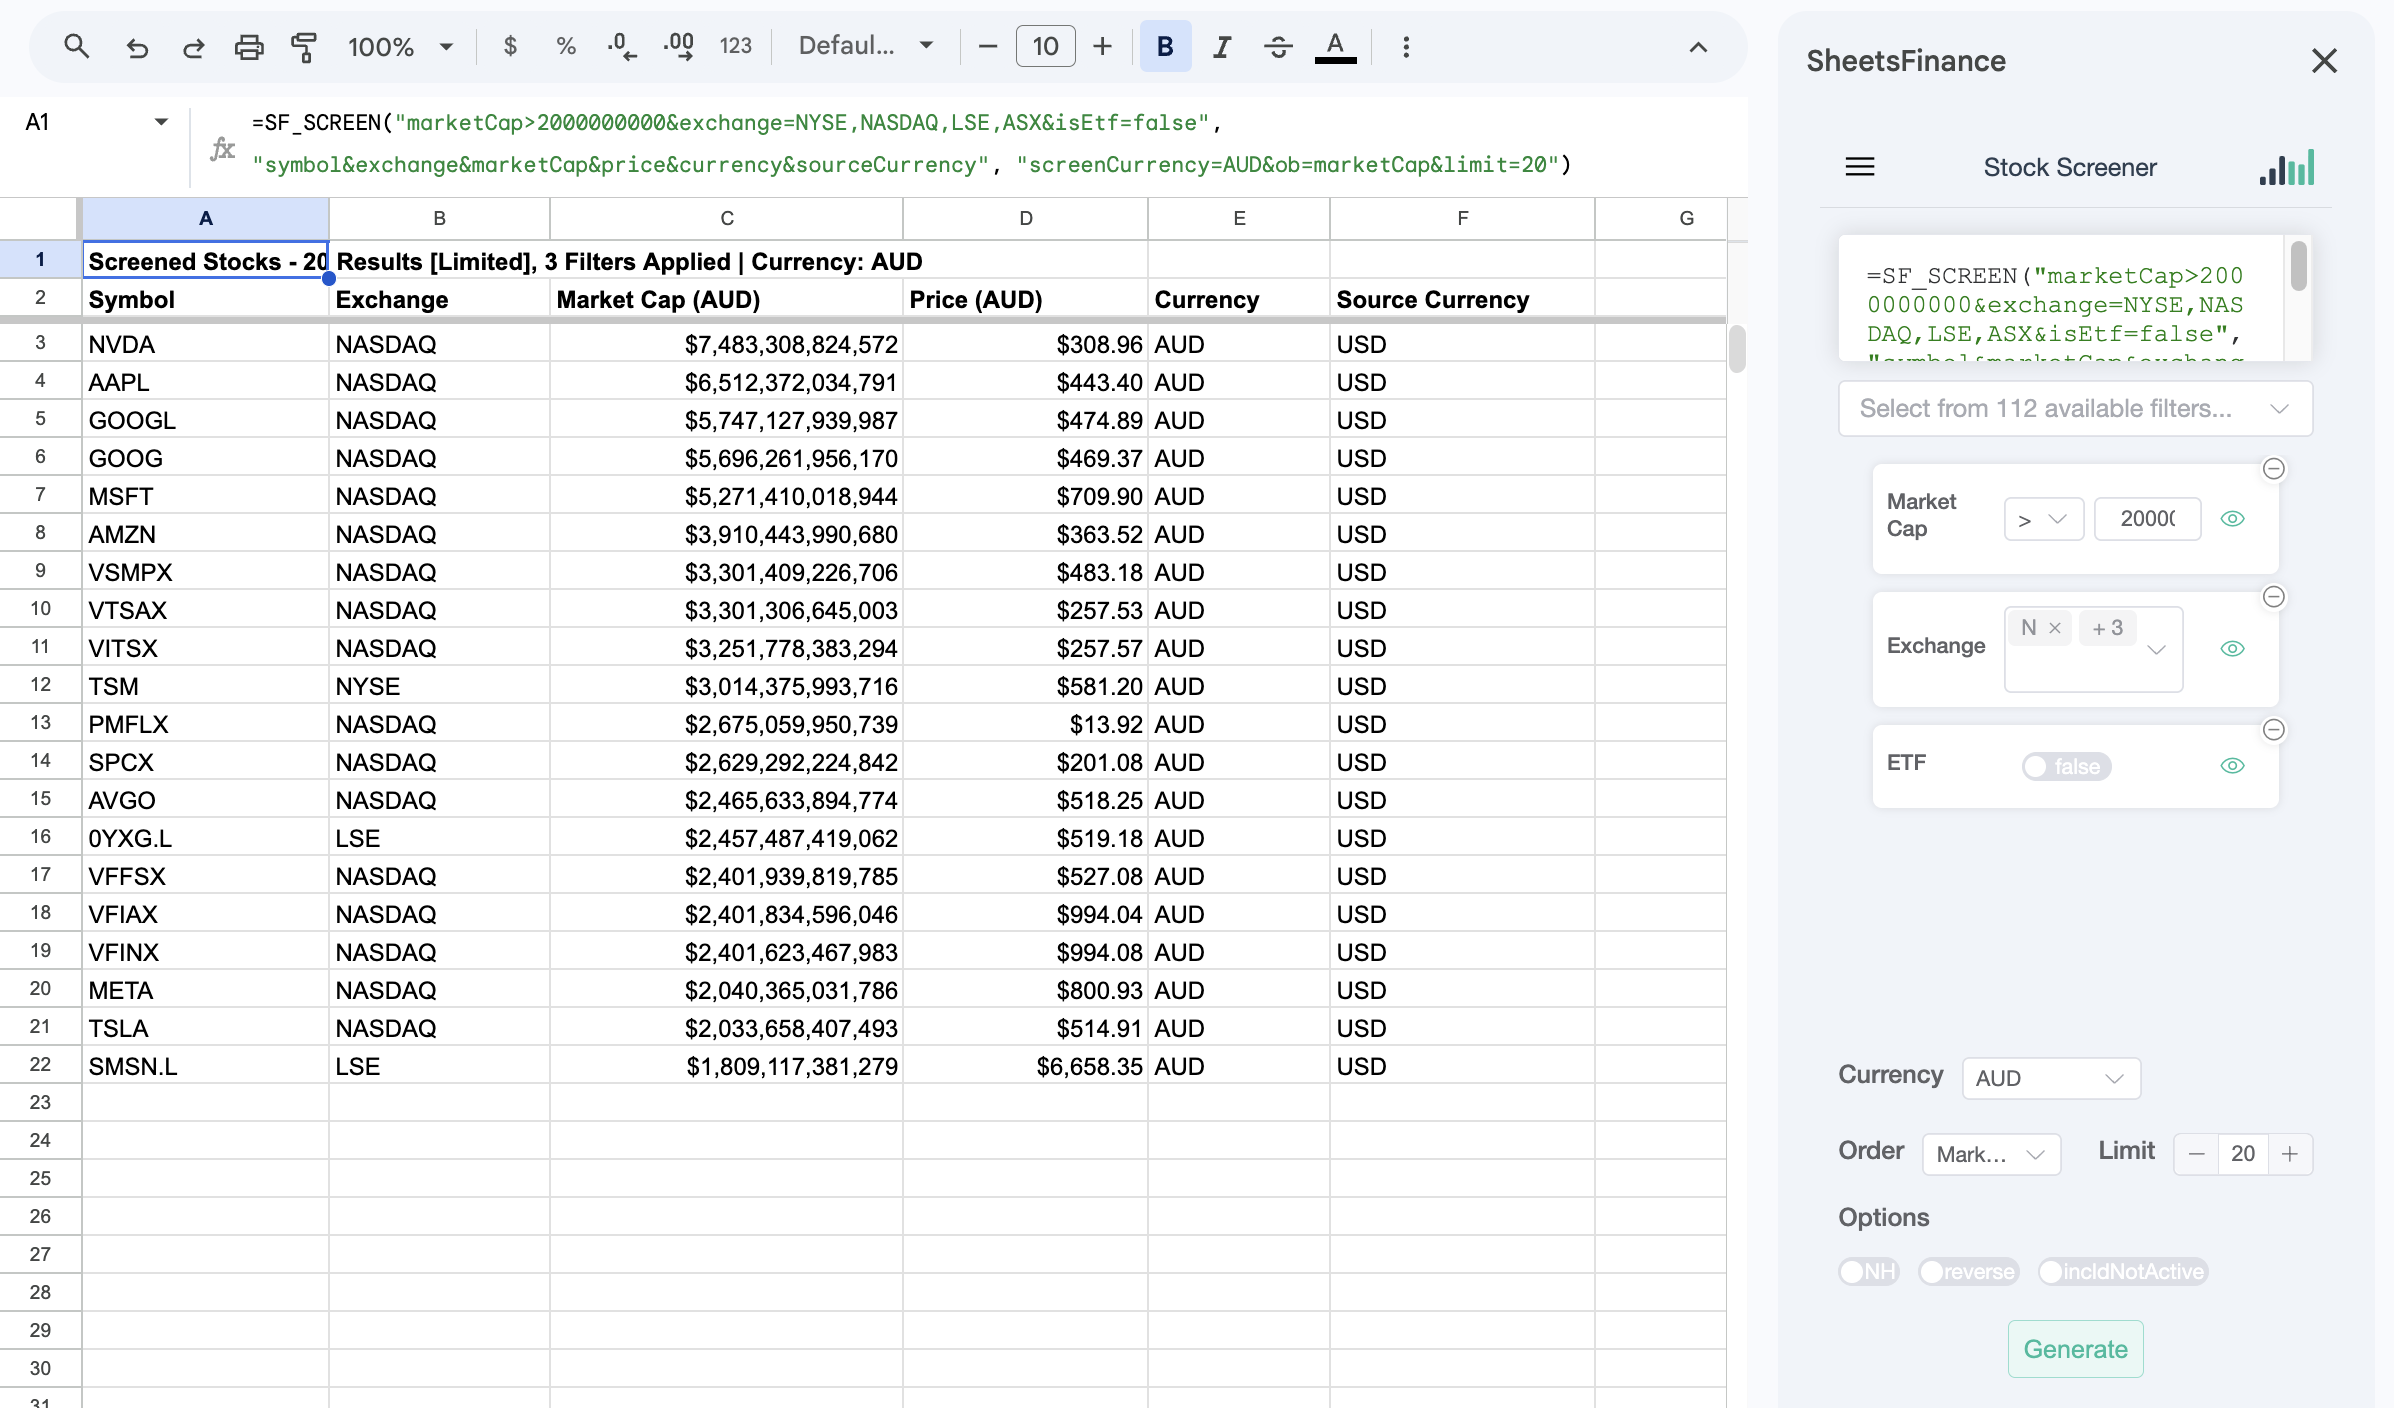
The numeric cutoff belongs to the selected screener currency: marketCap>2000000000 means AUD 2 billion in the second formula. You do not need to calculate exchange rates in cells. The Stock Screener Generator defaults to USD and exposes the supported screener currencies in a dropdown; when you leave USD selected, it can omit the option because USD is already the default.
1. Build a Basic Large-Cap Stock Screen
Start with a broad screen for actively traded, non-ETF stocks on the NYSE or NASDAQ with a market cap above USD 1 billion:
=SF_SCREEN("marketCap>1000000000&exchange=NYSE,NASDAQ&isEtf=false", "symbol§or&industry&exchange&marketCap&price&beta", "ob=marketCap&limit=25")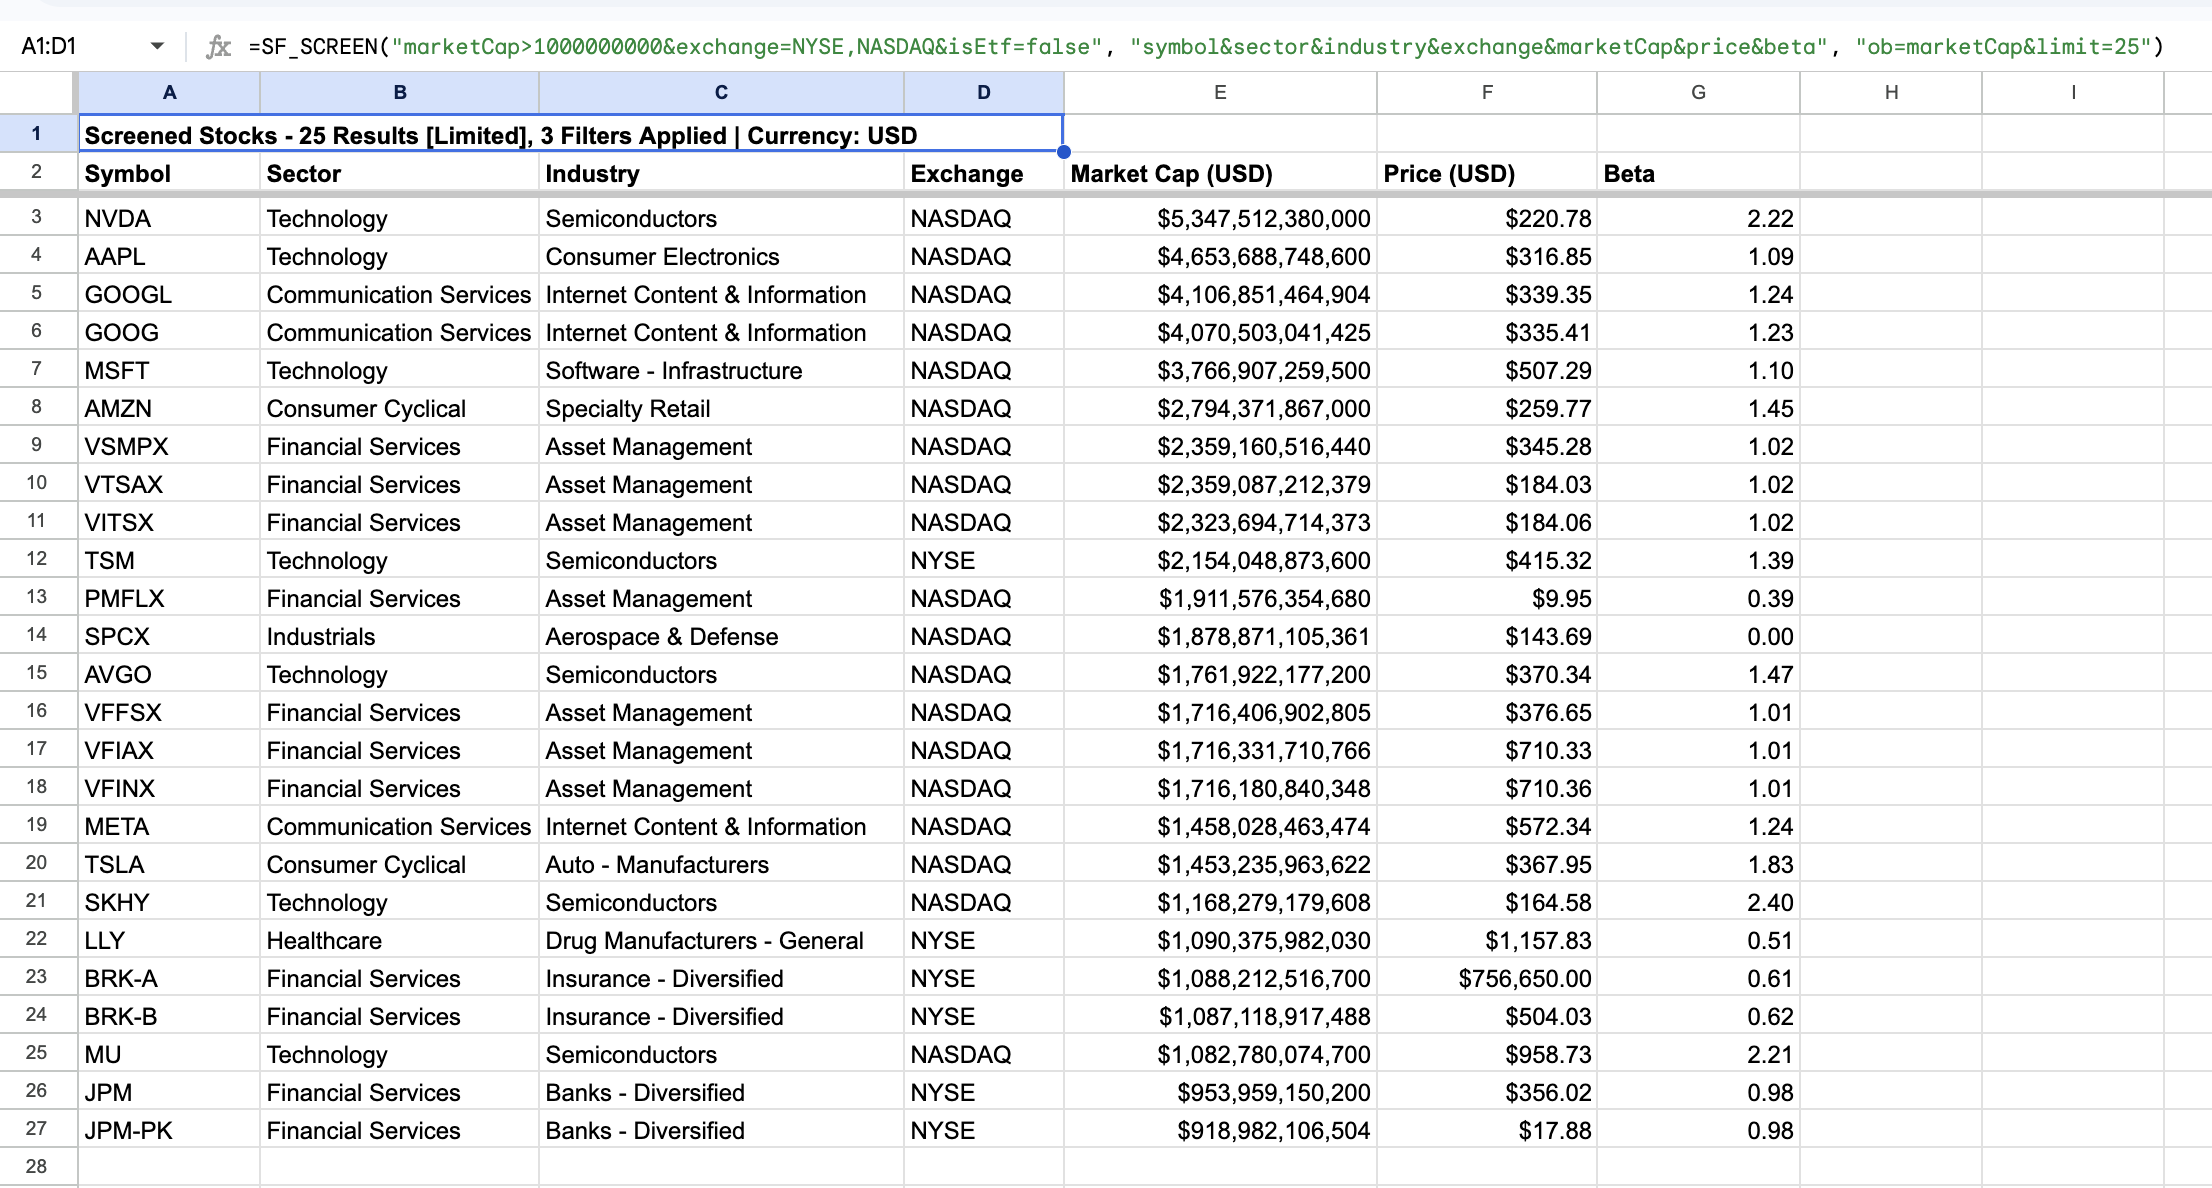
This formula has three parts:
- The filters keep NYSE and NASDAQ companies above the USD market-cap threshold and remove ETFs.
- The metrics create a compact research table with identity, classification, USD-normalised size and price, and beta fields.
- The options order the result by market cap from highest to lowest and return no more than 25 rows.
SF_SCREEN() excludes inactive stocks by default. Add the incldNotActive option only when historical or delisted-company research genuinely requires them.
Basic filters—including market cap, price, volume, beta, dividend, ETF status, sector, industry, country, exchange, and IPO date—are available from the Investor plan upward. See the complete Stock Screener function reference for the current list.
2. Screen for Capital-Efficient Companies With Controlled Leverage
A useful quality screen starts by defining a comparable universe before ranking financial ratios. This example keeps US-domiciled companies listed on the NYSE or NASDAQ in Technology, Healthcare, Industrials, Consumer Defensive, and Consumer Cyclical. It excludes ETFs, funds, and ADRs, then requires a USD price above $10 and market cap above $2 billion.
Within that universe, the financial guardrails require:
- Operating profit margin between 15% and 60%
- Return on invested capital between 15% and 60%
- Positive debt to equity below 1.5
=SF_SCREEN("country=US&exchange=NYSE,NASDAQ§or=Technology,Healthcare,Industrials,Consumer Defensive,Consumer Cyclical&isEtf=false&isFund=false&isAdr=false&price>10&marketCap>2000000000&operatingProfitMarginTTM>0.15&operatingProfitMarginTTM<0.60&returnOnInvestedCapitalTTM>0.15&returnOnInvestedCapitalTTM<0.60&debtToEquityRatioTTM>0&debtToEquityRatioTTM<1.5", "symbol&companyName§or&industry&marketCap&operatingProfitMarginTTM&returnOnInvestedCapitalTTM&debtToEquityRatioTTM", "ob=returnOnInvestedCapitalTTM&limit=20")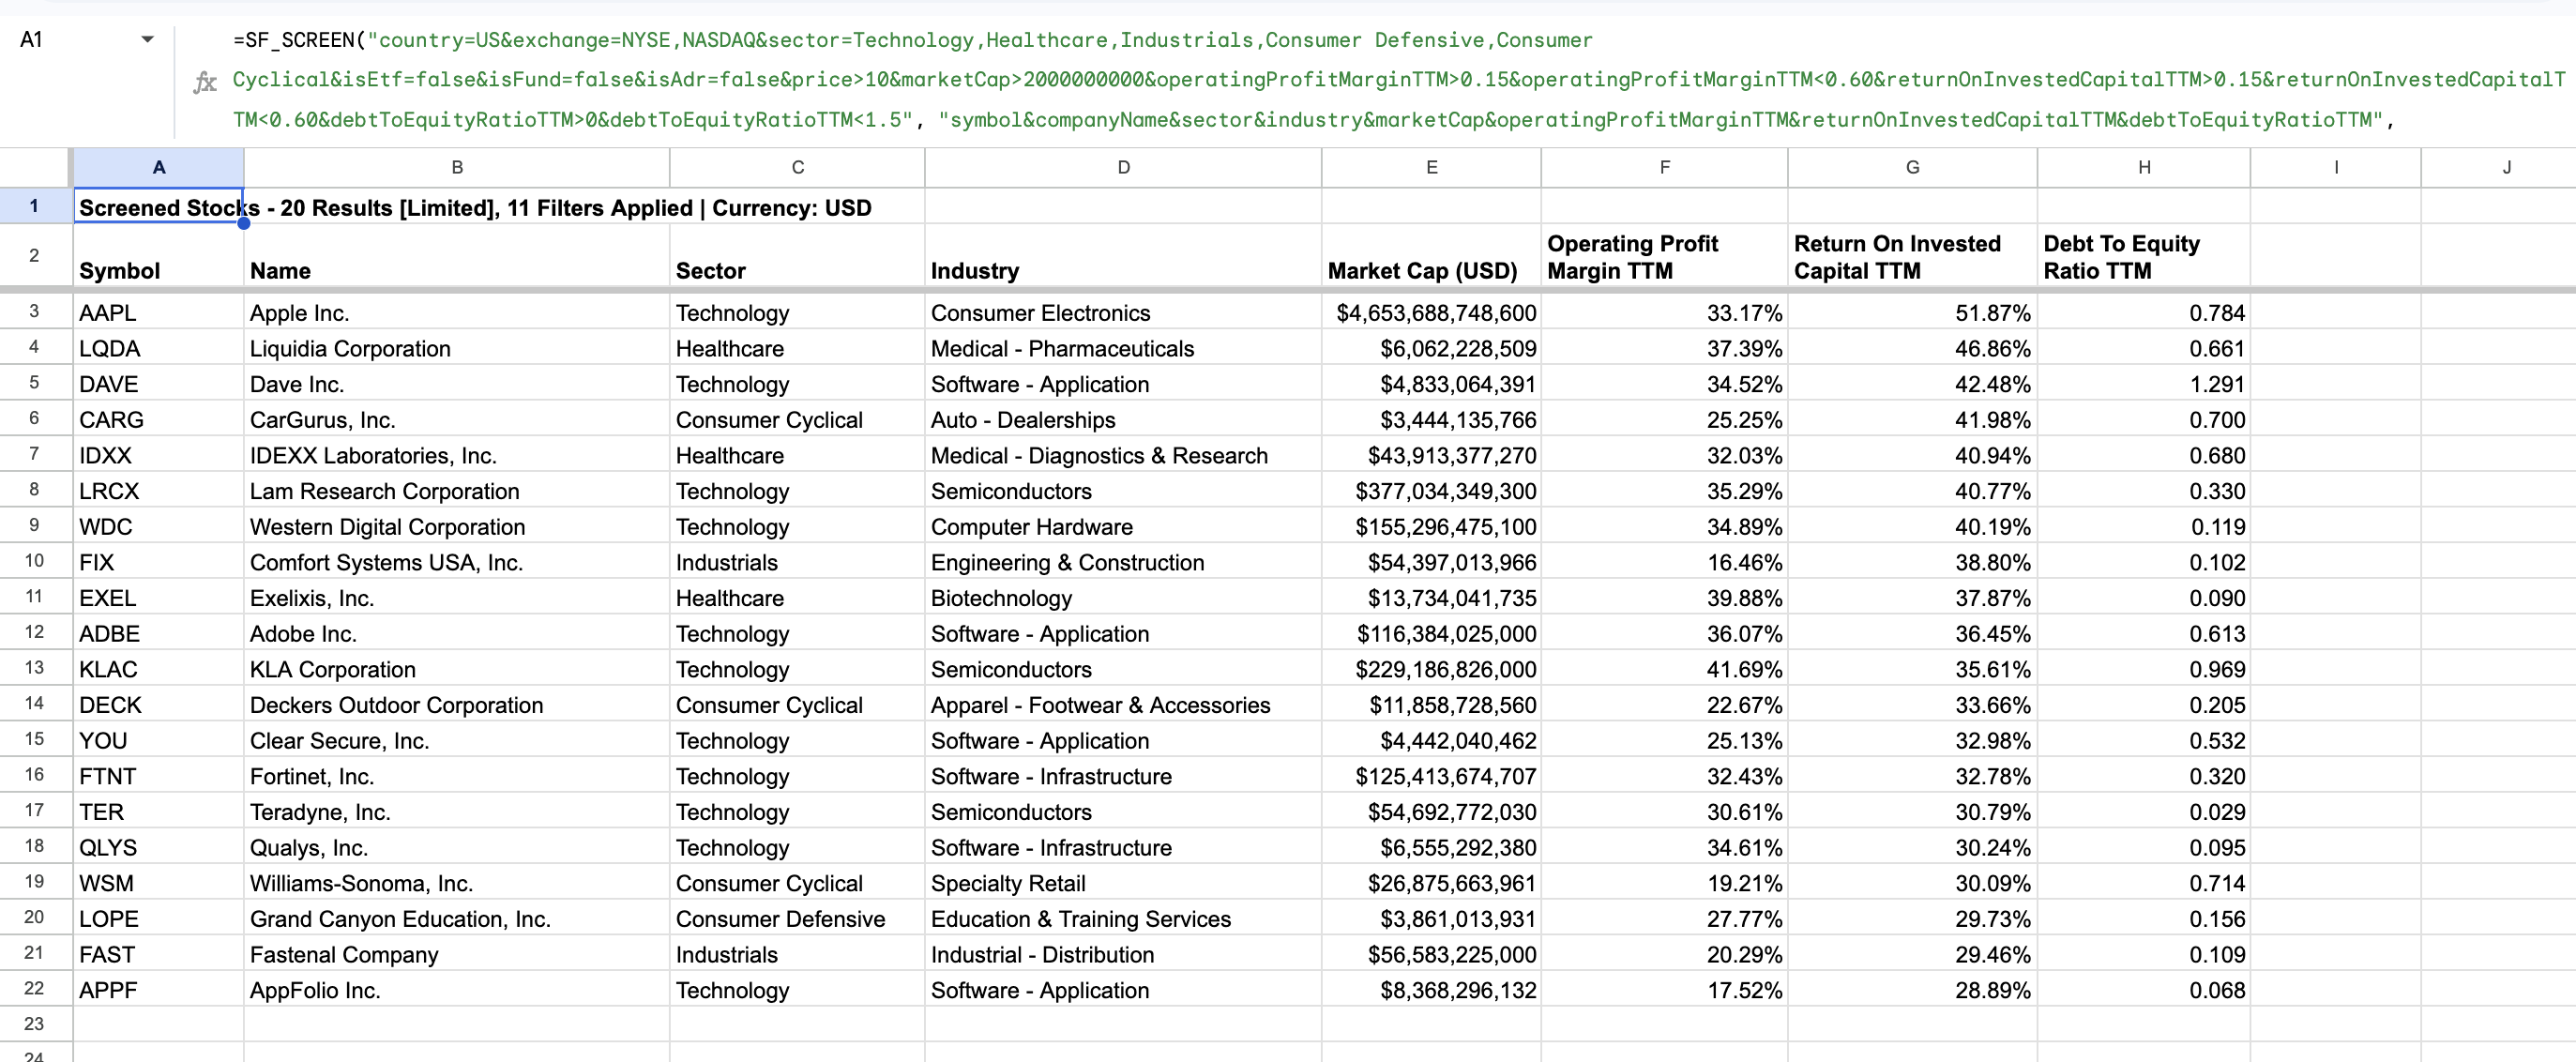
The result is ordered by return on invested capital rather than ROE. ROIC considers the capital used by the business and is less directly distorted by a small equity base, although it still requires interpretation. Financial firms, REITs, Energy companies, and Utilities are not inherently lower quality; they are excluded here because their capital structures and economics can make direct ROIC and leverage comparisons with the selected operating sectors less meaningful. The upper bounds prevent extreme accounting or data values from dominating the shortlist rather than implying that every company above 60% is unattractive.
Tip: tighten the listing universe before adding ratios.
SF_SCREEN()screens individual listings, not unique corporate issuers. Combiningcountrywithexchange, excluding ETFs, funds, and ADRs, and adding sensible price and market-cap floors can reduce secondary listings and non-common-share instruments. These controls do not guarantee one row per issuer, so reviewsymbolbesidecompanyNamewhen duplicate share classes, warrants, or foreign listings would affect the analysis.
Advanced TTM filters are available on the Analyst plan and commercial plans. They include profitability, valuation, liquidity, leverage, efficiency, cash-flow, yield, and per-share measures. Values expressed as ratios normally use decimals in the formula: 0.20 represents 20%, not 20.
3. Build a Dividend Stock Screener
A dividend screen becomes more useful when it considers both yield and the portion of earnings being distributed. This example searches US-domiciled companies listed on the NYSE or NASDAQ, excludes ETFs and funds, and requires a USD market cap above $2 billion. It keeps dividend yields between 3% and 12%, requires a positive payout ratio below 75%, and returns up to 30 results:
=SF_SCREEN("country=US&exchange=NYSE,NASDAQ&isEtf=false&isFund=false&marketCap>2000000000÷ndYieldTTM>0.03÷ndYieldTTM<0.12÷ndPayoutRatioTTM>0÷ndPayoutRatioTTM<0.75", "symbol&exchange§or&marketCap÷ndYieldTTM÷ndPayoutRatioTTM&freeCashFlowYieldTTM", "ob=dividendYieldTTM&limit=30")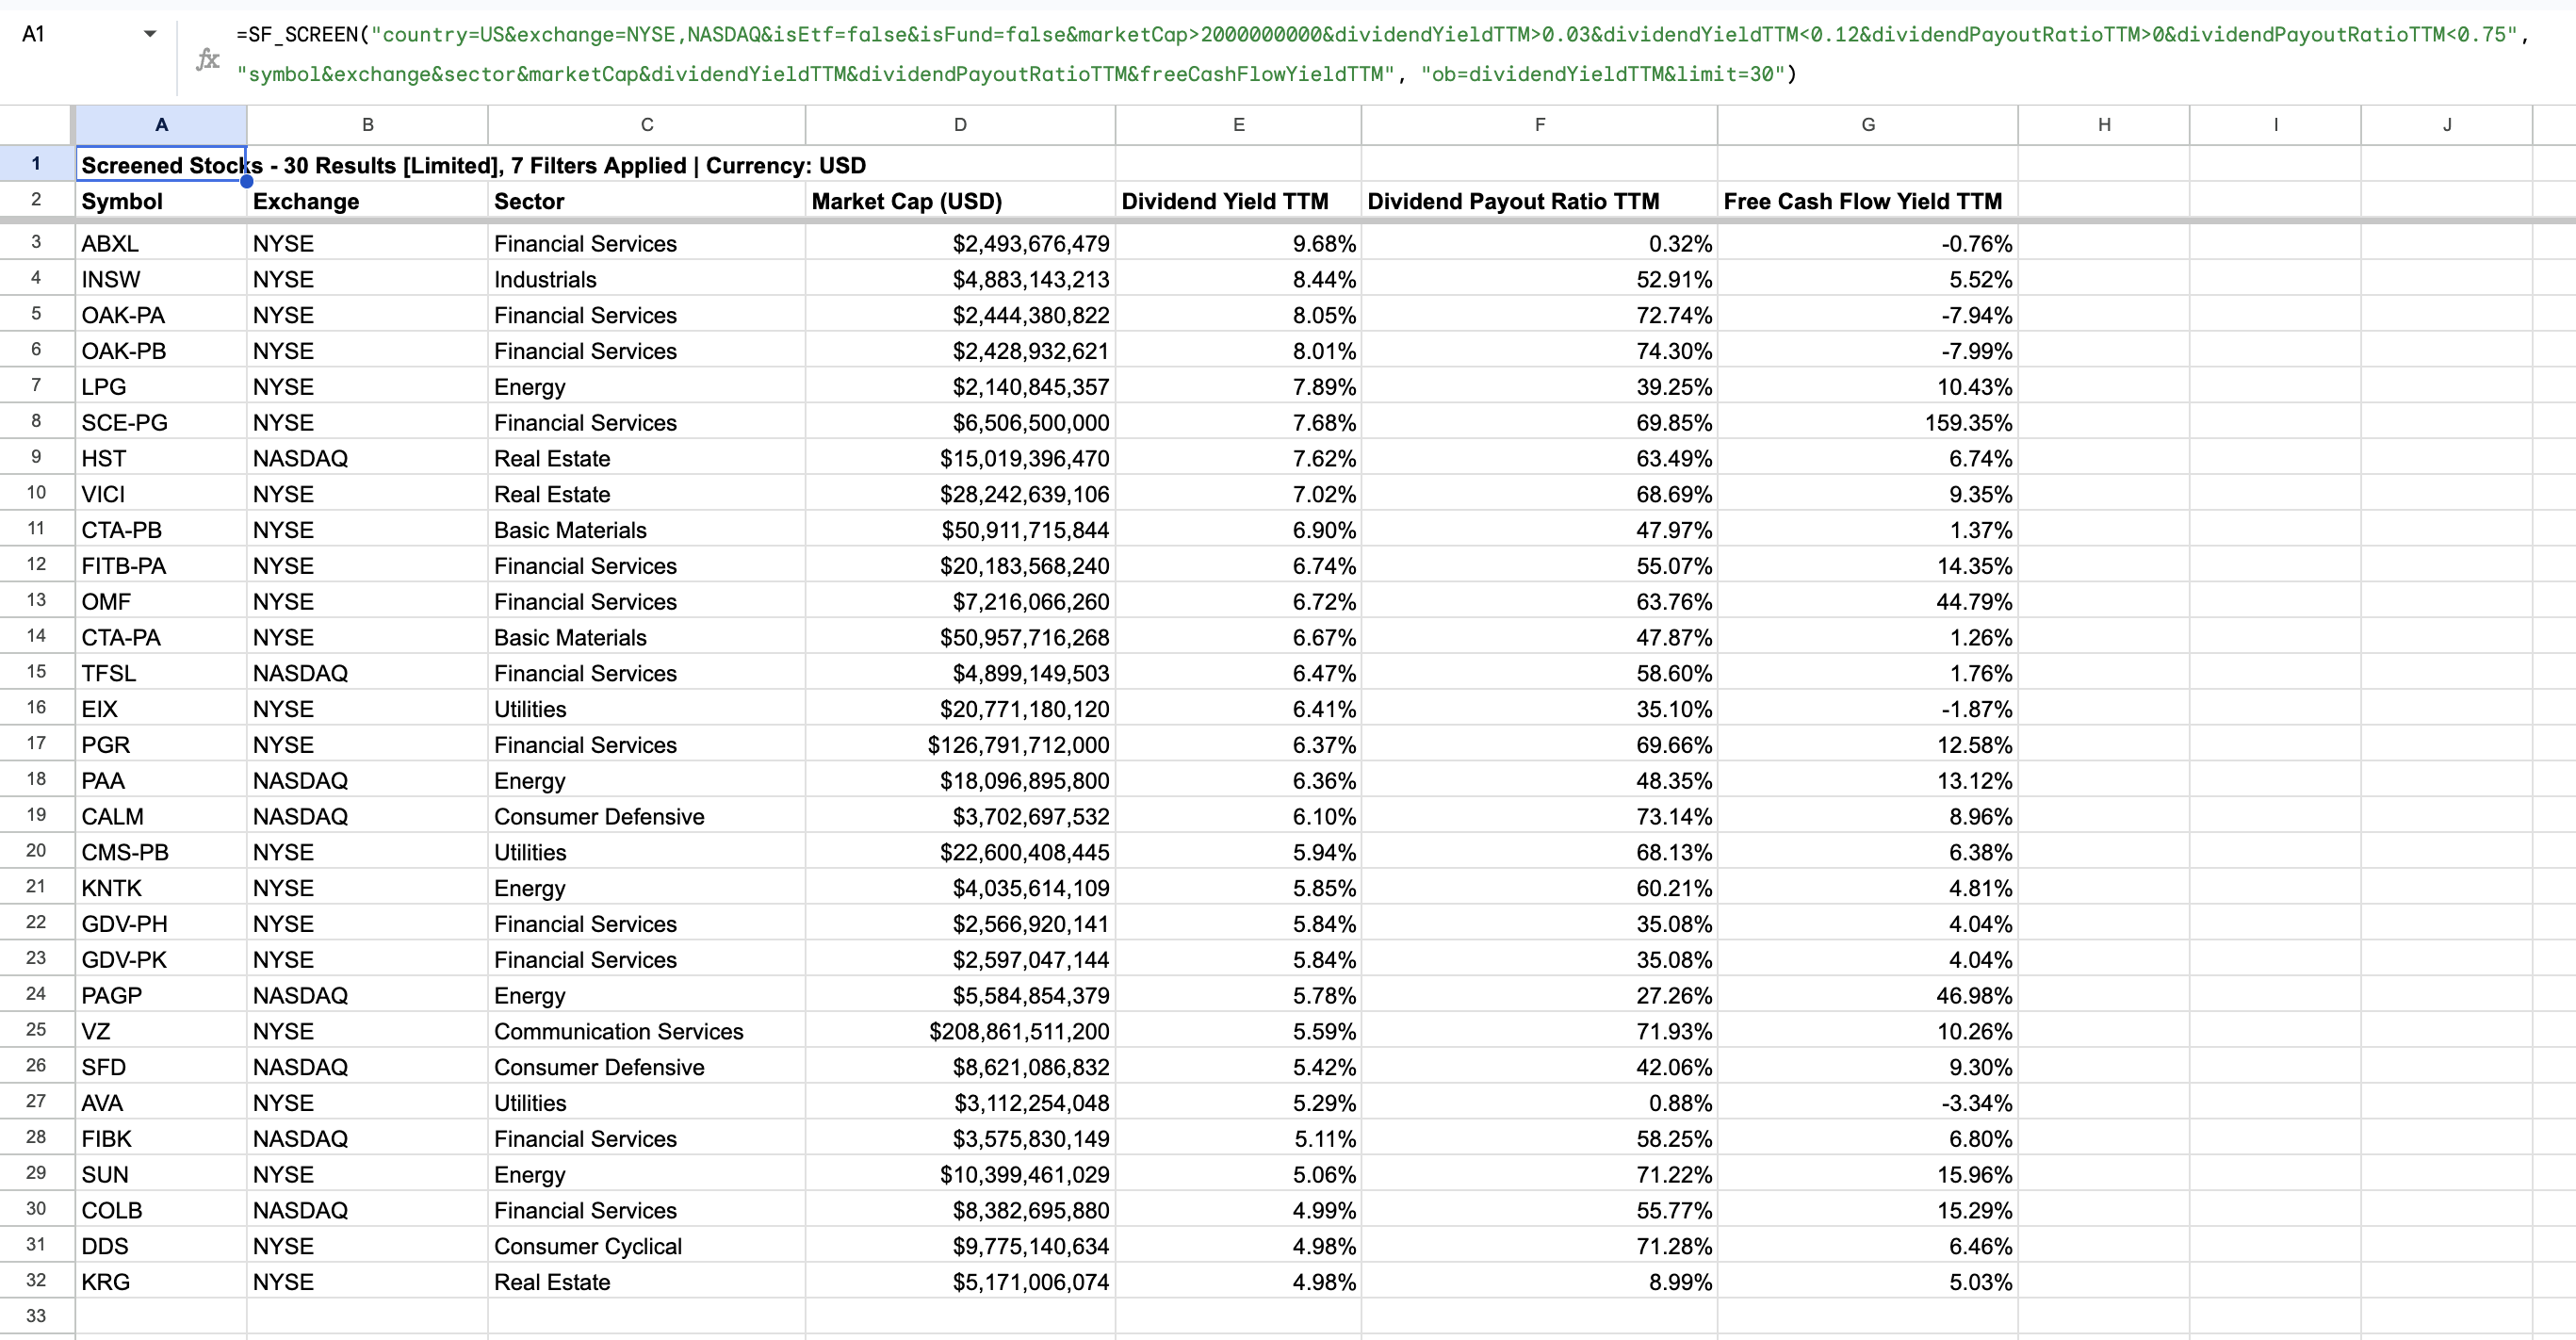
Format the three yield and ratio columns as percentages. country=US describes company domicile; adding exchange=NYSE,NASDAQ explicitly constrains the listing venues and prevents US-domiciled companies on other exchanges from entering this example. The positive payout-ratio floor removes companies with negative payout ratios, while the 12% yield ceiling acts as a practical guardrail against extreme yields rather than proof that every remaining distribution is sustainable. Free cash flow yield remains visible as context and can still be negative. Avoid interpreting the highest dividend yield as inherently best: it may reflect a falling share price, unusual distributions, or business risk that requires further research.
For a dedicated dividend-history workflow, continue with Keeping Track of Dividends in Google Sheets.
4. Chart a Ranked Shortlist
For a more useful ROE comparison, narrow the universe to US-domiciled Technology companies listed on the NYSE or NASDAQ, exclude ETFs, funds, and ADRs, and require a USD market cap above $1 billion. The screen keeps ROE between 15% and 60%, operating profit margin above 10%, and debt to equity between 0 and 1.5 before returning the top 10 companies by ROE:
=SF_SCREEN("country=US&exchange=NYSE,NASDAQ§or=Technology&isEtf=false&isFund=false&isAdr=false&marketCap>1000000000&returnOnEquityTTM>0.15&returnOnEquityTTM<0.60&operatingProfitMarginTTM>0.10&debtToEquityRatioTTM>0&debtToEquityRatioTTM<1.5", "symbol&returnOnEquityTTM&operatingProfitMarginTTM&debtToEquityRatioTTM&marketCap", "ob=returnOnEquityTTM&limit=10")The upper ROE limit removes extreme values that can arise from a very small or negative equity base, while the margin and leverage conditions add context that an ROE-only ranking would miss. These thresholds are analytical guardrails rather than a universal definition of quality.
The spilled output begins in A1. Row 1 contains the screen summary, row 2 contains the column headings, and the 10 results occupy rows 3 to 12. Format ROE and operating profit margin as percentages, debt to equity as a decimal multiple, and market cap as USD. Select A2:B12 and insert a horizontal bar chart, using column A as the category labels and column B as the only series. Format the horizontal axis as a percentage with a maximum of 60%.
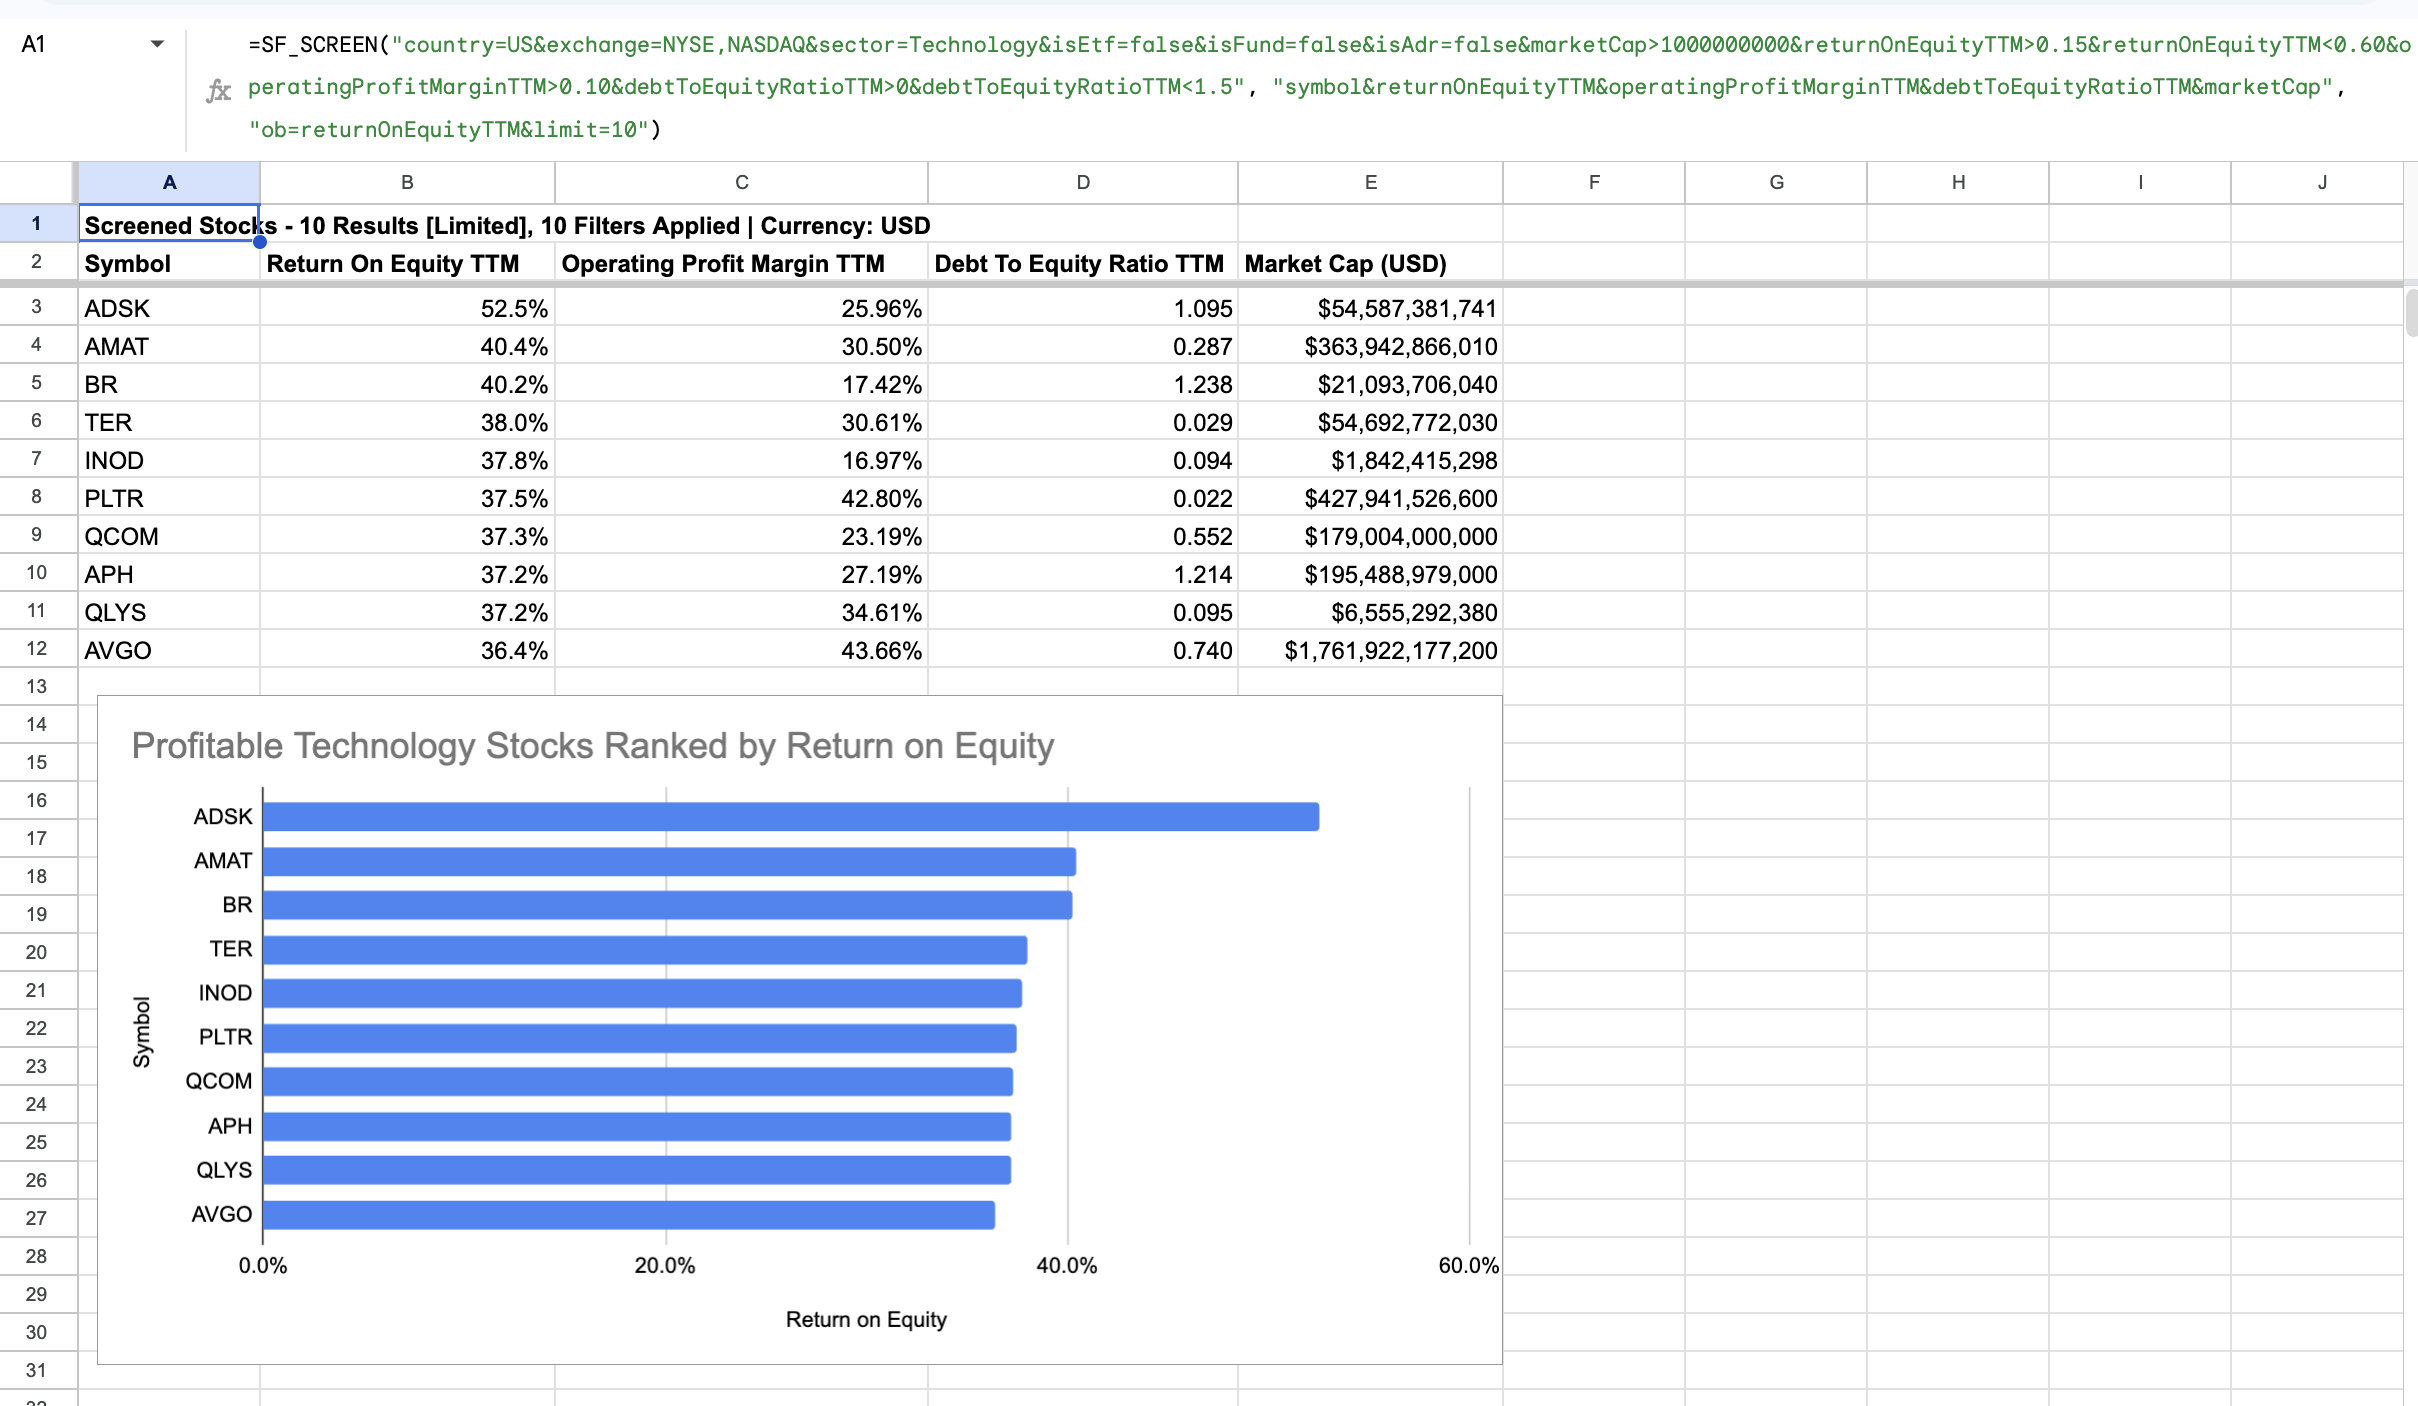
Because the chart reads directly from the spilled result, it updates when the screen changes. Keep the formula's limit=10 option so the chart remains readable and the ranking rule remains explicit.
Use the Stock Screener Generator or Write the Formula Directly
You do not have to type long filter strings from memory. The built-in Stock Screener Generator lets you add filters, choose visible metrics, select the screener currency, set ordering and limits, preview the SF_SCREEN() formula, and insert it into the active spreadsheet cell.
In Google Sheets, open it from the SheetsFinance extension menu below the Function Generator. The generated formula remains a normal spreadsheet formula, so you can inspect, copy, or edit it after insertion.
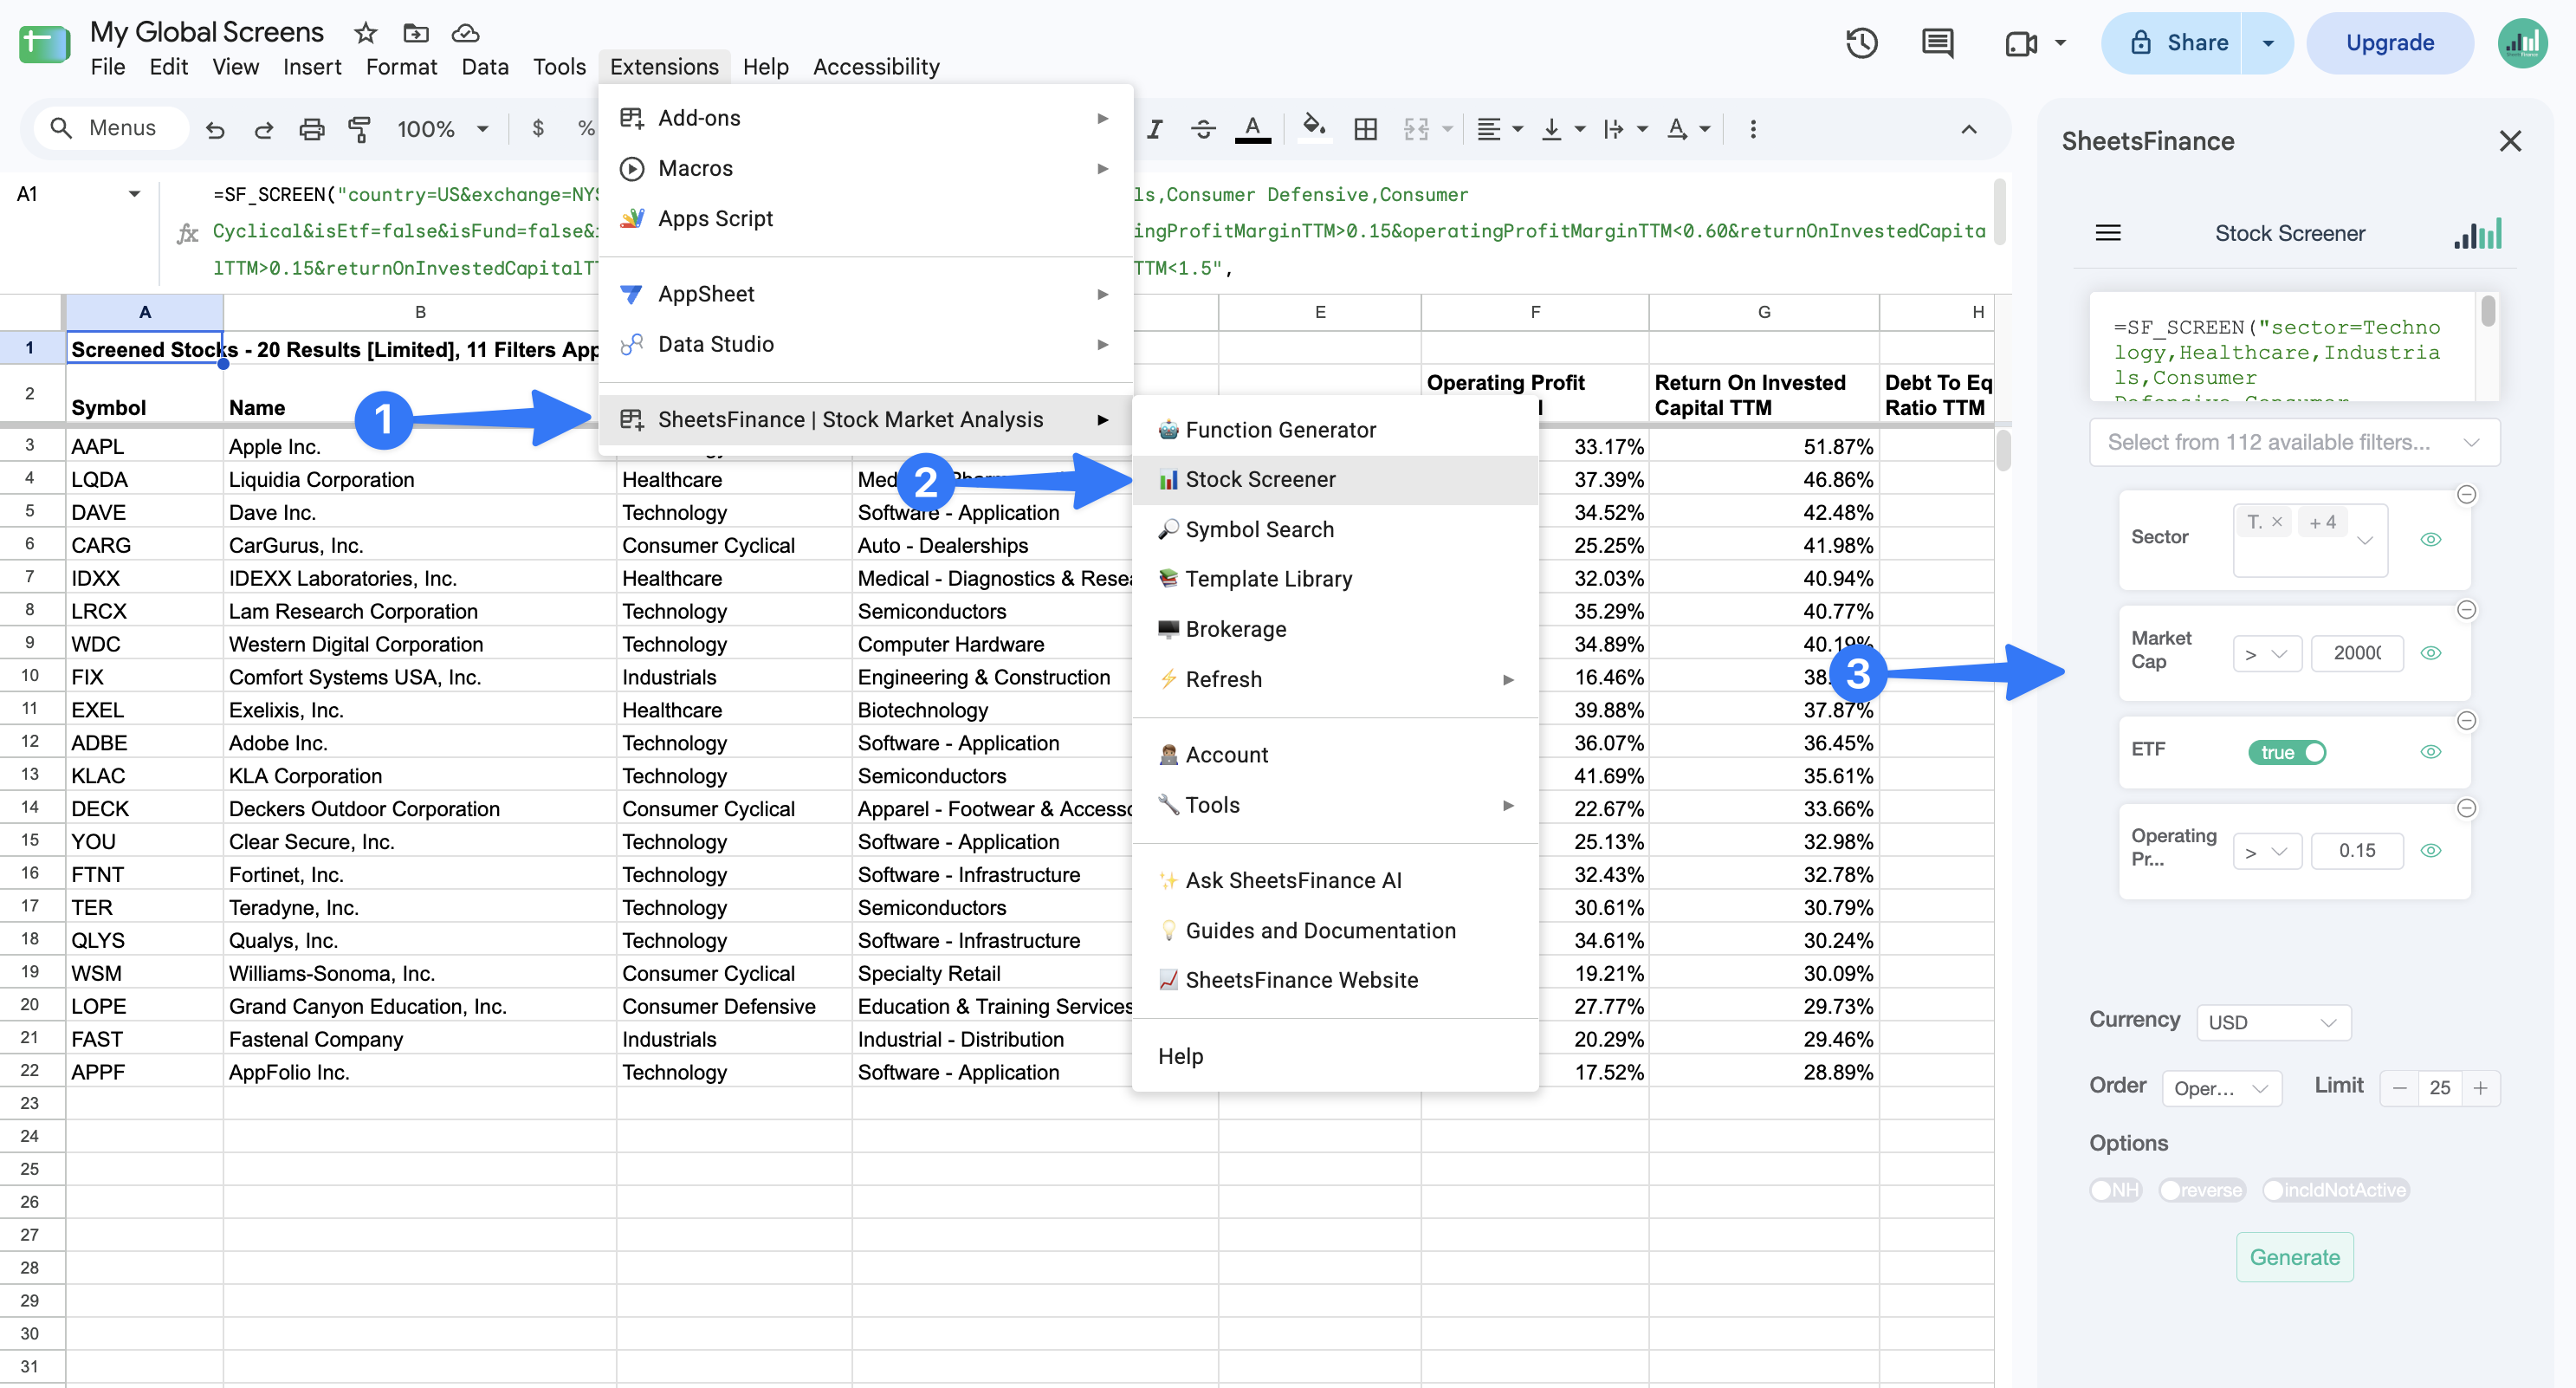
Read the Stock Screener Generator guide for the current interface walkthrough. If you prefer to construct formulas directly, use the function reference to verify every filter, metric, and option name.
A Repeatable Stock Screening Workflow
- Write the investment question first. Decide whether you are looking for size, quality, value, income, growth, or another characteristic before choosing metrics.
- Define the investable universe. Use country, exchange, sector, industry, market cap, ETF status, and active status to avoid comparing unrelated assets.
- Choose the comparison currency. Keep the default USD for a globally consistent screen, or add
screenCurrency=when the research question is better expressed in another supported currency. - Add only defensible thresholds. Record both the cutoff and its currency rather than adjusting it until familiar companies appear.
- Return the context fields. Include the metrics needed to explain why a company passed; add
currencyandsourceCurrencywhen auditing a cross-market result. - Order and limit the output. Rank by the measure that matches the screen's purpose, then use
limit=to create a reviewable shortlist. - Investigate the survivors. A screen is a starting point. Review financial statements, business quality, data dates, news, liquidity, and valuation before reaching a conclusion.
- Keep the formula visible. An auditable formula makes the selection rule easier to reproduce and less prone to hindsight changes.
If your goal is to compare a company with its market rather than return individual candidates, use the sector and industry valuation workflow in How to Get Sector and Industry P/E Ratios in Google Sheets. The stock screener returns companies; it does not calculate an aggregated sector average.
Common Mistakes to Avoid
- Confusing filters with output metrics: A displayed column does not filter the result unless the condition also appears in the first argument.
- Assuming monetary thresholds use each listing's native currency: Monetary filters, ordering, and output use USD by default. Add
screenCurrency=when the cutoff should use another supported currency. - Confusing
currencyandsourceCurrency:currencyis the unified screener currency;sourceCurrencyis the security's original profile currency. - Using country as a listing filter: Country identifies the company, while exchange identifies the listing venue. Use both when both constraints matter.
- Assuming one row always means one company: The screener returns listings, so one issuer may appear through several exchanges, share classes, ADRs, preferred shares, or warrants. Tighten the country, exchange, instrument, price, and market-cap filters, then review symbol and company name together.
- Entering percentages as whole numbers: Use
0.15for 15% when a ratio is stored as a decimal. - Forgetting the comma rule: Use commas for several acceptable values within one filter, such as
exchange=NYSE,NASDAQ; use&between separate conditions. - Returning too many columns: Start with the fields needed to understand the shortlist, then add detail only when it supports the decision.
- Leaving the result unbounded: Use
limit=for dashboards and charts so a changing screen does not create an unwieldy spill range. - Treating rank as a recommendation: The first row only has the highest value for the selected ordering metric.
- Mixing sector screens with sector averages:
SF_SCREEN()returns individual assets. Use the dedicated Sector PE or Industry PE functions for aggregated valuation context. - Including inactive stocks accidentally: Inactive assets are excluded by default; only use
incldNotActivewhen that is intentional.
Frequently Asked Questions
Can I build a stock screener in Google Sheets?
Yes. SF_SCREEN() returns a live, spillable table directly in Google Sheets. You can type the formula or build it with the SheetsFinance Stock Screener Generator.
Can I use the same stock screener in Microsoft Excel?
Yes. Market Data functions are available in both Google Sheets and Microsoft Excel, and the same SF_SCREEN(filters, metrics, options) formula structure applies.
What markets can I screen?
SheetsFinance screens its database of more than 80,000 financial assets. Use country and exchange filters to define the universe you want. Coverage varies by dataset and market, so confirm symbols and exchange details in Available Markets.
How do I combine several filters?
Join separate conditions with &. For example, sector=Technology&marketCap>1000000000 requires both conditions. Use commas for multiple accepted values within one condition, such as exchange=NYSE,NASDAQ.
How does SF_SCREEN() compare monetary values from different markets?
It converts supported monetary filters, ordering fields, and returned monetary values into one screener currency before comparison. USD is the default. Add currency&sourceCurrency to the metrics when you want the output to show both the unified screener currency and each security's original profile currency.
How do I screen in AUD, GBP, EUR, or another currency?
Add screenCurrency= to the options argument, for example screenCurrency=AUD&ob=marketCap&limit=20. The selected currency applies to monetary thresholds, monetary ordering, and returned monetary values. The Stock Screener Generator's currency dropdown shows the currently supported choices.
How do I sort and limit a screen?
Use the options argument. ob=marketCap&limit=25 orders by market cap descending and returns the first 25 rows. Prefix the ordering metric with a minus sign for ascending order, such as ob=-marketCap.
Which plan includes the Stock Screener?
Basic filters are available from the Investor plan upward. Advanced financial filters require the Analyst plan or a commercial plan. The Market Data trial includes Analyst-level feature access with a lower daily data-call limit. Check Market Data pricing for current plan details.
Is a stock screener enough to choose an investment?
No. A screener consistently applies quantitative conditions, but it cannot replace due diligence, data-quality checks, business analysis, portfolio constraints, or risk assessment.
Start Screening Stocks in Your Spreadsheet
Begin with a broad, understandable universe and return only the columns needed to inspect it:
=SF_SCREEN("marketCap>1000000000&exchange=NYSE,NASDAQ&isEtf=false", "symbol§or&industry&exchange&marketCap&price¤cy&sourceCurrency&beta", "ob=marketCap&limit=25")Then replace one condition at a time, document what changed, and keep the screen's purpose visible beside the output.
Start a 15-day free trial, open the Stock Screener Generator guide, or review every supported condition in the SF_SCREEN function reference.
For ideas on evaluating the companies that pass, read Understanding Quality: The Business Owner's Perspective. To turn a saved ticker list into a monitoring dashboard, see Build a Real-Time Global Stock Watchlist in Google Sheets.