Company KPIs
The kpis data type returns company-specific key performance indicators (KPIs) for a stock, including company-defined (non-GAAP) and segment metrics. Every company reports its own set of KPIs, so you first list what a company offers with kpiCatalog, then request the values with kpis.
=SF(symbol, type, metrics, year, options)symbolis the ticker symbol of the company (e.g.,"AAPL"). Pass a single symbol per call; KPI requests cannot be batched across a range of symbols.typesets the frequency:"kpis"for annual data,"kpisQ"for all quarters, or"kpisQ1"through"kpisQ4"for one specific quarter.metricsis one or more KPI metric IDs chained with&. Leave it blank or use"all"to return every available company KPI and segment metric for the selected frequency. Metric IDs are company-specific, so look them up withkpiCatalog(below).yearselects the periods. Leave it blank for all available data for the frequency, or enter a single year (e.g.,"2023") or a year range (e.g.,"2018-2023"). Other date formats are rejected with the error "Invalid company KPI year or year range."optionsadjusts the output. Available options:"NH"for no header row,"NLI"for no line-item (metric label) column,"-"to reverse the period ordering,"calYear"to use calendar years instead of fiscal years,"pad"to fill missing periods whenyearis a range such as"2018-2023","currency=XXX"to convert monetary metrics to a currency, and"scale=K|M|B"to scale monetary values. Chain options with&, e.g."NH&scale=M¤cy=AUD". See Currency conversion and scaling for the full option reference.
Tips:
Currency conversion and scaling only affect metrics the KPI dataset marks as monetary. Ratios, percentages, dates and identifiers are returned unchanged.
Use
"pad"with a year range so missing periods appear as empty columns instead of shifting the remaining periods.
Output
Each requested metric is returned as one row, labelled with the metric's name. The remaining columns are periods: annual data uses headers like FY-2025, quarterly data uses headers like Q1-2025. When a currency conversion is applied, the output also includes Display Currency (displayCurrency) and Conversion Rate (conversionRate) values.
Find metric IDs with kpiCatalog
kpiCatalog lists every KPI a company reports. It ignores the metrics and year arguments, and of the options only "NH" has an effect:
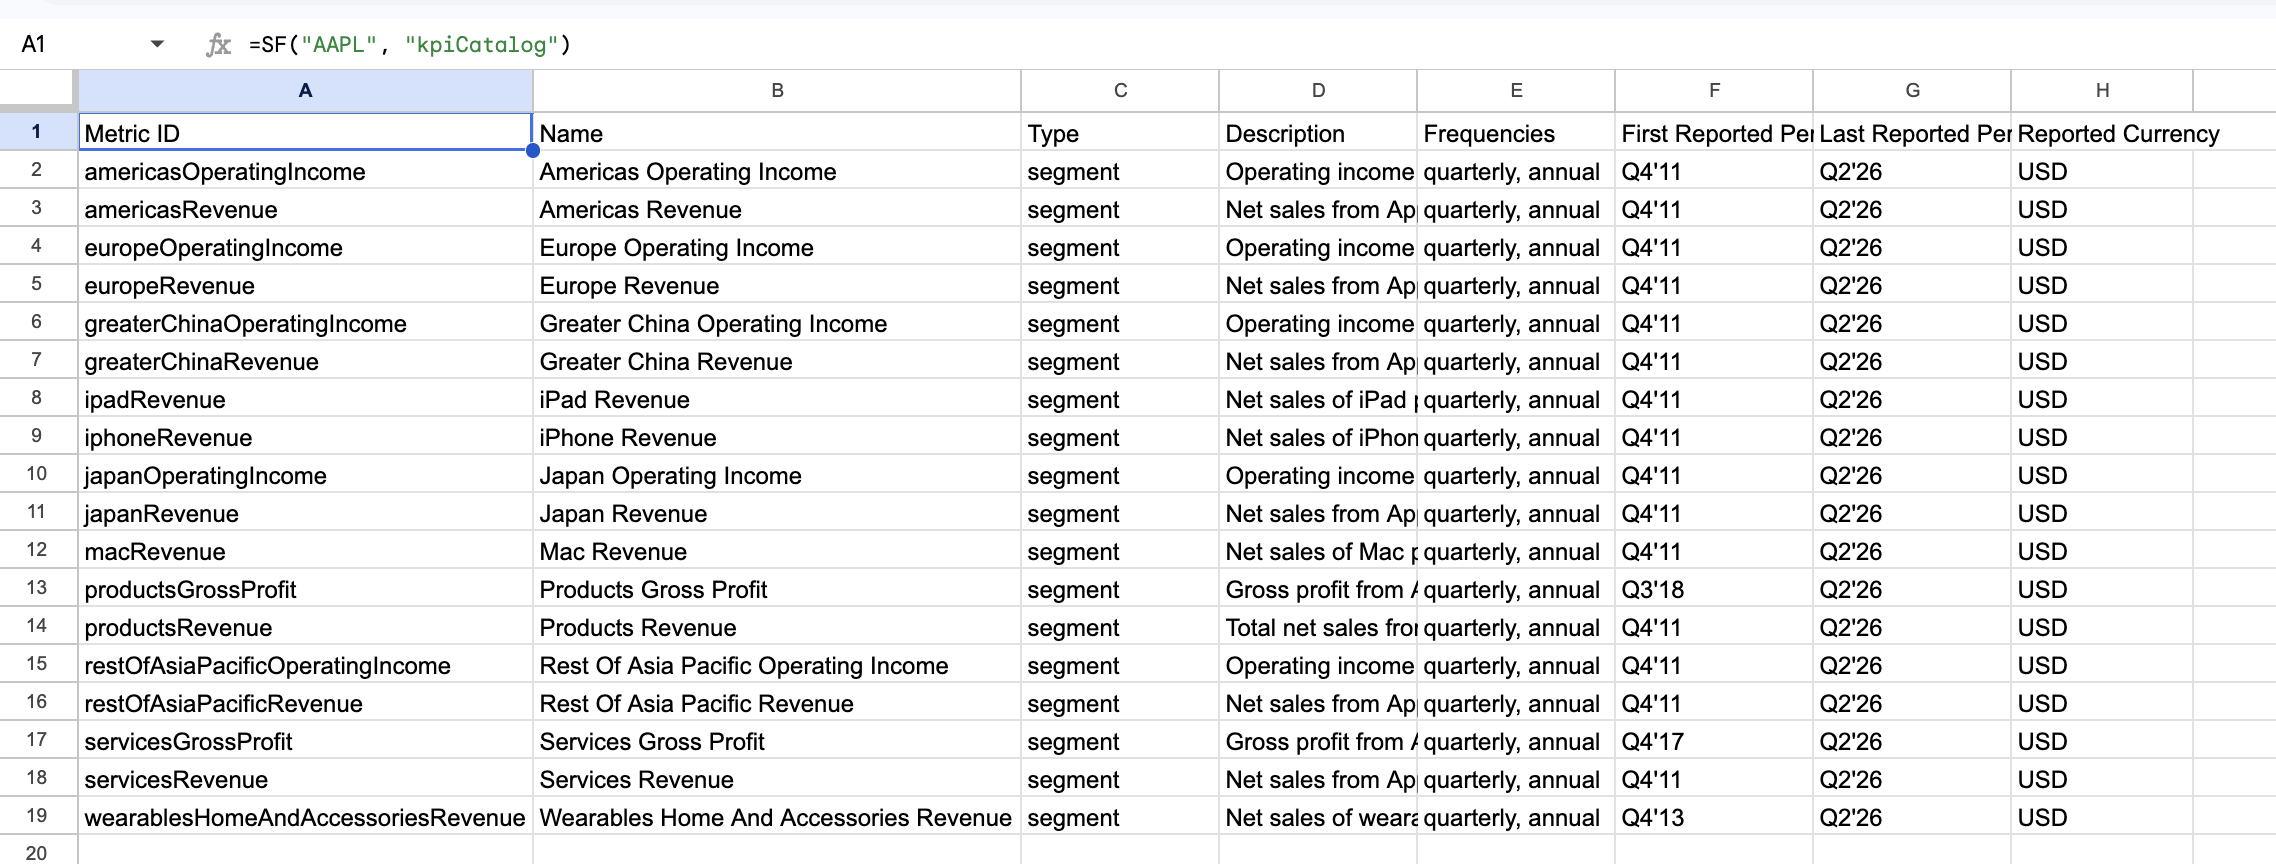
=SF("AAPL", "kpiCatalog")The catalog returns one row per metric with these columns: Metric ID (metricId), Name (name), Type (type), Description (description), Frequencies (frequencies, e.g. "annual, quarterly"), First Reported Period (firstReportedPeriod), Last Reported Period (lastReportedPeriod), and Reported Currency (reportedCurrency). Use the Metric ID values in your kpis calls.
Examples
Example 1 - Latest annual KPIs
=SF("PLTR", "kpis")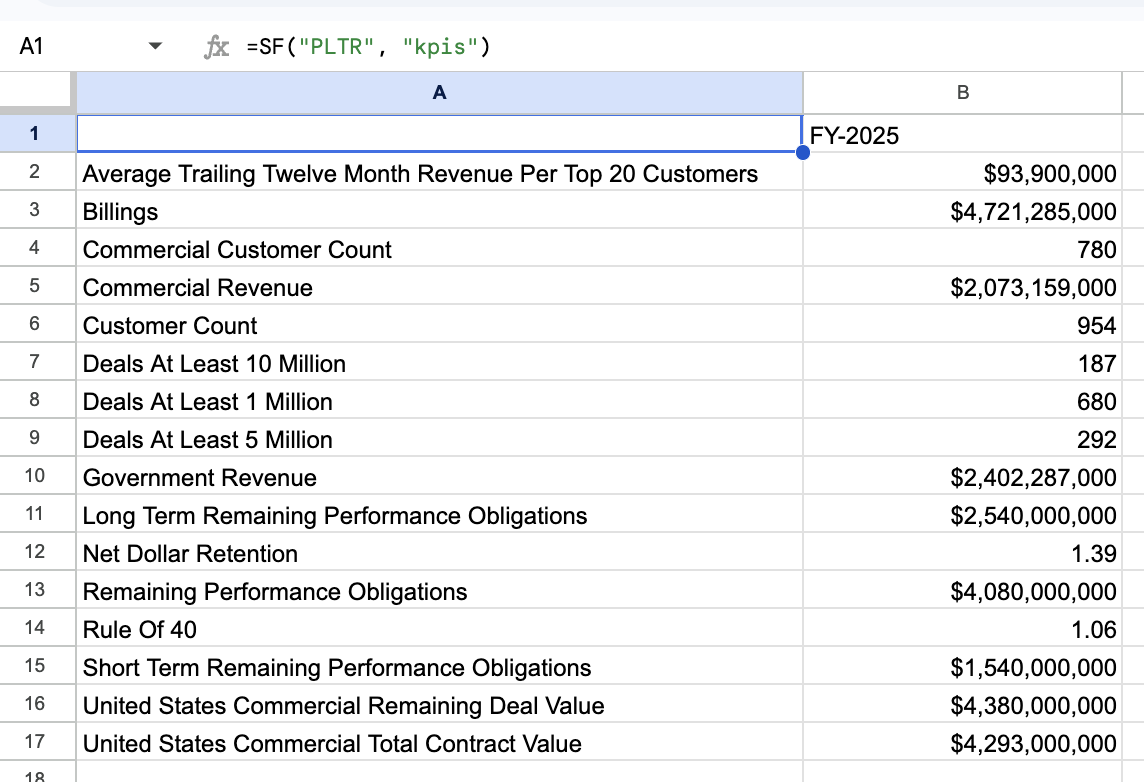
Example 2 - Latest quarterly KPIs
=SF("AAPL", "kpisQ")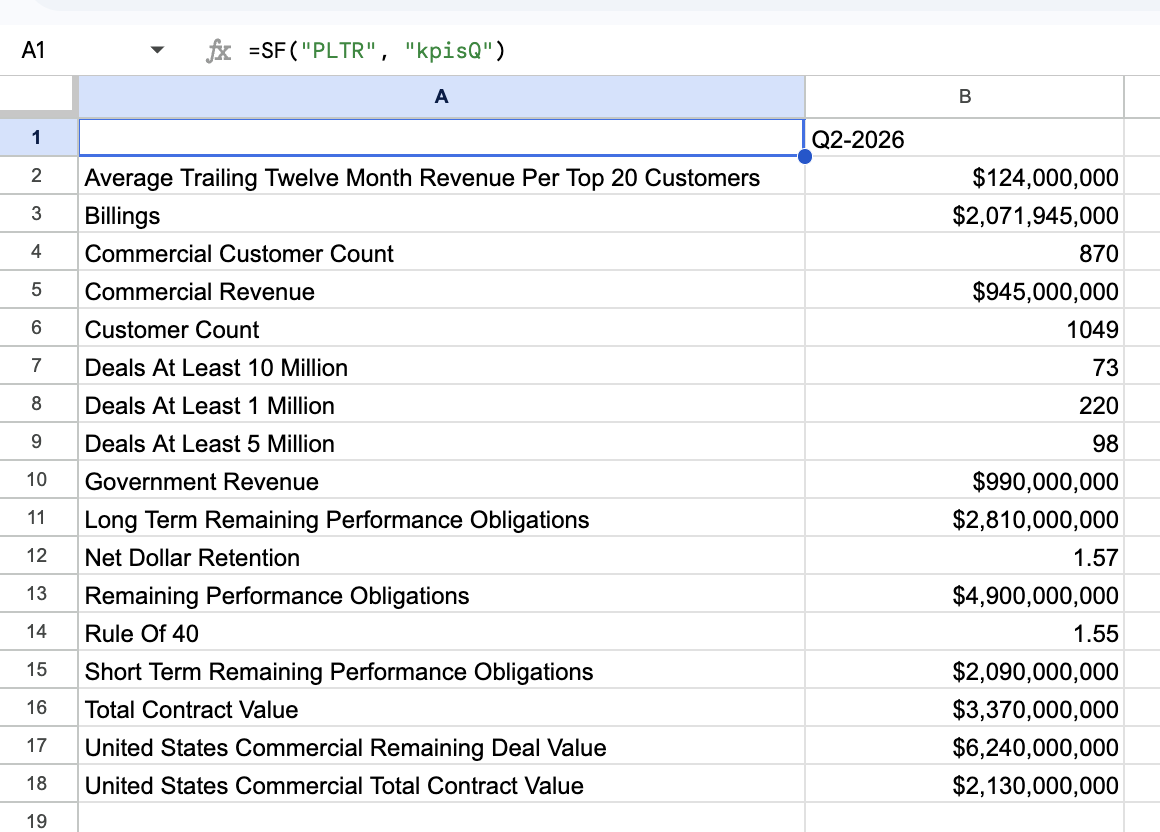
Example 3 - Q4 KPIs for a specific year
=SF("PLTR", "kpisQ4", "all", "2023")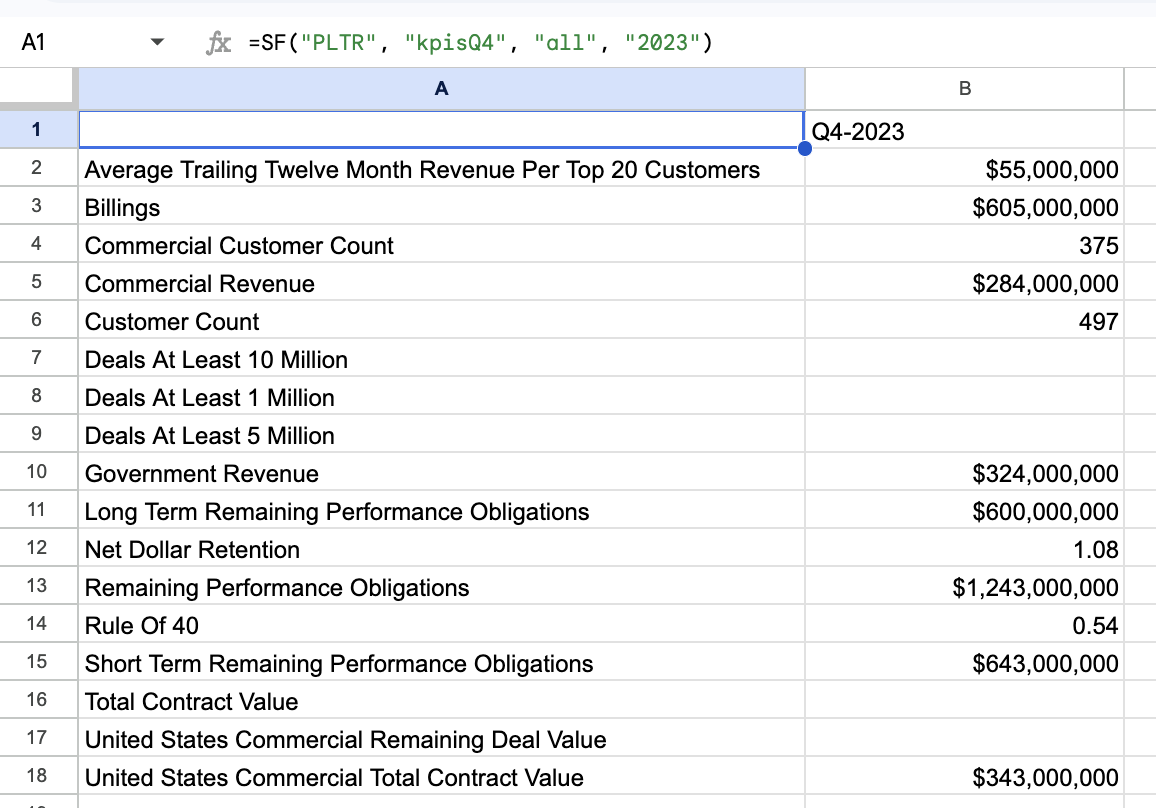
Example 4 - Selected metrics over a year range, padded
Replace the placeholders with Metric ID values from the company's catalog:
=SF("PLTR", "kpis", "commercialCustomerCount&commercialRevenue", "2020-2025")
Example 5 - Annual KPIs converted to AUD and scaled to millions
=SF("AAPL", "kpis", "all", "2020-2025", "currency=AUD&scale=M")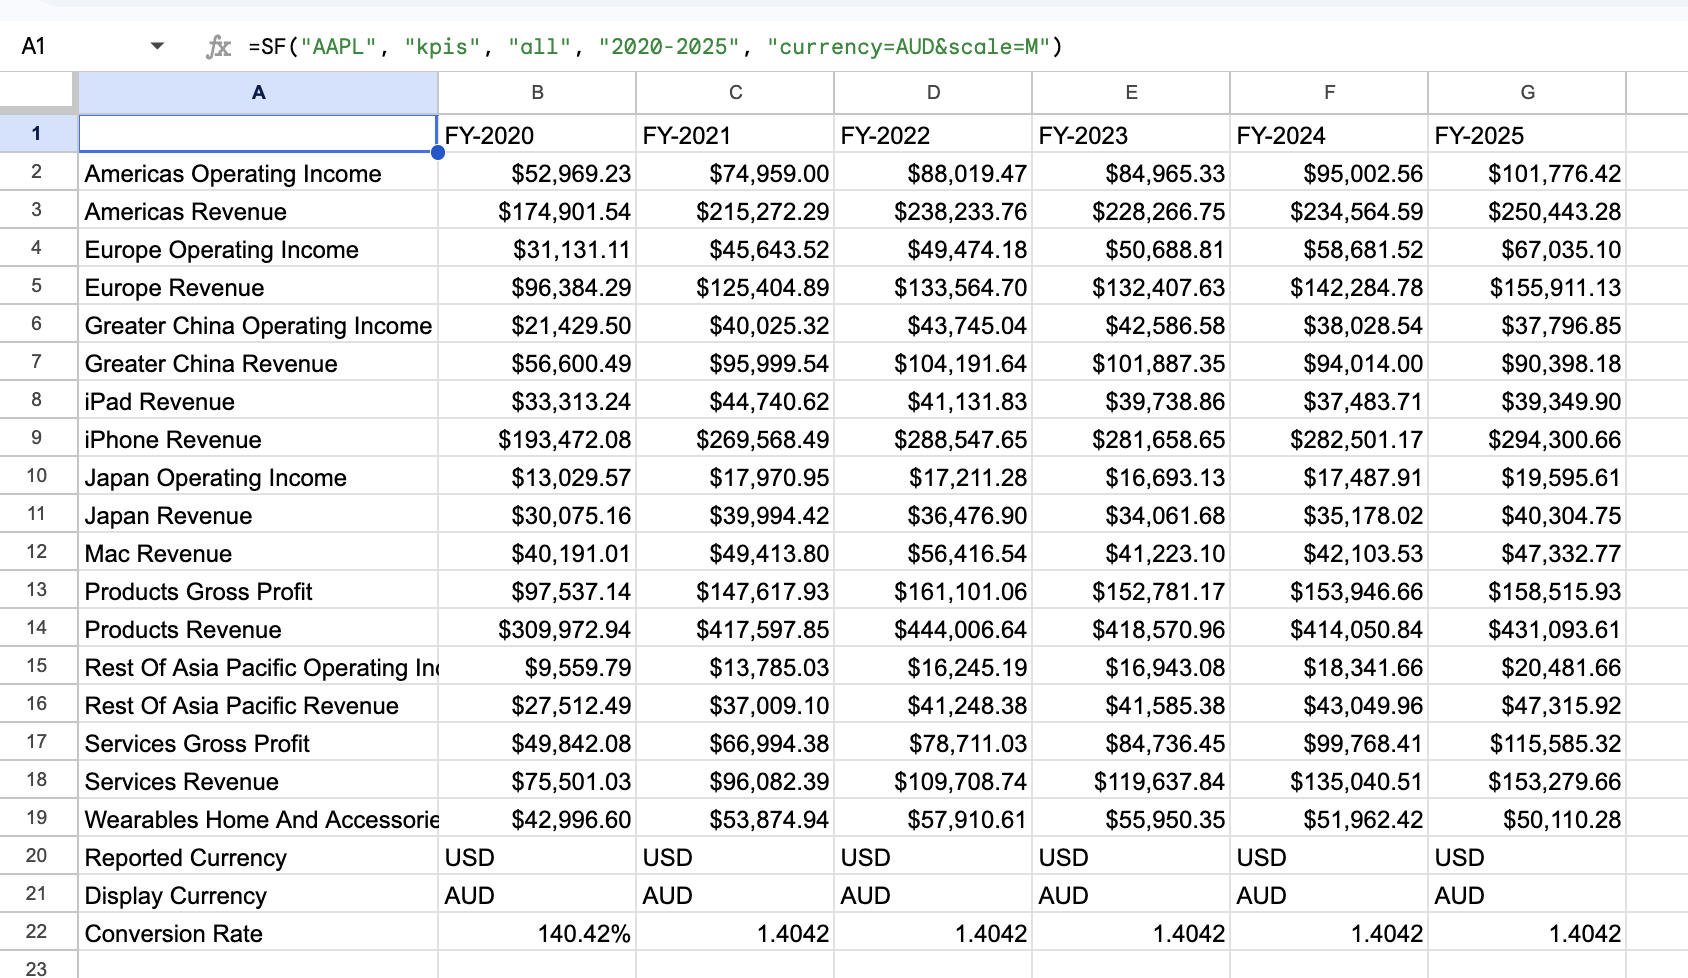
Example 6 - Catalog display
=SF("AAPL", "kpiCatalog")