Historical Shares and Float
The shares function provides historical outstanding shares and float data for a given security. The data is available on a near daily basis with up to 3 years of data available. The outstanding shares and float data is useful for understanding the capital structure of a company and can be used to calculate various financial ratios and metrics. The shares function is run within the SF_TIMESERIES where the period argument is set to "shares".
Breaking change: freeFloat is now returned as a decimal fraction. A stock with a 25% free float returns 0.25 instead of 25. Update formulas that assumed percentage-point values.
=SF_TIMESERIES("AAPL", startDate, endDate, "shares", metrics, options)symbolis the ticker symbol of the financial asset (e.g.,"AAPL"). You can use our Symbol Search to find the correct ticker symbol.startDateis the starting date of the time series, written in iso format YYY-MM-DD, e.g."2000-04-03"endDateis the ending date of the time series, written in iso format YYY-MM-DD, e.g."2019-12-24"metricsselect what metrics to output, this can be"all", a single metric or a combination by chaining together as many metrics as you'd like using&, e.g.,"date&outstandingShares&floatShares".optionsformat options for the output. Results are returned latest first by default. Use"-"to reverse the order so the oldest date comes first, and"NH"to remove the header row. Combine them with &, e.g."-&NH".
The shares metrics options are:
All (
"all")Date (
"date")Outstanding Shares (
"outstandingShares")Float Shares (
"floatShares")Free Float (
"freeFloat")
Examples
Example 1 - Display all outstanding shares and float data
=SF_TIMESERIES("AAPL", "2022-01-01", "2024-09-19", "shares", "all")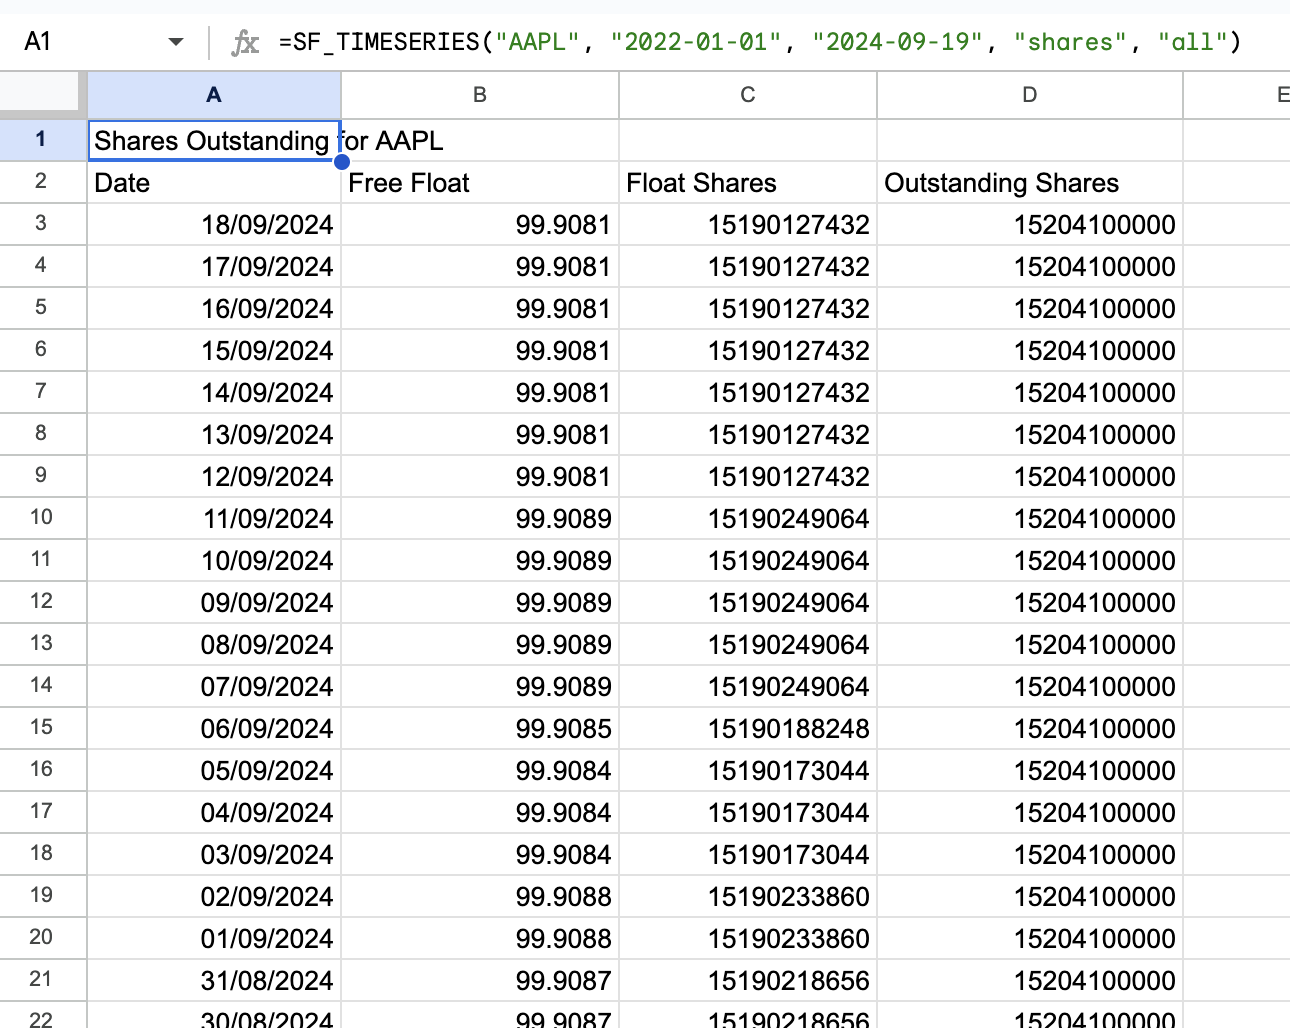
Example 2 - Display selected metrics
=SF_TIMESERIES("AAPL", "2022-01-01", "2024-09-19", "shares", "date&outstandingShares&floatShares")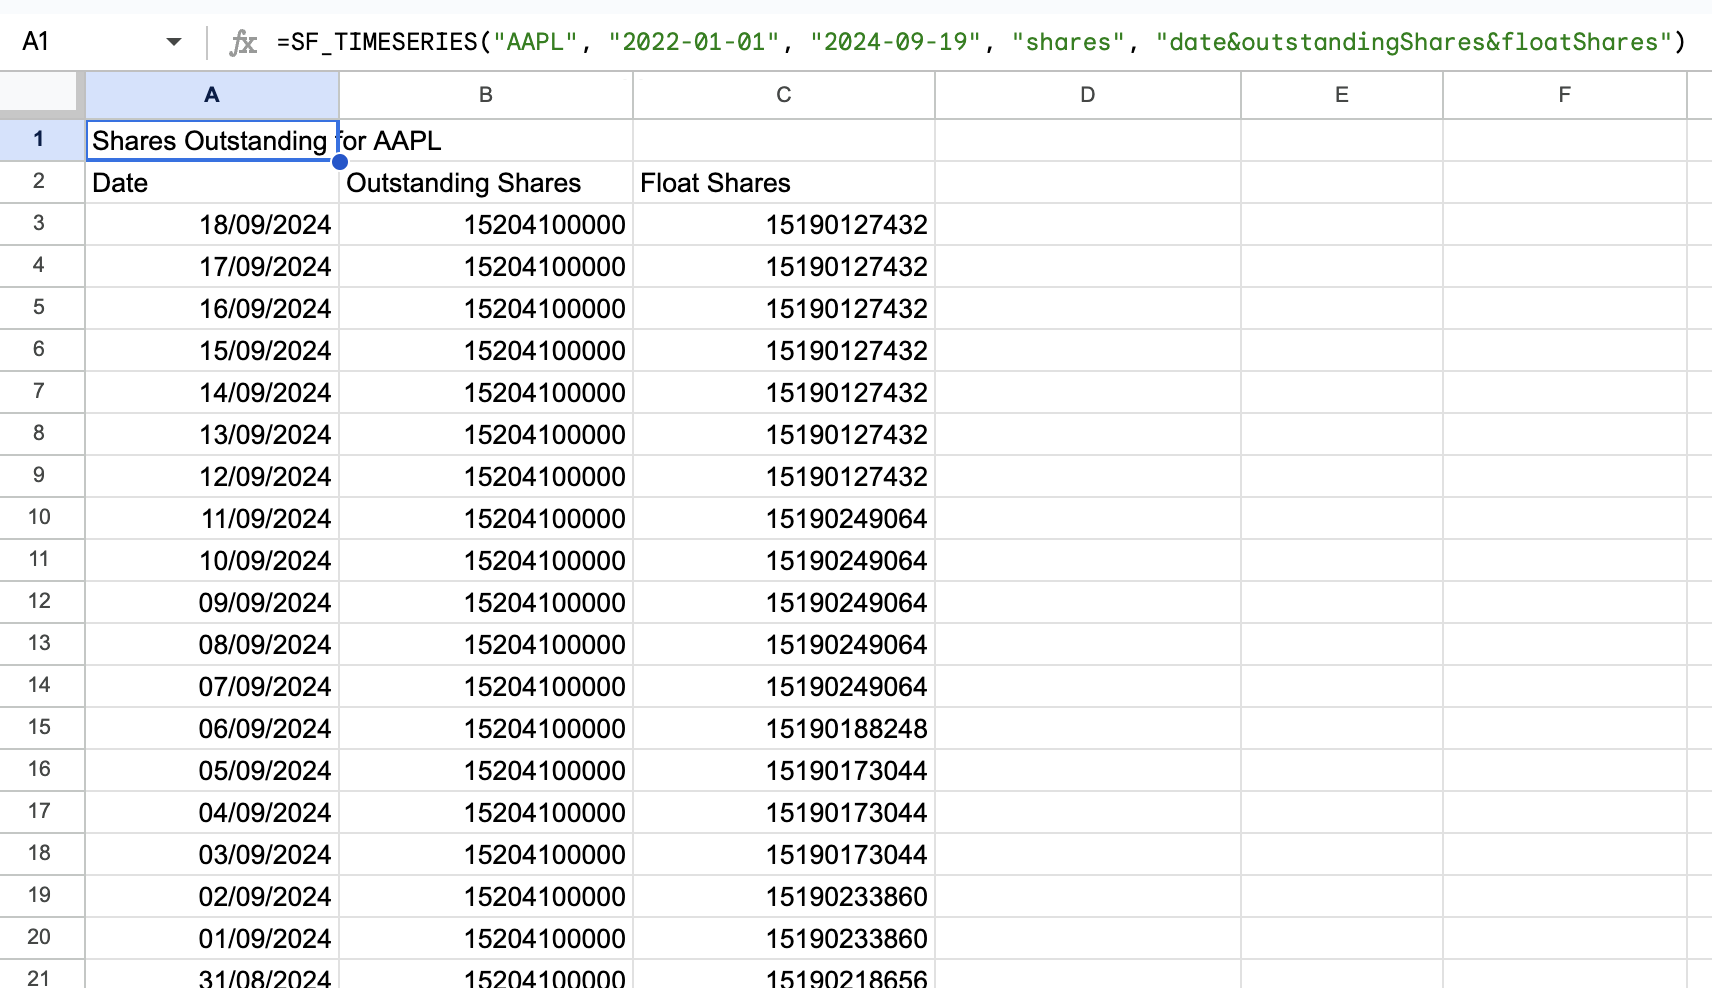
Example 3 - Display single metric
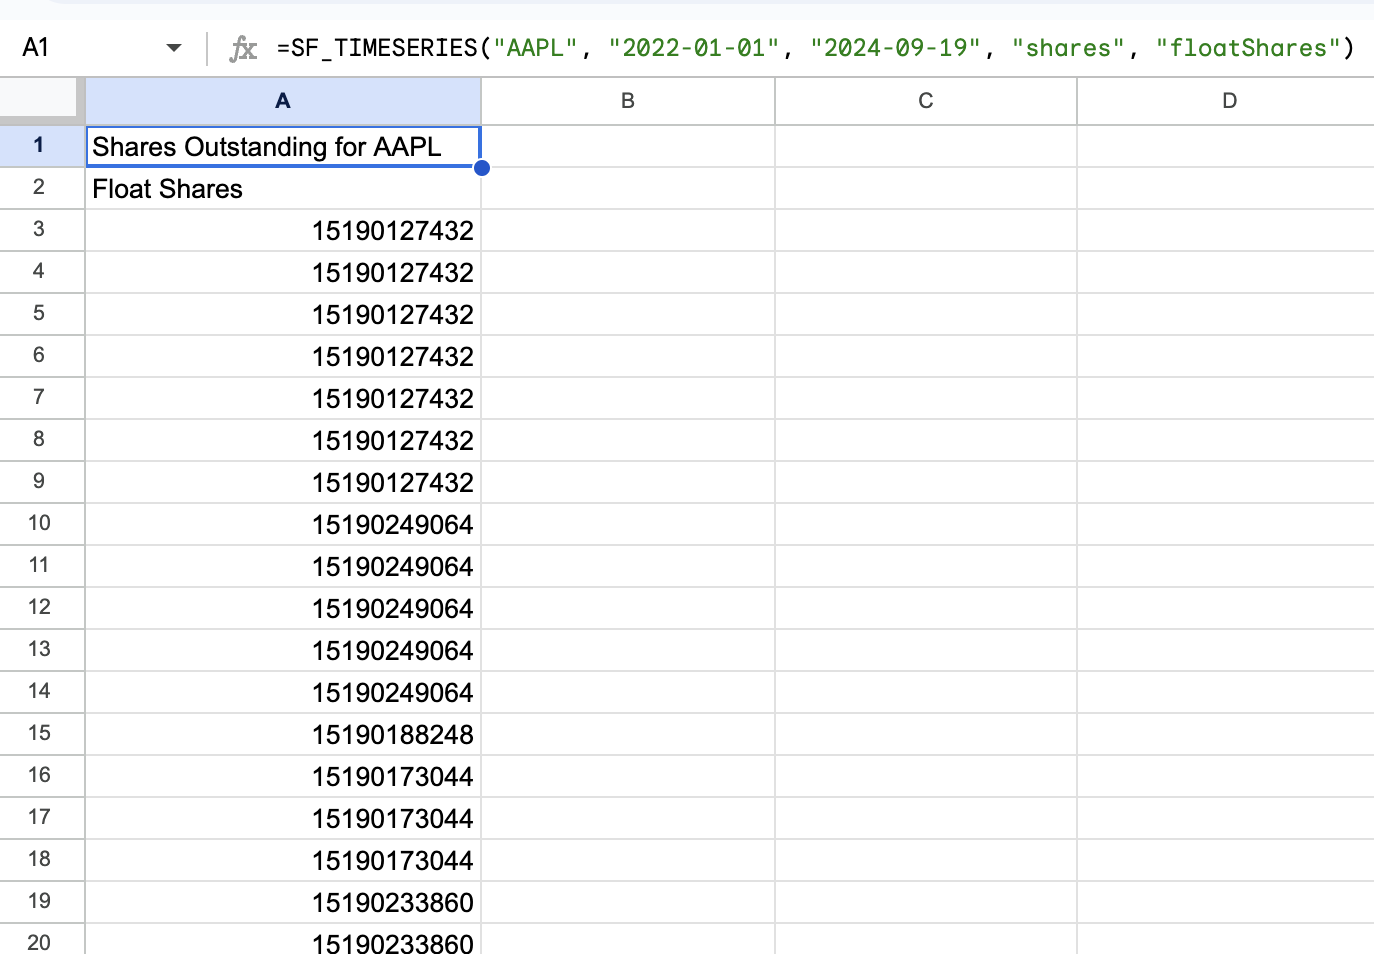
=SF_TIMESERIES("AAPL", "2022-01-01", "2024-09-19", "shares", "floatShares")