Price Change Batch
The change data type can be applied to multiple stocks at once to perform a batch request.
=SF(<range>, "change", metric, "", options)<range>is a range of cells e.g.A1:A100. You can use our Symbol Search to find the correct ticker symbols.metricselects what metrics to display (see options below), display all metrics by leaving blank or using"all". Chain together as many metrics as you'd like using&, e.g.,"1D&5D&1M".optionsadjusts the formatting of the output. There are two available options, you can set this field to"NH"for no header row and/or"decimal"to return the change as a decimal rather than a percentage. Combine options with&, e.g.,"NH&decimal".
The price change metric options are:
All (
"all")1 Day (
"1D")5 Days (
"5D")1 Month (
"1M")3 Months (
"3M")6 Months (
"6M")Year to date (
"ytd")1 Year (
"1Y")3 Years (
"3Y")5 Years (
"5Y")10 Years (
"10Y")Max (
"max") - this is the total price change since inception.
Examples
Example 1 - Single metric batch
=SF(A2:A12, "change", "1D")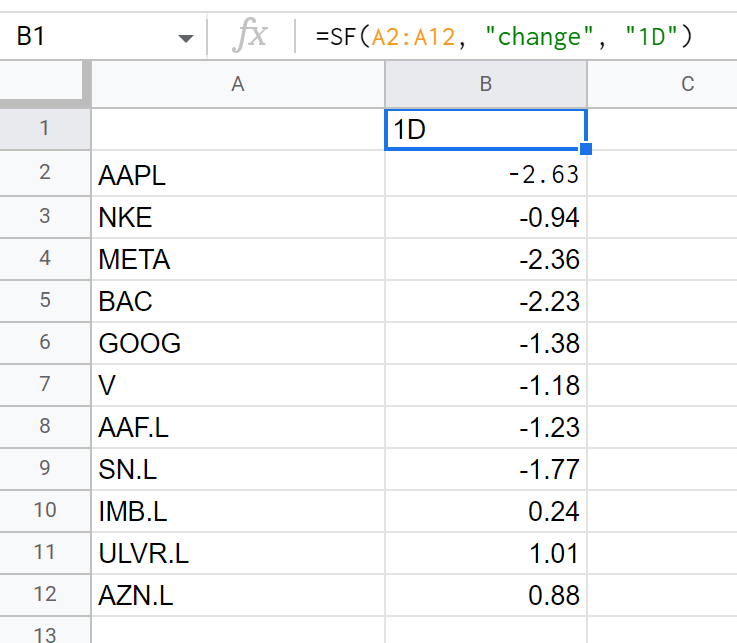
Example 2 - Multiple metrics batch
=SF(A2:A12, "change", "1D&5D&1M")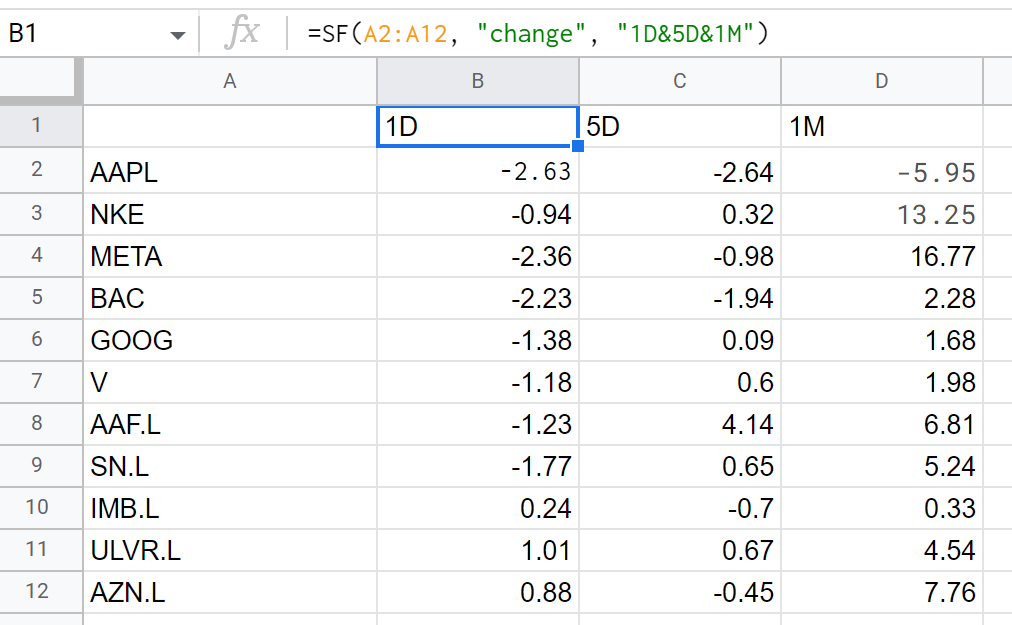
Example 3 - All batch
=SF(A2:A12, "change", "all")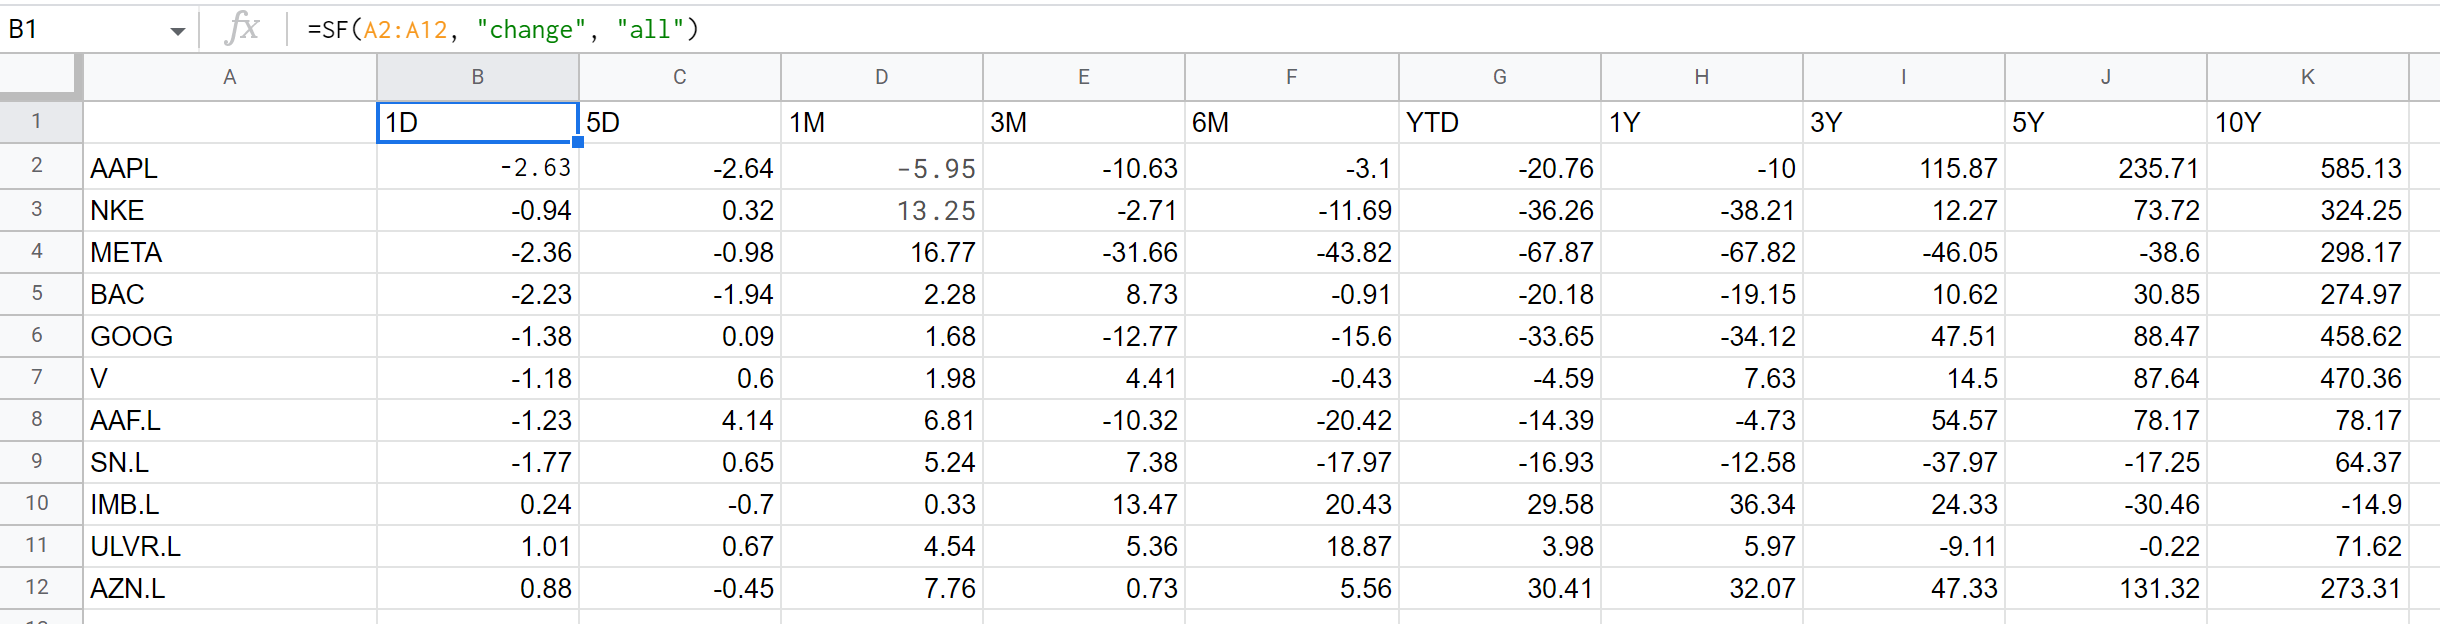
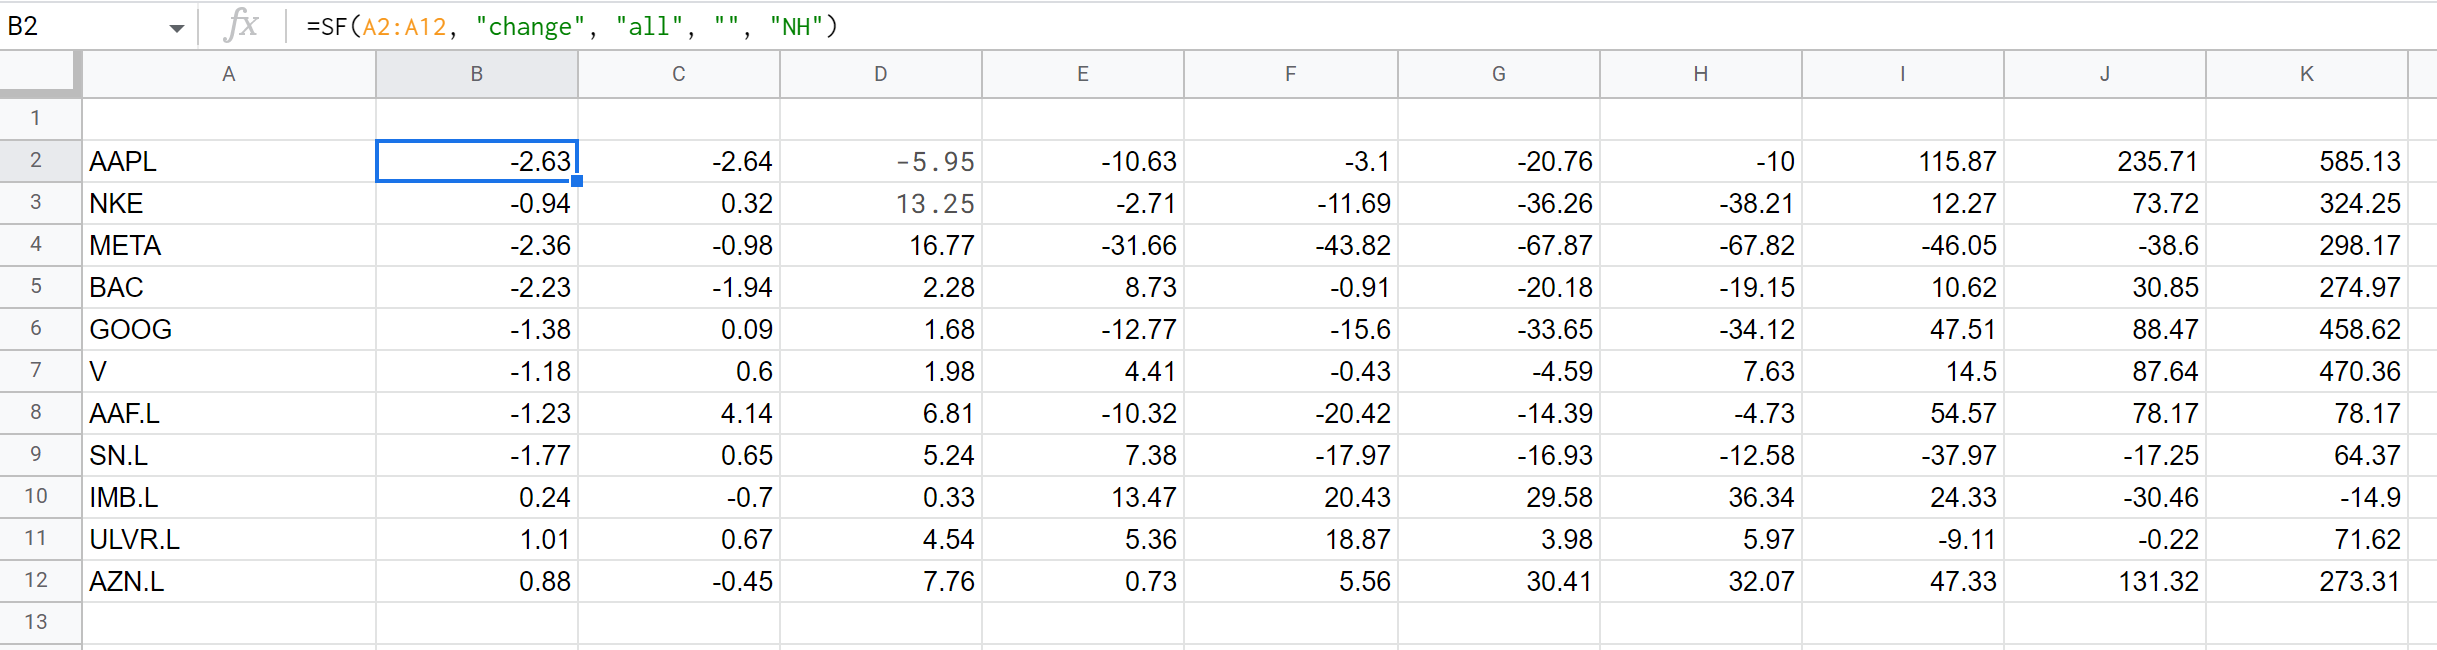
Example 4 - All batch with options
=SF(A2:A12, "change", "all", "", "NH")IMPORTANT: Notice the placement of the formula in this case is adjacent to the first stock symbol to ensure the data output aligns with the stock symbols.