Price Change
The change data type is the fastest way to quickly return percentage price change data over standardised time periods such as 1 day or 3 months. It is important to note that if multiple metrics are selected then the output of the data will be an array (multi-cell). In SheetsFinance fashion the change data type is also batchable see our Price Change Batch for how you can apply the function to multiple stocks at once.
=SF(symbol, "change", metric, "", options)symbolis the ticker symbol of the financial asset (e.g.,"AAPL"). You can use our Symbol Search to find the correct ticker code.metricselects what metrics to display (see options below), display all metrics by leaving blank or using"all". Chain together as many metrics as you'd like using&, e.g.,"1D&5D&1M".optionsadjusts the formatting of the output. There are two available options, you can set this field to"NH"for no header row and/or"decimal"to return the change as a decimal rather than a percentage. Combine options with&, e.g.,"NH&decimal".
The price change metric options are:
All (
"all")1 Day (
"1D")5 Days (
"5D")1 Month (
"1M")3 Months (
"3M")6 Months (
"6M")Year to date (
"ytd")1 Year (
"1Y")3 Years (
"3Y")5 Years (
"5Y")10 Years (
"10Y")Max (
"max") - this is the total price change since inception.
Metric Chaining: Remember like with many of our available functions you can chain metrics together with the & operator. For example "1Y&3Y&5Y" or "1D&5D". Having multiple metrics will result in an array output (multi-cell output) with a header row included by default. You can remove the header row by applying the "NH" option.
Examples
Example 1 - Single metric
=SF("AAPL", "change", "1D")

0.59
Example 2 - Multiple metrics
=SF("AAPL", "change", "1D&5D&1M")

[multi-cell array]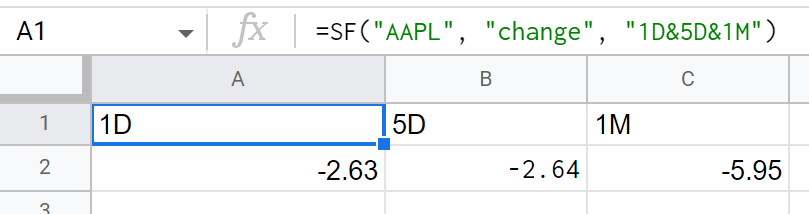
Example 3 - All metrics
=SF("AAPL", "change", "all")

[multi-cell array]
Example 4 - Multiple metrics with options
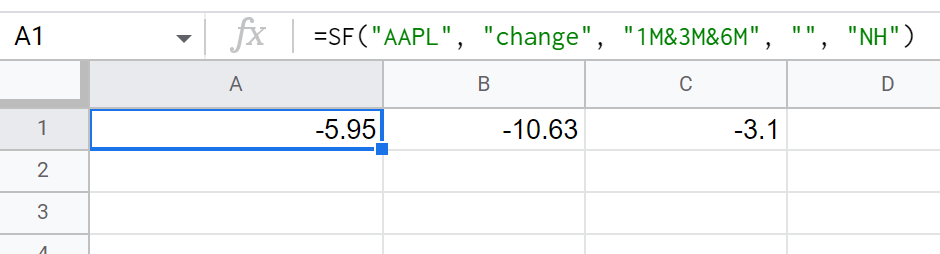
=SF("AAPL", "change", "1M&3M&6M", "", "NH")

[multi-cell array]